Pre-Sales Support
Mutual Funds and ETFs - 800-456-7526
Monday-Thursday: 8:00 a.m. – 6:00 p.m. ET
Friday: 8:00 a.m. – 5:00 p.m. ET
Post-Sales and Website Support
888-843-7824
Monday-Friday: 9:00 a.m. - 6:00 p.m. ET
Asset Class and Index Definitions
Bloomberg Emerging Markets Aggregate Bond Index measures USD-denominated debt from sovereign, quasi-sovereign, and corporate emerging-market issuers.
Bloomberg Global Aggregate Bond Index is a flagship measure of global investment-grade debt from a multitude of local currency markets.
Bloomberg Global High Yield Index is a multi-currency flagship of the global high-yield debt market.
Bloomberg Municipal Bond Index is designed to cover the USD-denominated long-term tax-exempt bond market.
Bloomberg US Treasury 1-3 Year Index measures US dollar-denominated, fixed-rate, nominal debt issued by the US Treasury with 1-3 years to maturity.
Bloomberg 1-3 Year U.S. Government/Credit Index is an unmanaged index comprised of the U.S. Government/Credit component of the Bloomberg U.S. Aggregate Bond Index.
Bloomberg 7-10 Year US Treasury Bond Index measures US dollar-denominated, fixed-rate, nominal debt issued by the US Treasury with 7-10 years to maturity.
Bloomberg US ABS Index tracks the ABS component of the Bloomberg US Aggregate Bond Index.
Bloomberg US Aggregate Bond Index is composed of securities that cover the US investment grade fixed rate bond market, with index components for government and corporate securities, mortgage pass-through securities, and asset-backed securities.
Bloomberg US CMBS Investment Grade Index measures the market of US Agency and US Non-Agency conduit and fusion CMBS deals.
Bloomberg US Corporate High Yield Bond Index is an unmanaged broad-based market-value-weighted index that tracks the total return performance of non-investment grade, fixed-rate, publicly placed, dollar denominated and nonconvertible debt registered with the Securities and Exchange Commission.
Bloomberg US Corporate Bond Index measures the investment grade, fixed-rate, taxable corporate bond market.
Bloomberg US MBS Index tracks fixed-rate agency mortgage backed pass-through securities guaranteed by Ginnie Mae, Fannie Mae, and Freddie Mac
Bloomberg US Treasury Bill 1-3 Month Index measures the performance of public obligations of the US Treasury that have a remaining maturity of 1-3 months.
Bloomberg US Treasury Bond Index measures US dollar-denominated, fixed-rate, nominal debt issued by the US Treasury.
IA SBBI US 30-Day T-Bill Index measures the performance of a single issue of outstanding Treasury bill which matures closest to, but not beyond, one month.
IA SBBI US Intermediate-Term Government Bond Index measures the performance of a single issue of outstanding US Treasury note with a maturity of around 5.5 years.
MSCI EAFE Index measures equity from developed-market countries n Europe, Australasia, and the Far East.
MSCI EAFE Growth Index is a free-float weighted index. The Index represents the securities classified as “growth” securities by MSCI that are members of the MSCI EAFE Index.
MSCI EAFE Value Index is a free-float weighted index. The Index represents the securities classified as “value” securities by MSCI that are members of the MSCI EAFE Index.
MSCI World ex USA Index is a free float-adjusted market capitalization index that captures large and mid cap representation across developed markets countries excluding the United States.
Russell 1000 Growth Index is an unmanaged index which measures the performance of those Russell 1000 Index companies with higher price-to-book ratios and higher forecasted growth values.
Russell 1000 Index measures the performance of the large-cap segment of the U.S. equity universe. It is a subset of the Russell 3000 Index and includes approximately 1000 of the largest securities based on a combination of their market cap and current index membership.
Russell 1000 Value Index is an unmanaged index measuring the performance of those Russell 1000 Index companies with lower price-to-book ratios and lower forecasted growth values.
Russell 2000 Growth Index is an unmanaged index of those Russell 2000 Index growth companies with higher price-to-book ratios and higher forecasted growth values.
Russell 2000 Index measures the performance of the small-cap segment of the U.S. equity universe.
Russell 2000 Value Index measures the performance of the small-cap value segment of the US equity universe. It includes those Russell 2000 Index companies with lower price-to-book ratios and lower forecasted growth values.
Russell Mid Cap Growth Index measures the performance of the mid-cap growth segment of the US equity universe. It includes those Russell Midcap Index companies with higher price-to-book ratios and higher forecasted growth values.
Russell Mid Cap Index measures the performance of the mid-cap segment of the US equity universe.
Russell Mid Cap Value Index measures the performance of the mid-cap value segment of the U.S. equity universe. It includes those Russell Midcap Index companies with lower price-to-book ratios and lower forecasted growth values.
S&P 500 Index is a market capitalization-weighted price index composed of 500 widely held common stocks.
Additional Information About Index Providers:
This presentation is for illustrative purposes only and should not be construed as investment advice. They are based on available information and are subject to change without notice.
“Bloomberg®” and any Bloomberg Index are service marks of Bloomberg Finance L.P. and its affiliates, including Bloomberg Index Services Limited (“BISL”), the administrator of the indices (collectively, “Bloomberg”) and have been licensed for use for certain purposes by Hartford Funds. Bloomberg is not affiliated with HartfordFunds, and Bloomberg does not approve, endorse, review, or recommend any Hartford Funds product. Bloomberg does not guarantee the timeliness, accurateness, or completeness of any data or information relating to Hartford Fund products.
Neither MSCI nor any other party involved in or related to compiling, computing or creating the MSCI data makes any express or implied warranties or representations with respect to such data (or the results to be obtained by the use thereof), and all such parties hereby expressly disclaim all warranties of originality, accuracy, completeness, merchantability or fitness for a particular purpose with respect to any of such data. Without limiting any of the foregoing, in no event shall MSCI, any of its affiliates or any third party involved in or related to compiling, computing or creating the data have any liability for any direct, indirect, special, punitive, consequential or any other damages (including lost profits) even if notified of the possibility of such damages. No further distribution or dissemination of the MSCI data is permitted without MSCI's express written consent.
Important Risks: Investing involves risk, including the possible loss of principal. • Fixed income security risks include credit, liquidity, call, duration, and interest-rate risk. As interest rates rise, bond prices generally fall. ●Investments in high-yield (“junk”) bonds involve greater risk of price volatility, illiquidity, and default than higher-rated debt securities. ●Municipal securities may be adversely impacted by state/local, political, economic, or market conditions. Although municipal securities are exemptfrom federal income taxes, investors may be subject to the federal Alternative Minimum Tax as well as state and local income taxes. Capital gains, if any, are taxable. ●The risks associated with mortgage-related and asset backed securities as well as collateralized loan obligations (CLOs) include credit, interest-rate, prepayment, liquidity, default and extension risk. • Foreign investments may be more volatile and less liquid than US investments and are subject to the risk of currency fluctuations and adverse political, economic and regulatory developments. These risks may be greater, and include additional risks, for investments in emerging markets. ●Small-and mid-cap securities can have greater risks and volatility than large-cap securities.
Record Levels of Cash Are Sitting on the Sidelines
Attractive yields on cash and market uncertainty have led to record levels of cash on the sidelines. If yields decline, investors may want to put their cash to work in other asset classes.
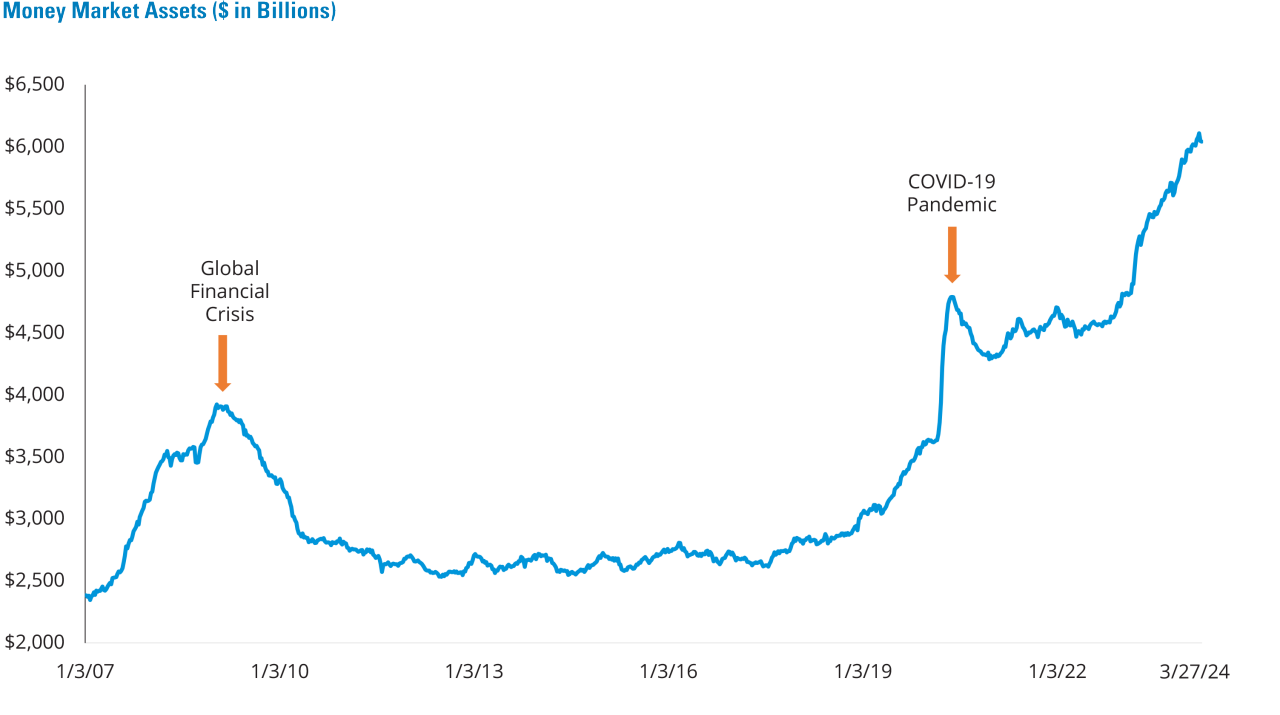
Past performance does not guarantee future results. As of 1/3/07-3/27/24. Data Source: ICI, 4/24.
Returns from High CD Rates May Be Too Good to Be True
When 1-year CD ratespeaked in the past, theirreturns were outpaced bymost asset classes duringthe following year.
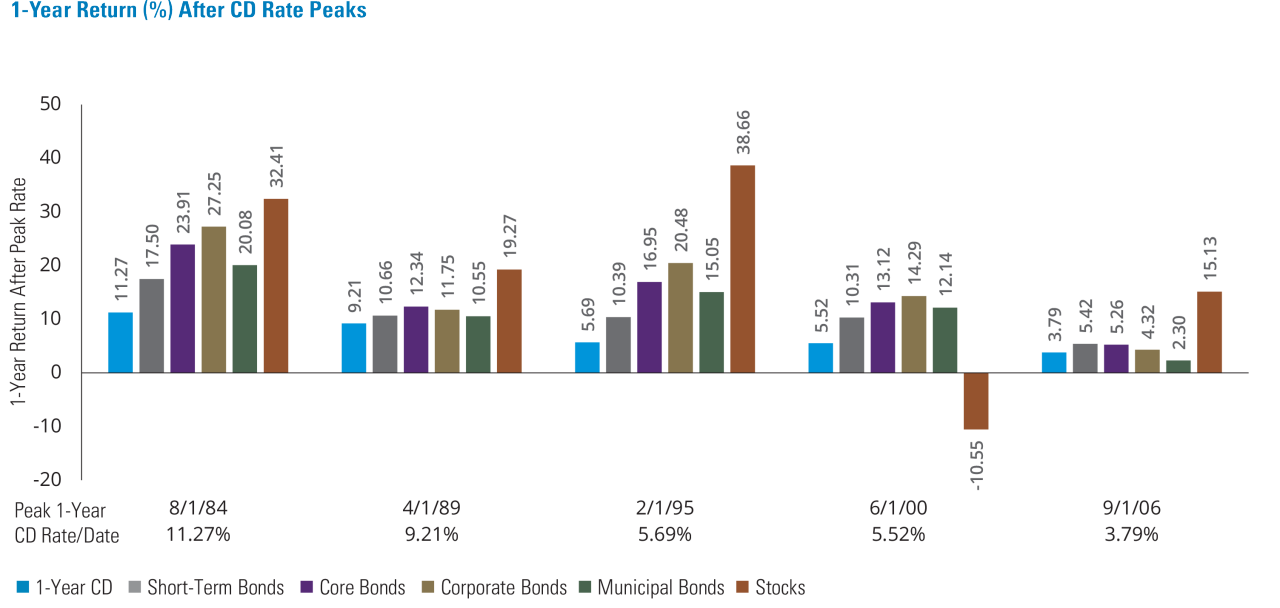
Past performance does not guarantee future results. As of 8/84-3/24. Indices are unmanaged and not available for direct investment. Asset classes are represented by: 1-Year CD rates (Bankrate’s 12-month CD national average), Short-Term Bonds (Bloomberg 1-3 Year US Government/Credit Index), Core Bonds (Bloomberg US Aggregate Bond Index), Corporate Bonds (Bloomberg US Corporate Bond Index), Municipal Bonds (Bloomberg Municipal Bond Index), Stocks (S&P 500 Index). Data Source: Morningstar and Hartford Funds, 4/24.
Strong Fixed-Income Returns After Negative Years
Fixed-income indices have delivered 8 periods of negative returns over the past 97 years. In each of the previous negative periods, investors who stayed the course were eventually rewarded.
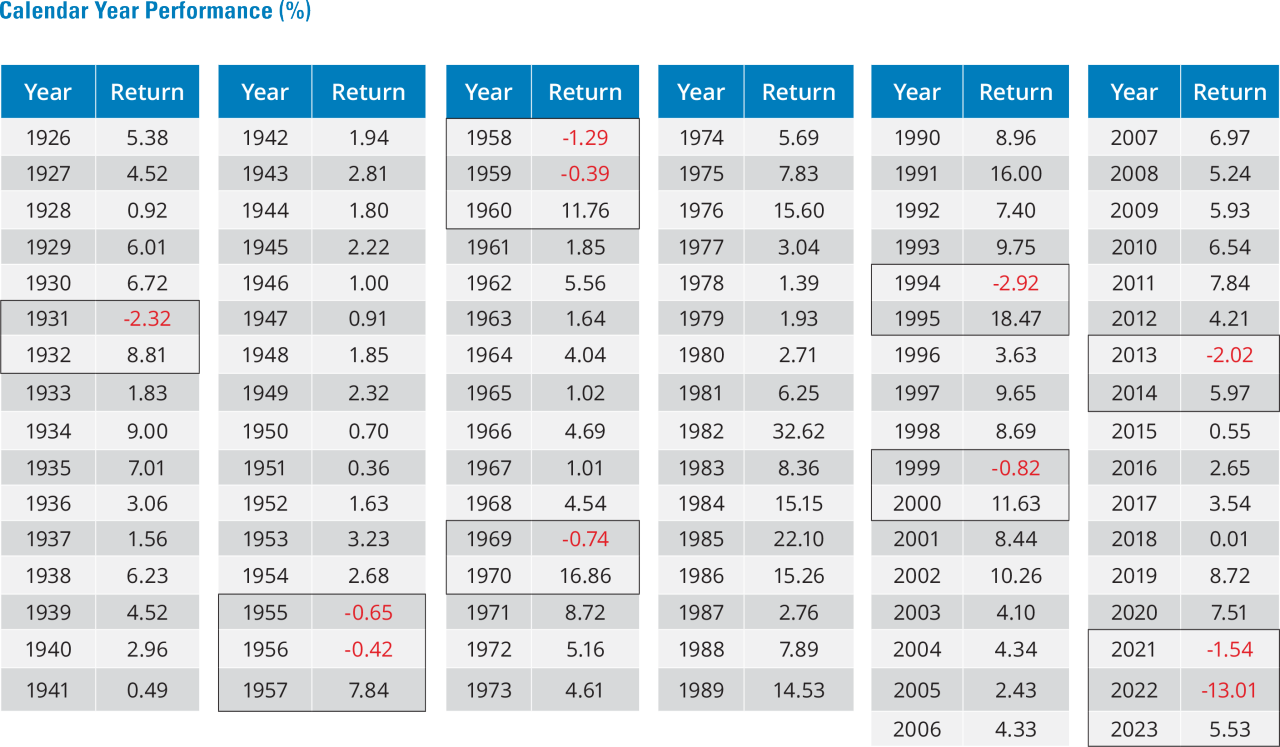
Past performance does not guarantee future results. are for IA SBBI US Intermediate-Term Government Bond Index from 1926-1975 and the Bloomberg US Aggregate BondIndex from 1976-2023. Data Source: Morningstar, 1/24.
A Discount on Bond Prices Now Could Mean Attractive Returns Later
The average bond price is at its lowest point since the 1980s. Since bonds typically mature at face value barring any defaults,the current price creates an opportunity for total return.
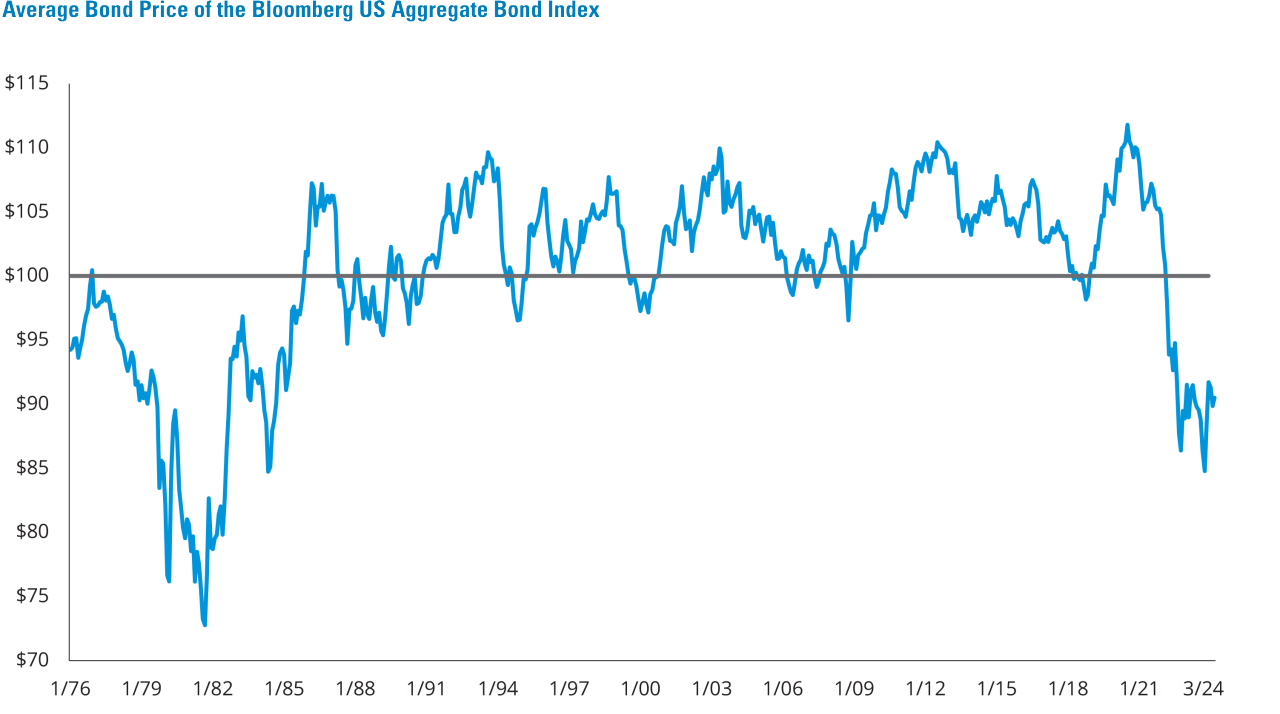
Past performance does not guarantee future results. As of 1/76-3/24. Data Source: Bloomberg, 4/24.
Income Returns to Fixed Income
The income available across fixed-income asset classes is more attractive than it’s been in many years. But inflation and tighter monetary policy mean that choosing the right bonds has become more complex.
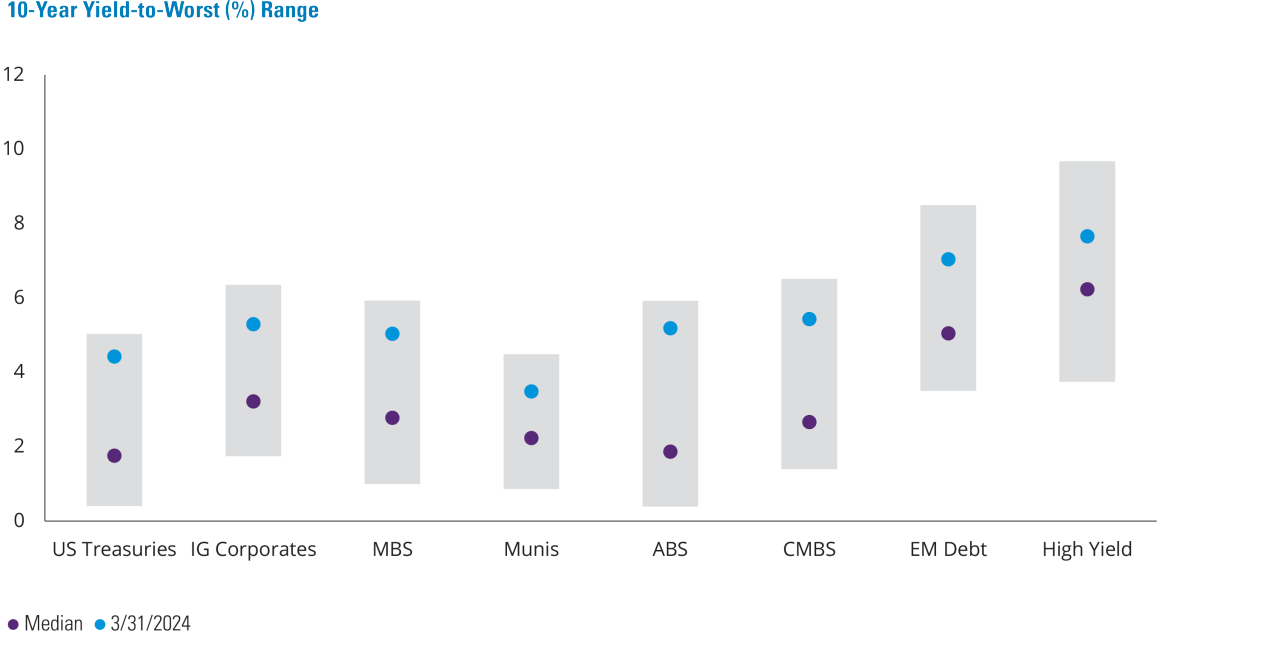
Past performance does not guarantee future results. As of 3/31/24. Yield to worst is the minimum yield that can be received on a bond assuming the issuer doesn’t default on any of its payments. Asset classes are represented by the following indices: US Treasuries (Bloomberg US Treasury Index), IG/Investment Grade Corporates (Bloomberg US Corporate Bond Index), MBS/Mortgage-Backed Securities (Bloomberg US MBS Index), Munis/Municipal Bonds (Bloomberg Municipal Bond Index), ABS/Asset-Backed Securities (Bloomberg US ABS Index), Commercial Mortgage Backed Securities/CMBS (Bloomberg US CMBS Investment Grade Index), EM Debt (Bloomberg Emerging Markets Aggregate Bond Index), High Yield (Bloomberg US Corporate High Yield Bond Index). Data Source: Bloomberg and Morningstar, 4/24.
Opportunity for Enhanced Returns in Fixed Income
While yield-to-worst values have come down from recent highs, they still are elevated compared to long-term averages.
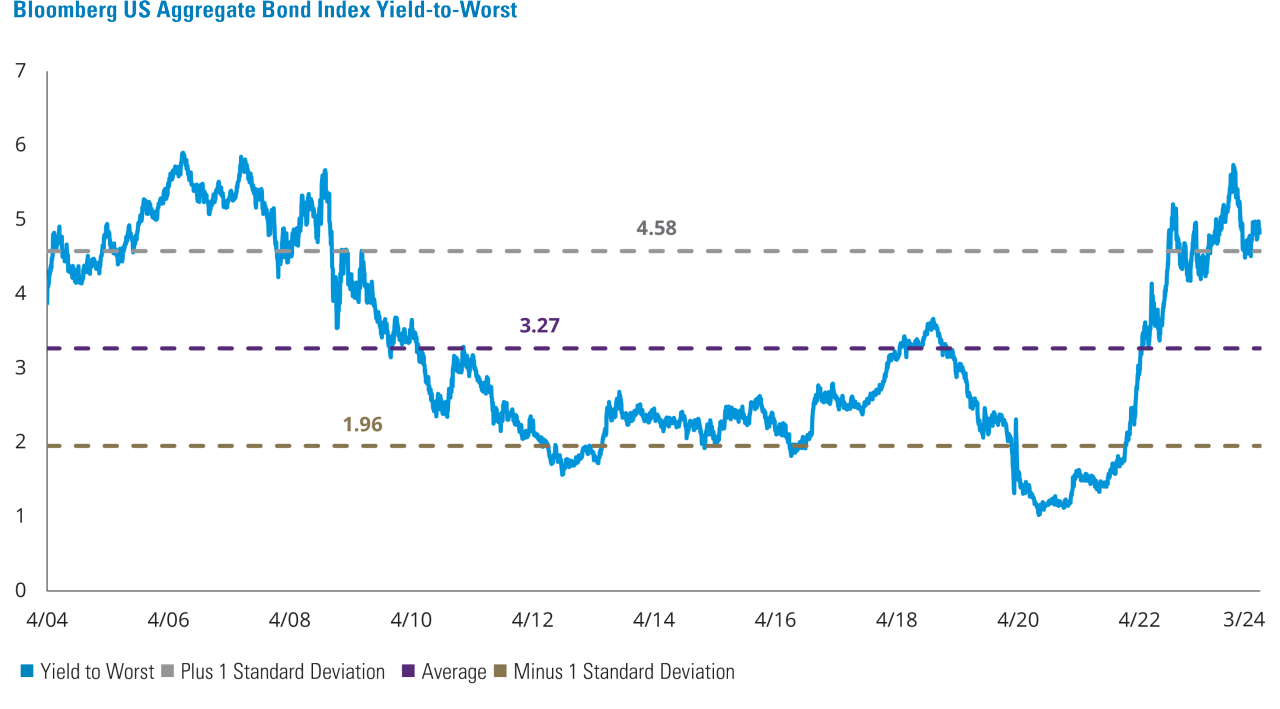
Past performance does not guarantee future results. As of 4/04-3/24. Standard deviation measures the portfolio’s total-return volatility. A higher standard deviation indicates greater historical volatility. Data Source: Morningstar, Factset, and Hartford Funds, 4/24.
Municipal Bond Yields Are Attractive
The benefits of tax free income can make municipal bonds look even more attractive to investors.
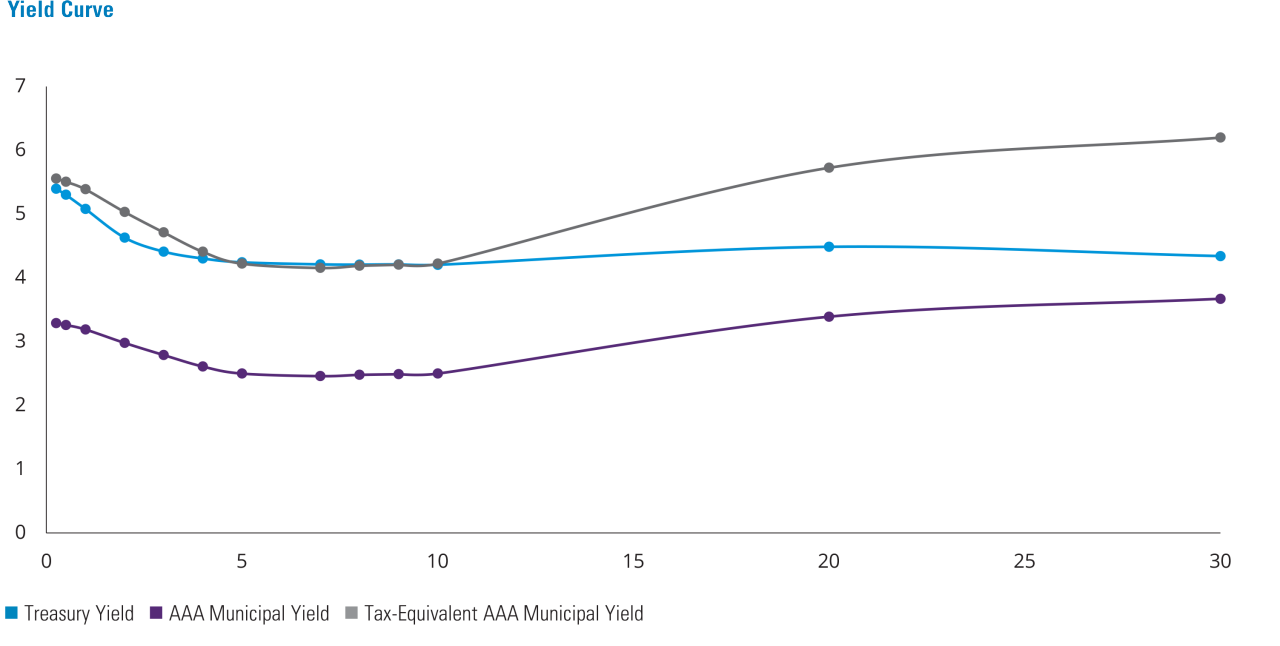
Past performance does not guarantee future results. As of 3/31/24. Tax-equivalent yield assumes 37% marginal tax bracket and Medicare tax of 3.8% on net interest income. DataSource: Bloomberg and Morningstar, 4/24.
Yields and the Fed Have Moved Together
Timing the bond market perfectly is impossible, but fixed-income yields have historically begun to decline prior to the Fed’s first rate cut.
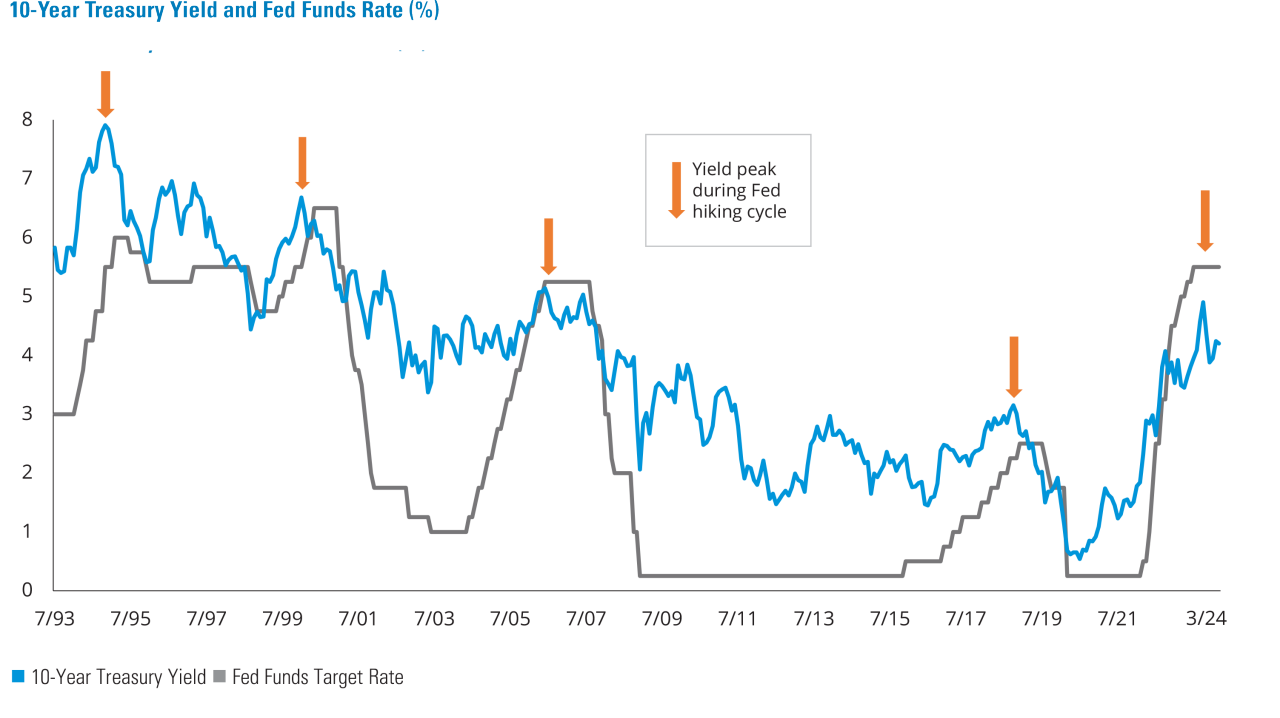
Past performance does not guarantee future results. As of 7/93-3/24. The Federal Funds Rate is set by the Federal Open Market Committee (FOMC) and is the rate at which commercial banks borrow and lend their excess reserves to each other overnight. Data Source: FactSet, Hartford Funds, 4/24.
How Changing Interest Rates Affect Bond Prices
Rising and falling interest rates can have a significant impact on US Treasuries.
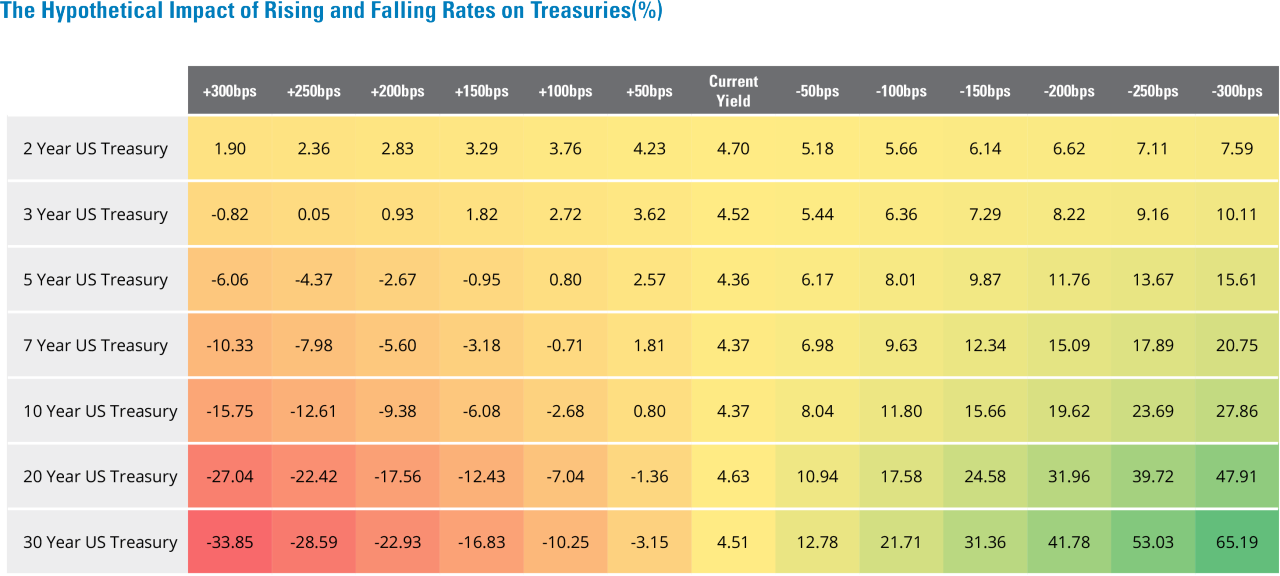
Past performance does not guarantee future results. As of 3/24. A basis point (bps) is a unit that is equal to 1/100th of 1%, and is used to denote the change in a financial instrument.The basis point is commonly used for calculating changes in interest rates, equity indexes and the yield of a fixed-income security. For example, +100 bps is the equivalent of a 1% increasein interest rates. Changes to hypothetical return are based on the security’s duration and convexity affect return. Duration is a measure of the sensitivity of an investment’s price to changes in interest rates. Convexity is a measure of how a bond’s duration can change based on the magnitude of an interest rate change. Data Source: Bloomberg and Hartford Funds, 4/24.
Cash Has Lagged When the Fed Stops Hiking
Investors who focus on cash may sacrifice returns because other investments have significantly outperformed cash after the last Fed rate hike.
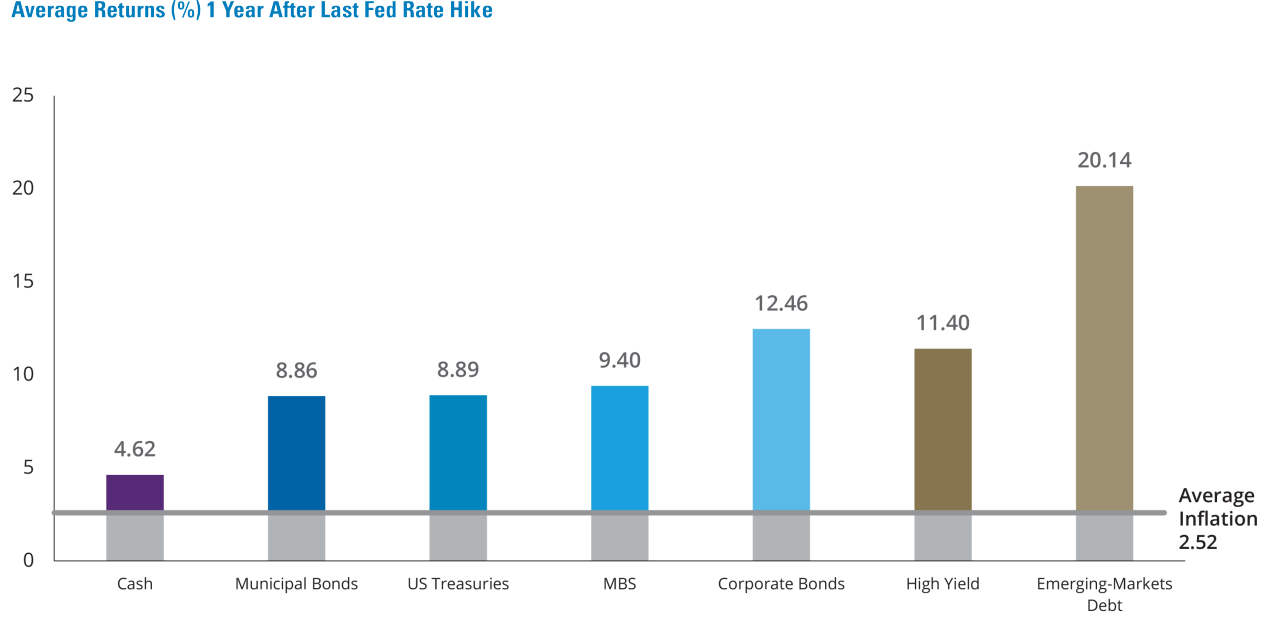
Past performance does not guarantee future results. As of 3/89-3/24. Data shown is based on the five previous time periods 1 year after the Federal Reserve finished hiking the federal funds target rate, which were 3/89-2/90, 3/95-2/96, 6/00-5/01, 7/06-6/07, and 1/19-12/19; it excludes the current interest-rate hiking cycle that began in March 2022. Asset classes are represented by the following indices: Cash (IA SBBI US 30 Day Treasury Bill Index), Municipal Bonds (Bloomberg Municipal Bond Index), US Treasuries (Bloomberg US Treasury Index), MBS (Bloomberg US MBS Index), Corporate Bonds (Bloomberg US Corporate Bond Index), High Yield (Bloomberg US Corporate High Yield Bond Index), Emerging Markets Debt (Bloomberg Emerging Markets Aggregate Bond Index). Emerging-Markets Debt were excluded from 3/89-2/90 due to limited history. Data Source: Morningstar, Factset, and Hartford Funds, 4/24.
Performance Shifts During the Fed Pause
Cash returns have been compelling before the last rate hike, but once the Fed has paused rate hikes or begun cutting rates, stocks and bonds have provided better returns.
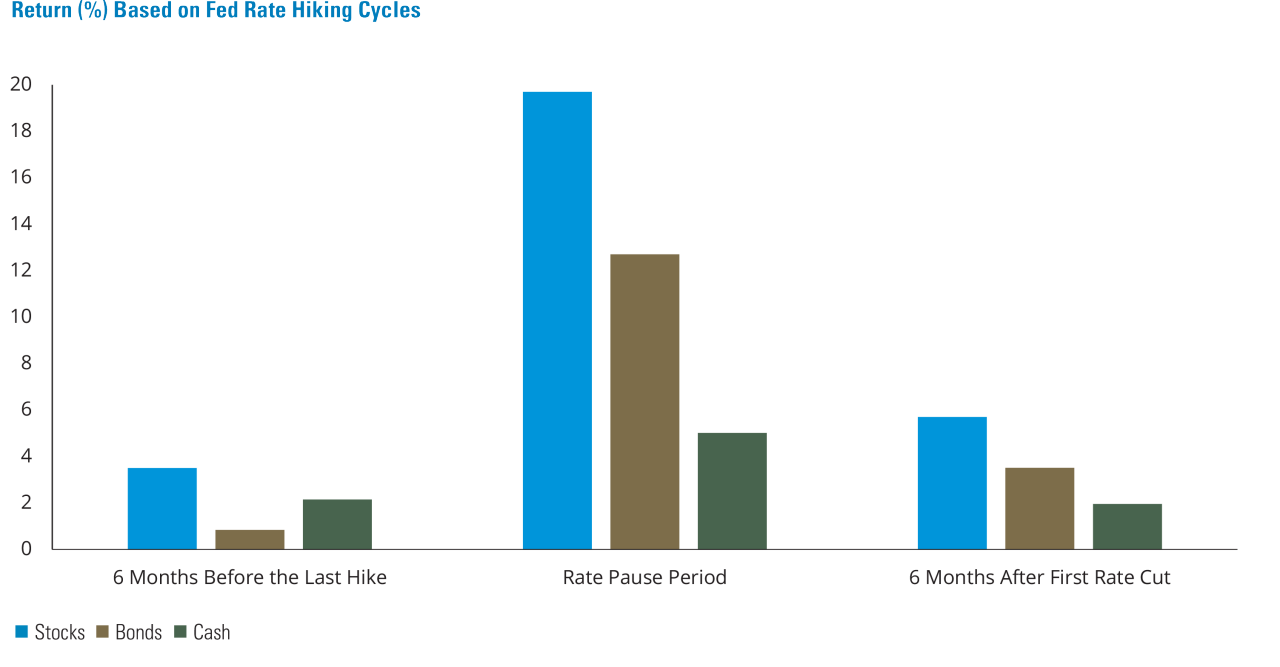
Past performance does not guarantee future results. As of 1/90-3/24. Asset classes are represented by: Stocks (S&P 500 Index), Bonds (Bloomberg US Aggregate Bond Index), Cash (IASBBI US 30 Day Treasury Bill Index). 6 Months Before the Last Hike and 6 Months After First Rate Cut are cumulative returns. Rate Pause Period returns are annualized returns. Data Source:Morningstar, Factset, and Hartford Funds, 4/24.
Finding Fixed Income to Fit Specific Roles in a Portfolio
Seeking higher-yielding bonds can help provide more income, but it may also decrease some of bonds' diversification benefits within a portfolio.
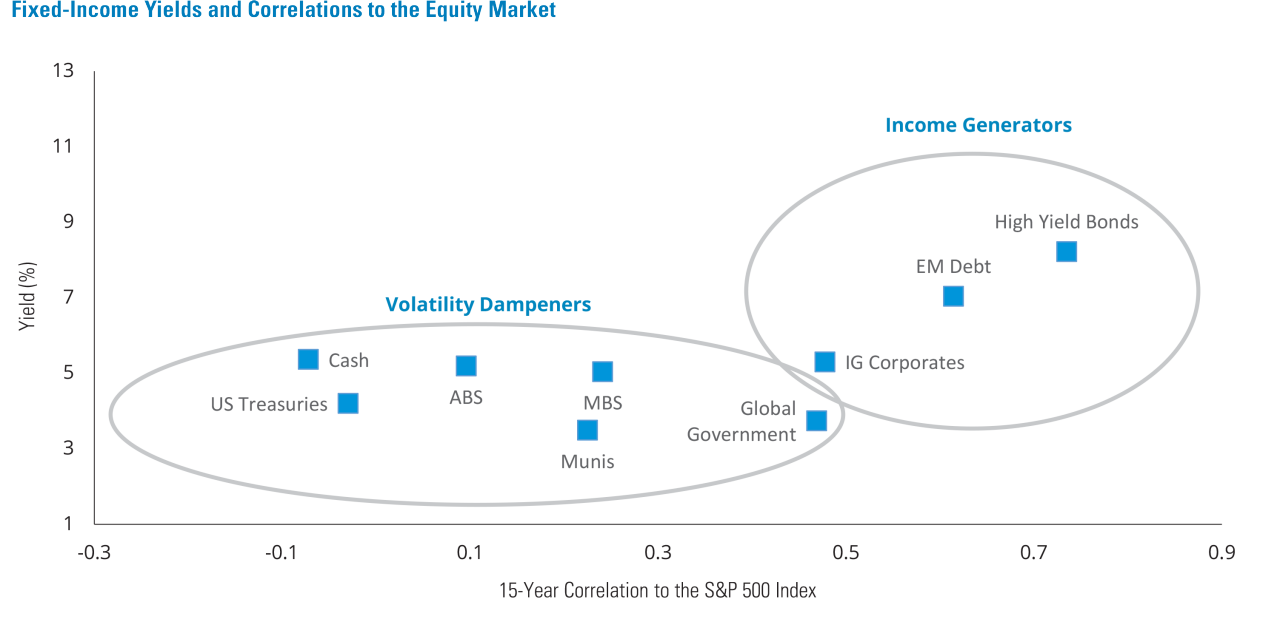
Past performance does not guarantee future results. As of 3/31/24. Income Generators are asset classes that have historically offered higher distribution yields. Volatility Dampeners areasset classes that have historically offered lower volatility than equities. Asset classes are represented by: Cash (Bloomberg US Treasury Bill 1-3 Month Index), US Treasuries (Bloomberg US7-10 Year Treasury Bond Index), MBS (Bloomberg US MBS Index), ABS (Bloomberg US ABS Index), Global Government (Bloomberg Global Aggregate Bond Index), Munis (Bloomberg MunicipalBond Index), IG Corporates (Bloomberg US Corporate Bond Index), EM Debt (Bloomberg Emerging Markets Aggregate Bond Index), High Yield Bonds (Bloomberg Global High Yield Index). Yield is yield to maturity for all indices except Munis, which is Yield to Worst. A correlation of 1.0 indicates the investments have historically moved in the same direction; -1.0 means the investments have historically moved in opposite directions. Diversification does not ensure a profit or protect against a loss. Data Source: Bloomberg, Morningstar, 4/24.
Market Performance Is Being Driven by a Handful of Companies in 2023
The market is made up of thousands of stocks, but those with the largest market cap can have a disproportionate impact on returns.
For the S&P 500 Index:
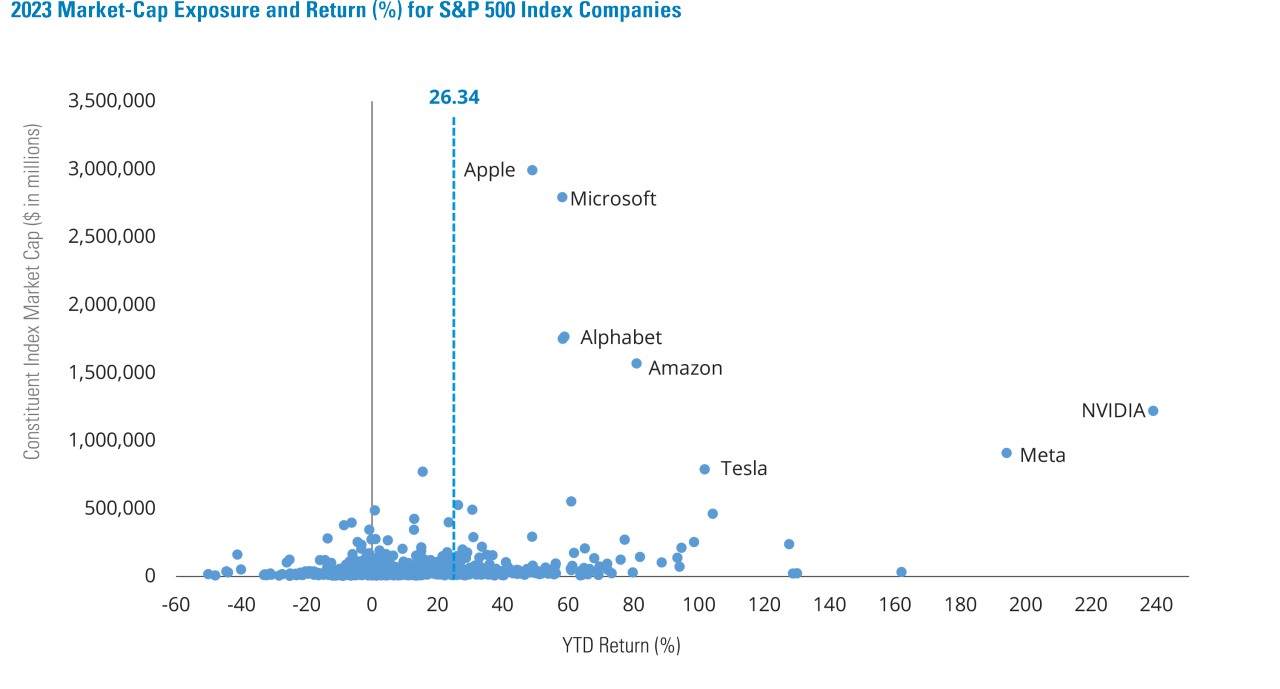
Past performance does not guarantee future results. As of 12/31/23. S&P 500 Index 7 Largest Companies as measured by free-float market capitalization. Data Source: FactSet and 9Hartford Funds, 1/24.
What Happens After A Stock Hits the Top 10?
Much of the US equity returns for last year were driven by the biggest names in the S&P 500 Index. But the performance that gets a company into the top 10 doesn’t tend to last.
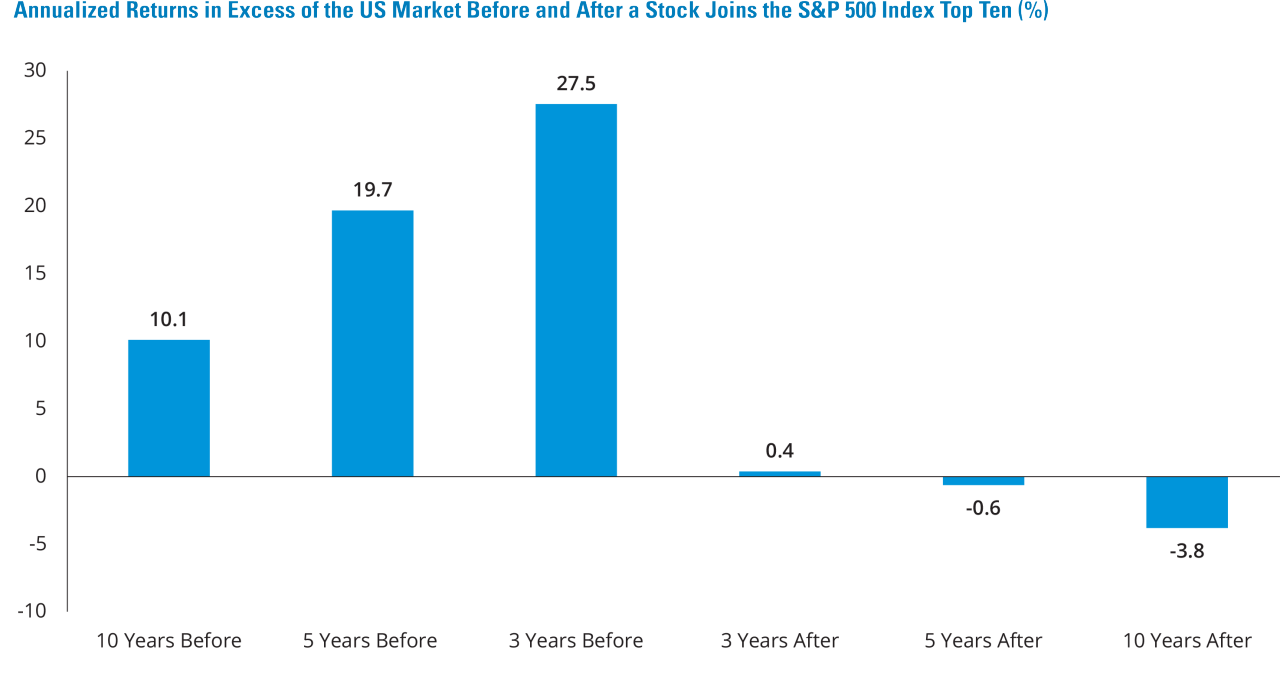
Past performance does not guarantee future results. As of 1/85-3/24. Companies are sorted every January by beginning-of-month market capitalization to identify first time entrants into the top 10. Data Source: FactSet, Morningstar and Hartford Funds, 4/24..
US and International Stocks Have Traded Periods of Outperformance
The current cycle of US outperformance has well exceeded the historical average.
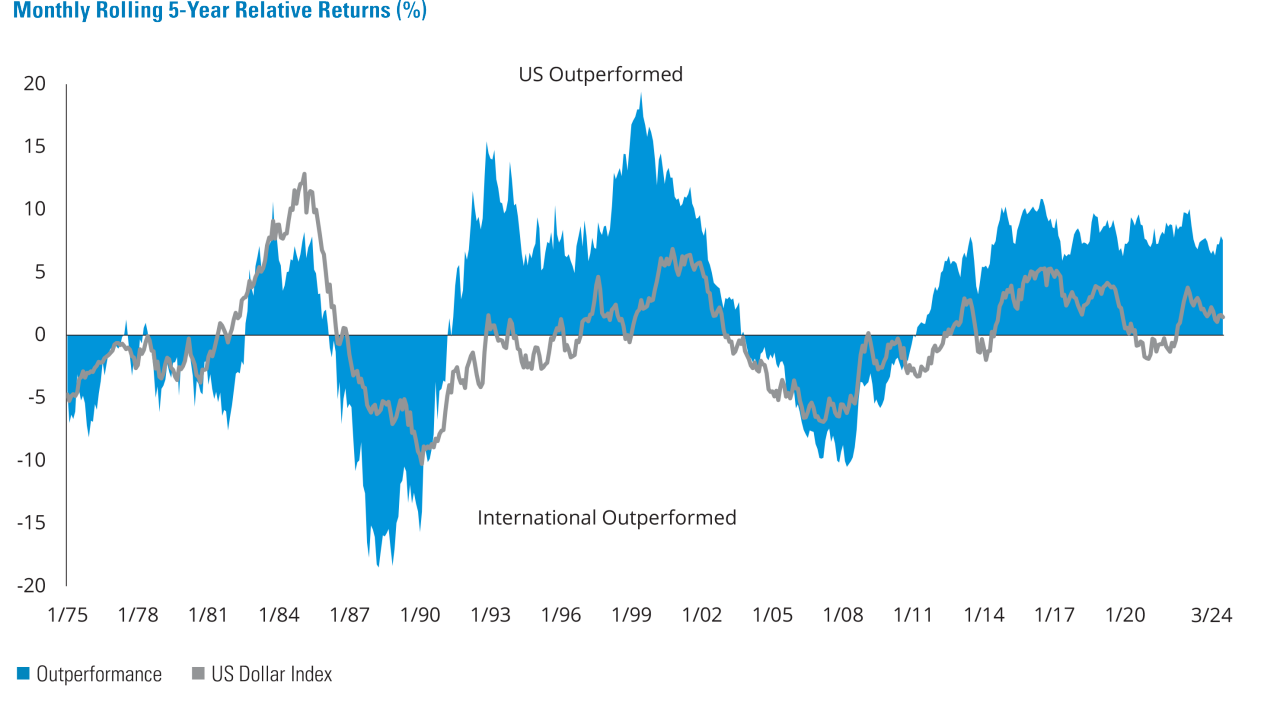
Past performance does not guarantee future results. As of 3/31/24. US equities are represented by the S&P 500 Index; International equites are represented by the MSCI World ex USAIndex. Data Source: Morningstar, Bloomberg, and Hartford Funds, 4/24.
Finding Sector Diversification Abroad
Investors could help reduce unintended sector biases by increasing their allocations to international investments.
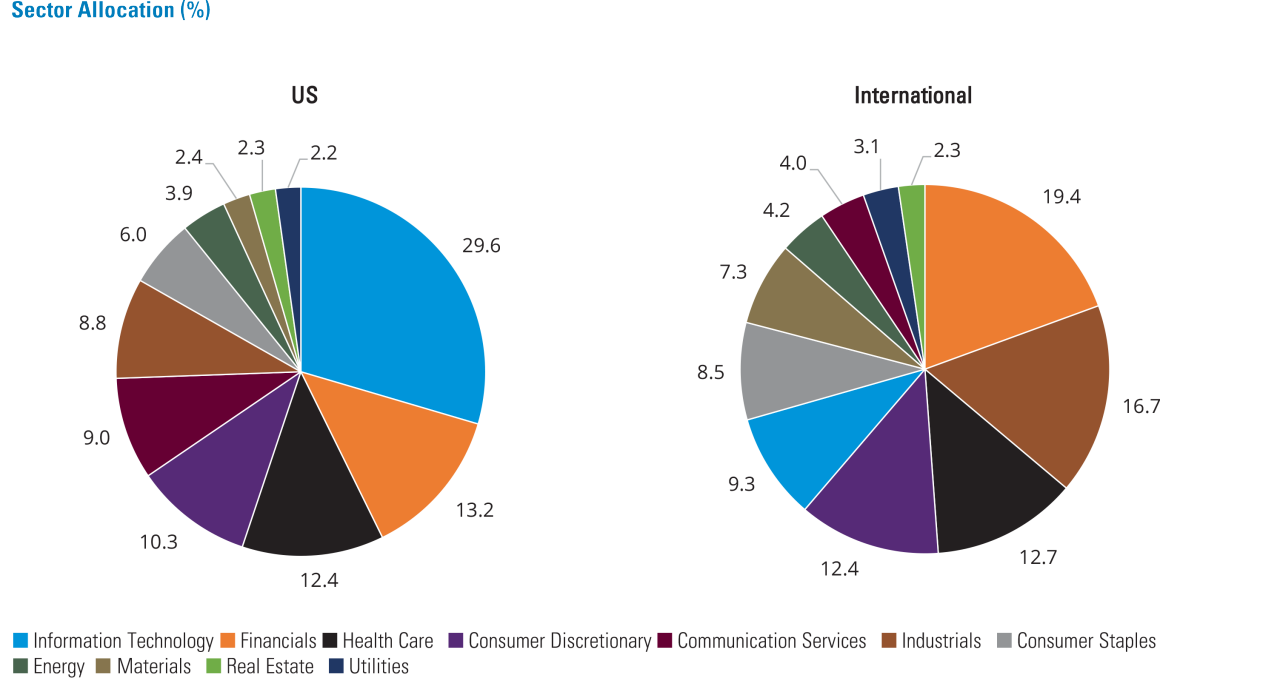
Past performance does not guarantee future results. of 3/31/24. Sector exposures for the US are represented by the S&P 500 Index and for International by the MSCI EAFE Index. DataSource: FactSet, 4/24.
International Value Has Outperformed Growth When Yields Are Elevated
International stocks have lagged US stocks for the last several years.But there may be an opportunity for investors that focus on value over growth internationally if Treasury rates remain high.
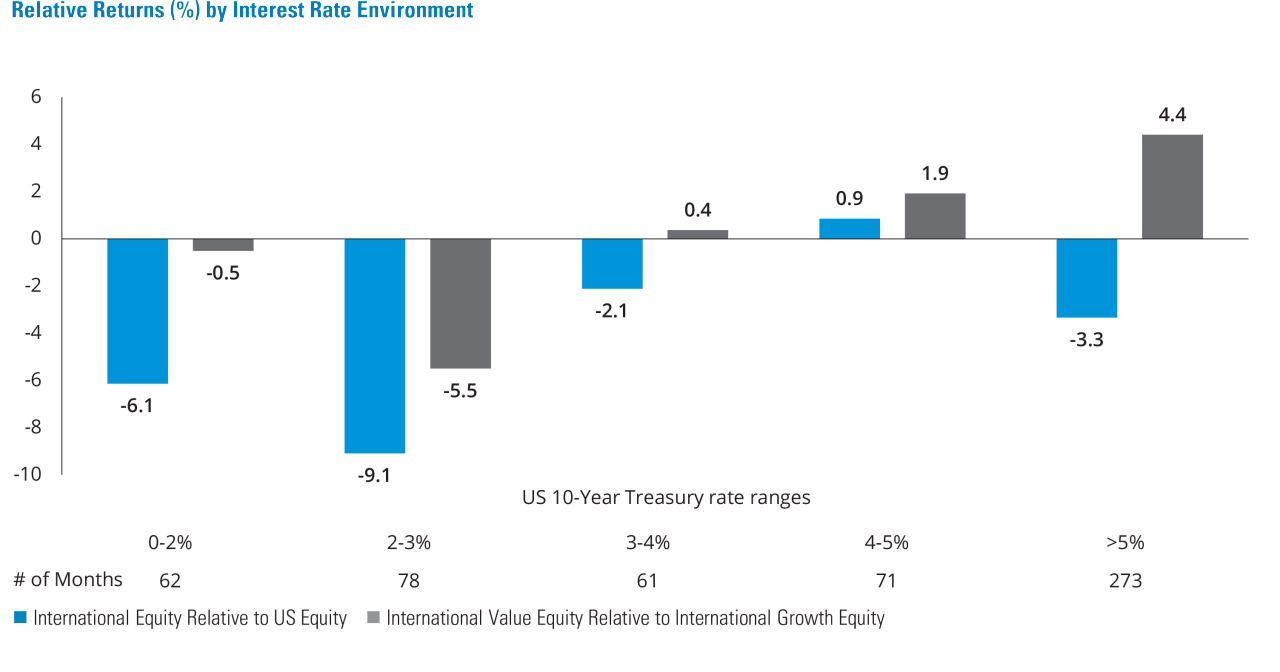
Past performance does not guarantee future results. As of 1/79-3/24. International Equity is represented by MSCI EAFE Index, US Equity is represented by S&P 500 Index, International Value Equity is represented by MSCI EAFE Value Index, International Growth Equity is represented by MSCI EAFE Growth Index. Data Source: Morningstar, Factset, and Hartford Funds, 4/24.
The Potential Benefit of Combining Domestic and International Equities
Domestic and international equities have historically experienced different risk-and-return characteristics. Combining them together over the long term might increase returns and/or lower portfolio volatility.
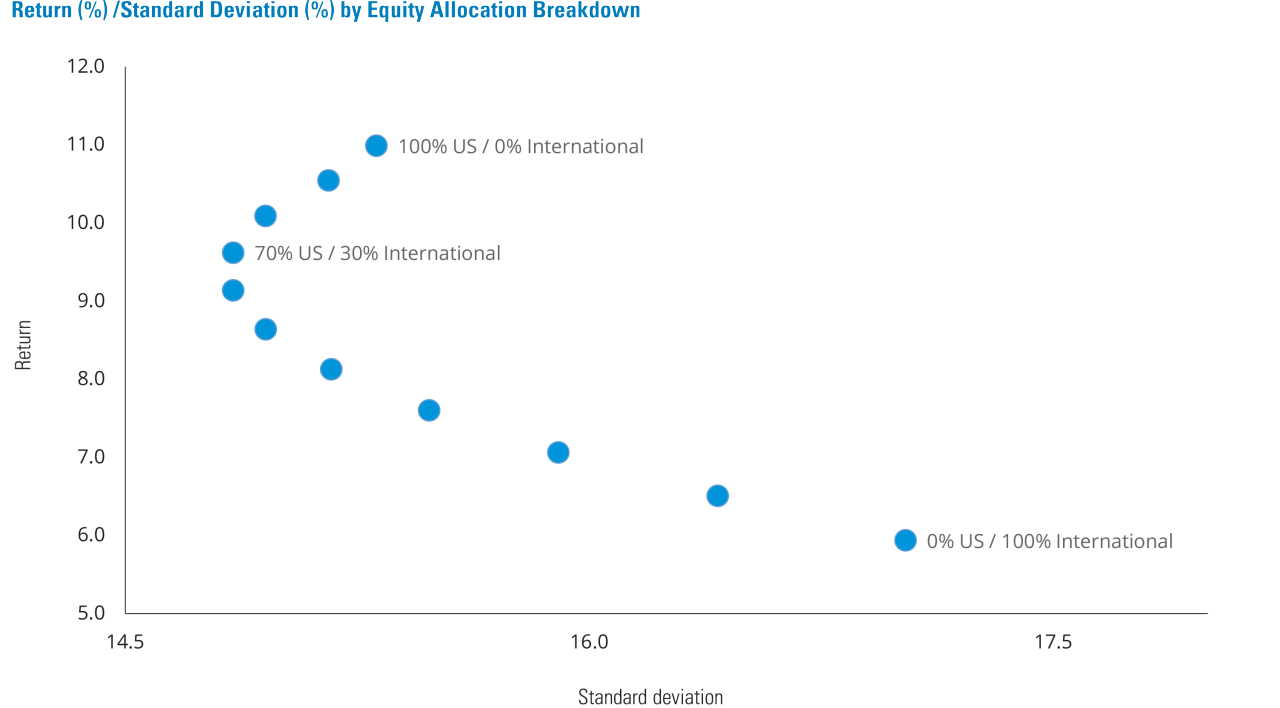
Past performance does not guarantee future results. As of 1/87-3/24. International Stocks are represented by MSCI EAFE Index; US Stocks are represented by the S&P 500 Index. DataSource: Morningstar, 4/24.
Growth and Value Stocks Have Traded Periods of Outperformance
While it's been a long time since value outperformed growth, value has experienced extended periods of outperformance relative to growth.
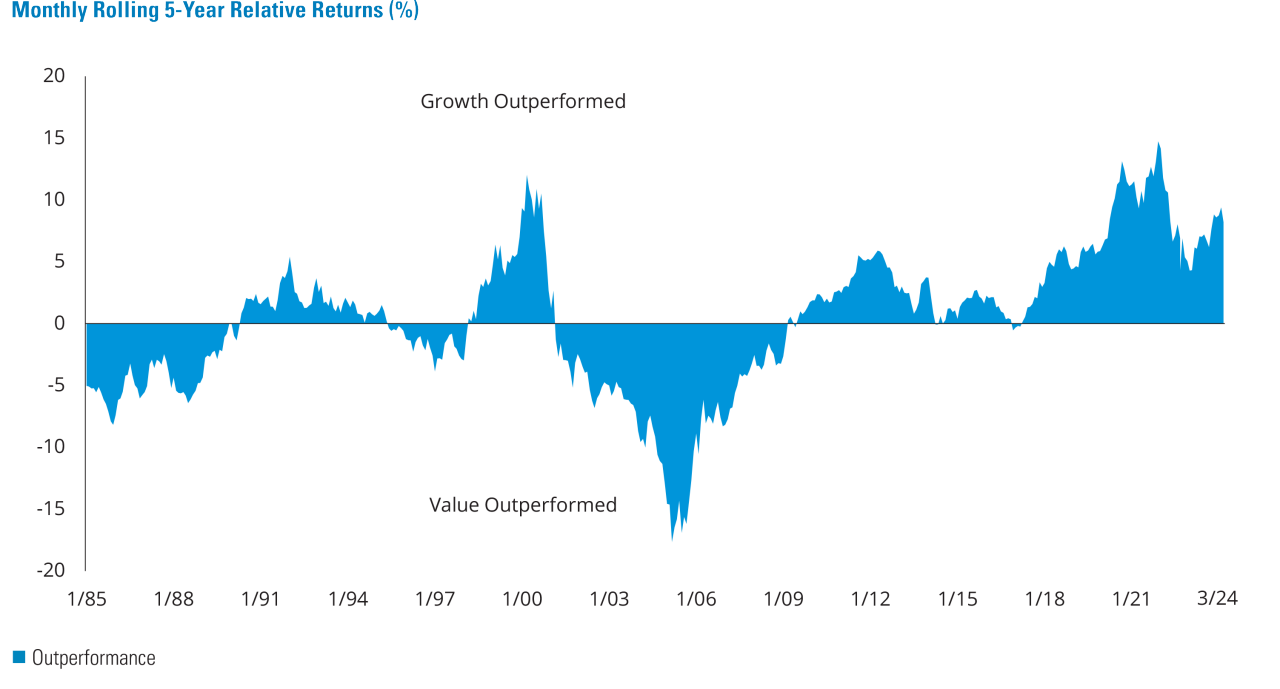
Past performance does not guarantee future results. As of 3/31/24. Growth is represented by the Russell 1000 Growth Index, Value is represented by the Russell 1000 Value Index. DataSource: Morningstar and Hartford Funds, 4/24.
Value Has Outperformed Growth When Yields Are High
Growth has been on a strong run relative to value in recent years.But this run correlates to low interest rates. Over the long term, Treasury yields have typically been higher, which helped value outperform.
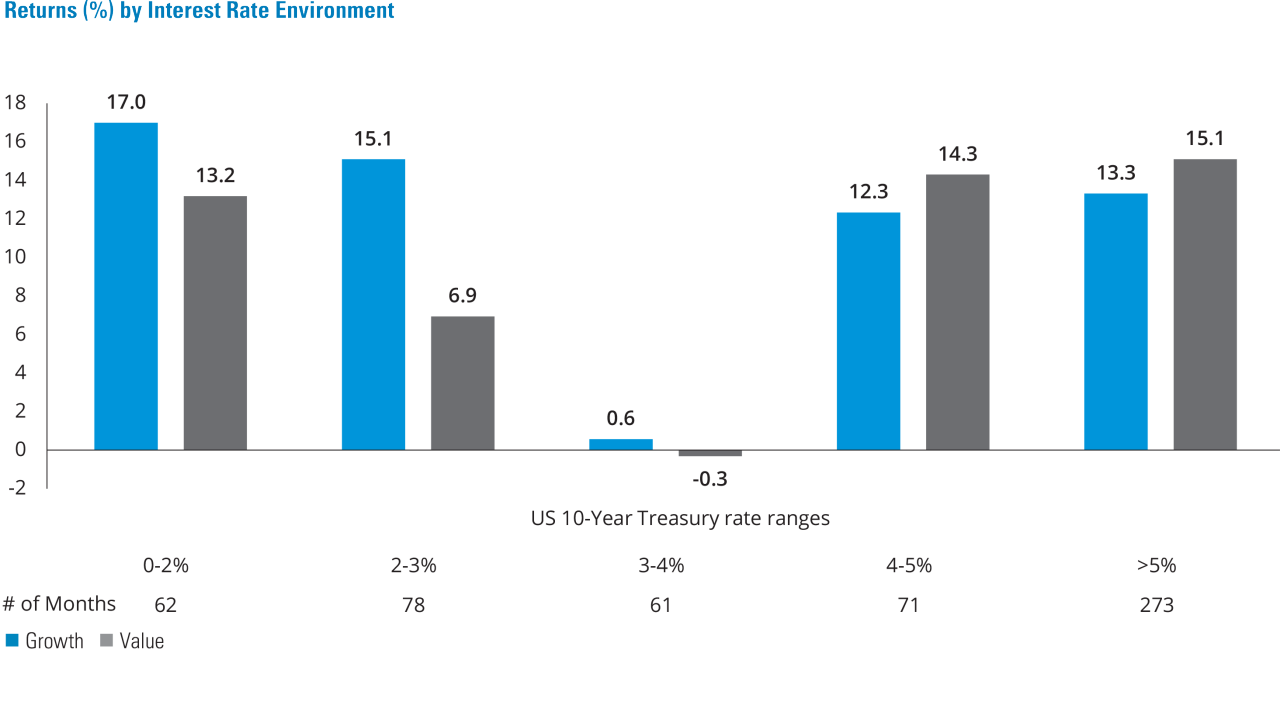
Past performance does not guarantee future results. As of 1/79-3/24. Growth is represented by Russell 1000 Growth Index, Value is represented by Russell 1000 Value Index. DataSource: Morningstar, Factset, and Hartford Funds, 4/24.
Equity Valuations Vary Widely
As the market continues to climb despite the Fed’s efforts to curb inflation, there are meaningful differences in equity valuations by size and style.
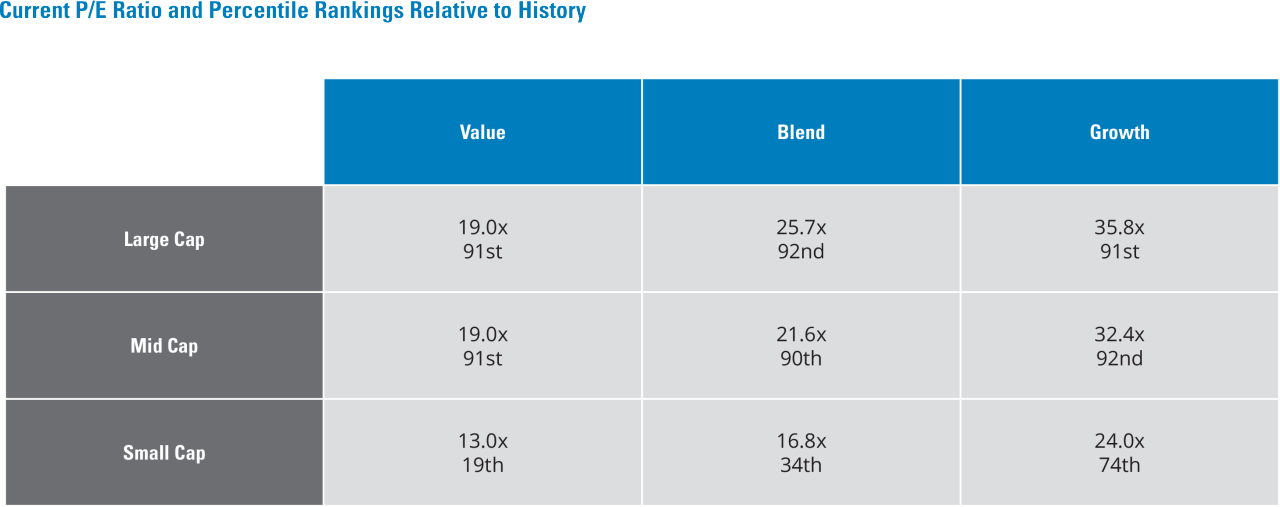
Past performance does not guarantee future results. As of 12/31/89-3/31/24. The price-to-earnings (P/E) ratio measures a company’s share price relative to its earnings-per-share and helps assess the relative value of a company’s stock. Based on the following indices: Large Cap Value (Russell 1000 Value Index), Large Cap Blend (Russell 1000 Index), Large Cap Growth (Russell1000 Growth Index), Mid Cap Value (Russell Mid Cap Value Index), Mid Cap Blend (Russell Mid Cap Index), Mid Cap Growth (Russell Mid Cap Growth Index), Small Cap Value (Russell 2000Value Index), Small Cap Blend (Russell 2000 Index), Small Cap Growth (Russell 2000 Growth Index). Data Source: Hartford Funds, 4/24.
A Balanced Portfolio Can Help Balance Out Volatility
After a year such as 2022 in which both stocks and bonds suffered significant declines, some investors considered abandoning balanced investing. But over the long term, combining equities and fixed income has been a winning formula.
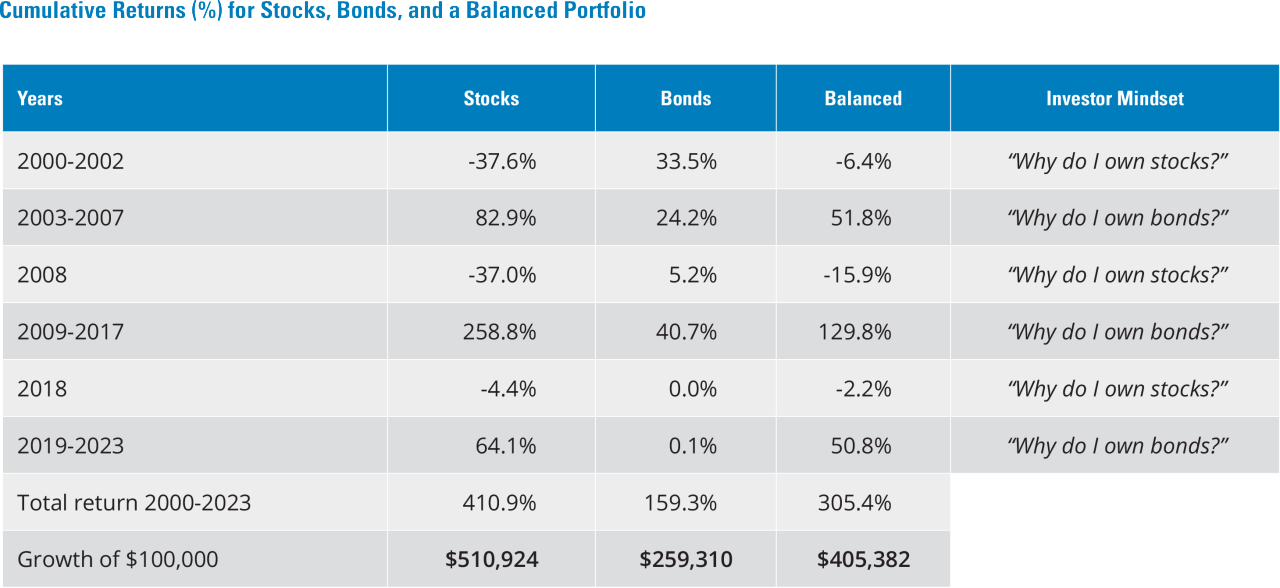
Past performance does not guarantee future results. As of 1/1/00-12/31/23. Stocks are represented by the S&P 500 Index. Bonds are represented by Bloomberg US Aggregate BondIndex. Balanced portfolio is represented by 50% S&P 500 Index and 50% Bloomberg US Aggregate Bond Index. Data Source: Morningstar and Hartford Funds, 1/24.