Pre-Sales Support
Mutual Funds and ETFs - 800-456-7526
Monday-Thursday: 8:00 a.m. – 6:00 p.m. ET
Friday: 8:00 a.m. – 5:00 p.m. ET
Post-Sales and Website Support
888-843-7824
Monday-Friday: 9:00 a.m. - 6:00 p.m. ET
 |
What’s a bull market? A bull market is a period of upward-trending prices. A new bull begins once prices rise at least 20% off the most recent market bottom. Generally speaking, optimism is high and investors and consumers feel confident, pushing company earnings and stock prices higher. |
 |
Apples and oranges — Though they often move similarly, the stock market and the economy aren’t the same. The stock market is a forward-looking indicator, so it reflects investor expectations for the next year or so rather than the current economic environment. This means stocks can rise even if the economy is sluggish.. |
 |
Bulls go bigger — Both bull and bear markets are normal and common. The S&P 500 Index has experienced 27 of each since 1928 (FIGURE 1), although bulls have tended to be stronger and longer. On average, bull markets have gained 115% over 2.7 years while bear markets have lost 35% and lasted less than a year. |
 |
Are we in a bull market? It could take weeks or months for the market to move 20% off a low. The tricky thing about bull markets is that we often don’t know we’re in one until after the fact because it’s possible for the market to retest previous lows after rallying by 20%. |
 |
Bulls are strongest out of the gates — Historically, the first half of a bull has outperformed the second half (in 20 out of 27 bulls since 1928, so about 74% of the time). |
 |
Snoozing may mean losing — Since a new bull is only identifiable once it’s under way, you could miss many of the market’s strongest days if you wait for the right time to invest. Historically, the first month of a new bull gained an average of 13.6%; in the first three months, new bulls have typically risen 25.3% on average. |
 |
All shapes and sizes — The longest bull on record ran for more than 12 years (1987-2000) and rose by a whopping 582%. Conversely, the shortest one lasted 25 days (June 1931) yet generated a return of 27%. |
 |
Stronger today than yesterday — Overall, the S&P 500 Index has tended to gain an average of 114% during bull markets. But they’ve been getting stronger since the 1970s: Of the 27 bulls since 1928, the 18 before 1970 gained about 78% on average. The nine bulls after 1970 gained 186% on average. |
 |
Don’t let it psych you out — Bull markets can set new records constantly, which may make you wonder when the other shoe is going to drop. But attempting to time the market and sell high could also mean missing out on significant further gains. |
|
How can I make the most of a bull? — If you’re well-diversified, your investing strategy may not need much tweaking to keep pace with the market. Working with a financial professional can help make sure your portfolio is prepared for all parts of the market cycle.
|
FIGURE 1
Bull Markets Tend to Outlast and Outweigh Bear Markets
S&P 500 Index Rolling Returns (1928-2023)
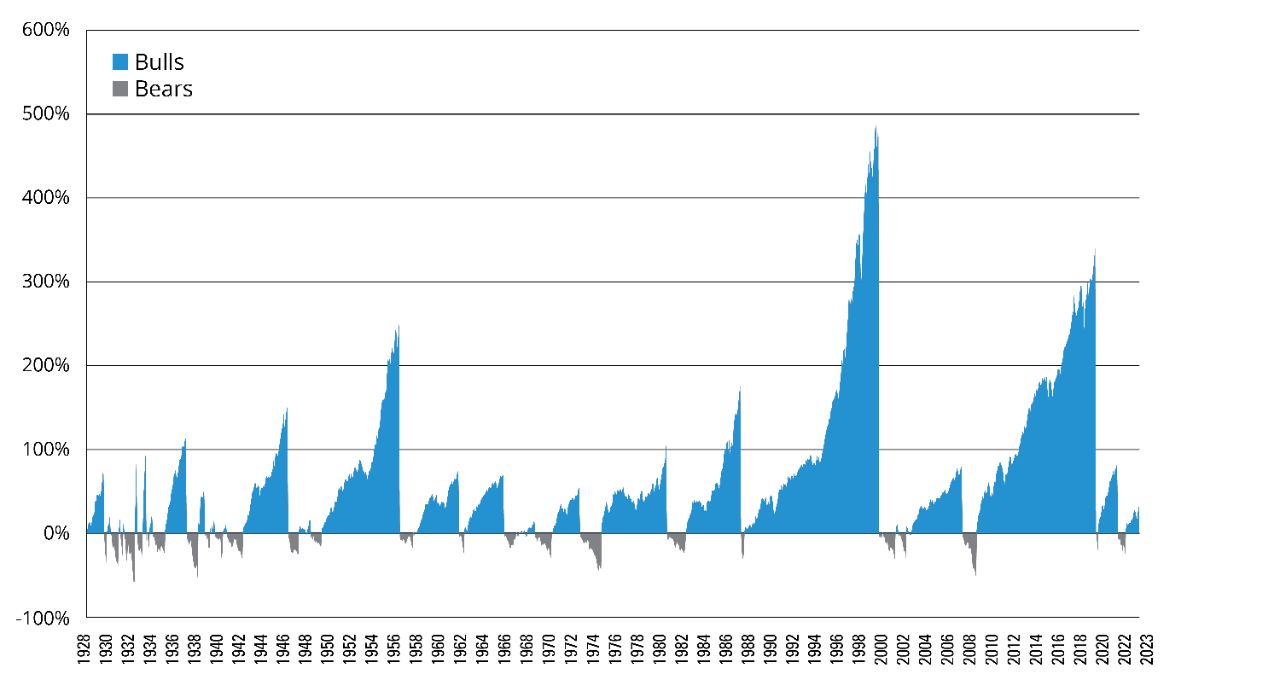
As of 12/31/23. Past performance does not guarantee future results. Indices are unmanaged and not available for direct investment. Source: Morningstar Direct, 1/24.
S&P 500 Index Bull Markets By the Numbers
As of 12/31/23. Past performance does not guarantee future results. Source: Ned Davis Research, 1/24.
A financial professional can help you build a diversified portfolio to help you feel confident in bull and bear markets alike.
Source: Ned Davis Research, 1/24
S&P 500 Index is a market capitalization-weighted price index composed of 500 widely held common stocks.
Important Risks: Investing involves risk, including the possible loss of principal. • Diversification does not ensure a profit or protect against a loss in declining market.
This material is provided for educational purposes only.