• Products
  • Insights
  • Practice Management
  • Resources
  • About Us

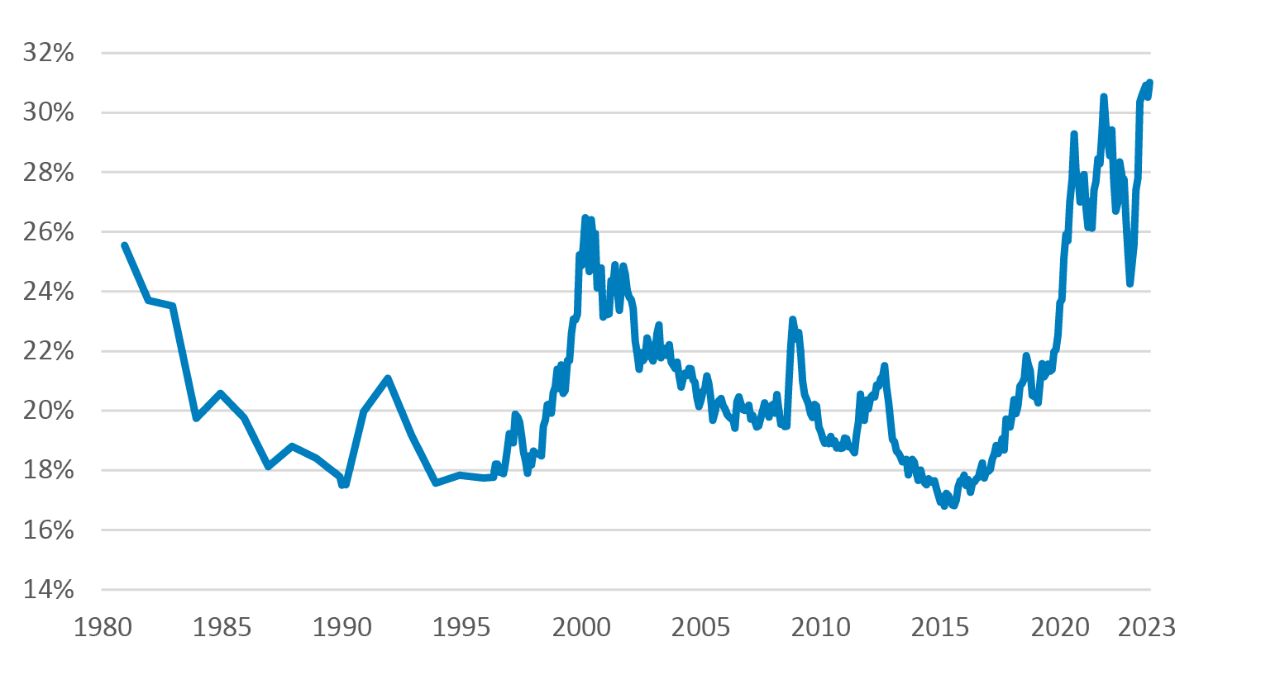
Global stock markets have become increasingly top-heavy. At the end of October, the 10 biggest stocks in the S&P 500 Index1 made up a record 31% of the market (FIGURE 1). For investors trying to build diversified portfolios, this presents an issue, as a significant proportion of their risk is being driven by a relatively small number of companies.

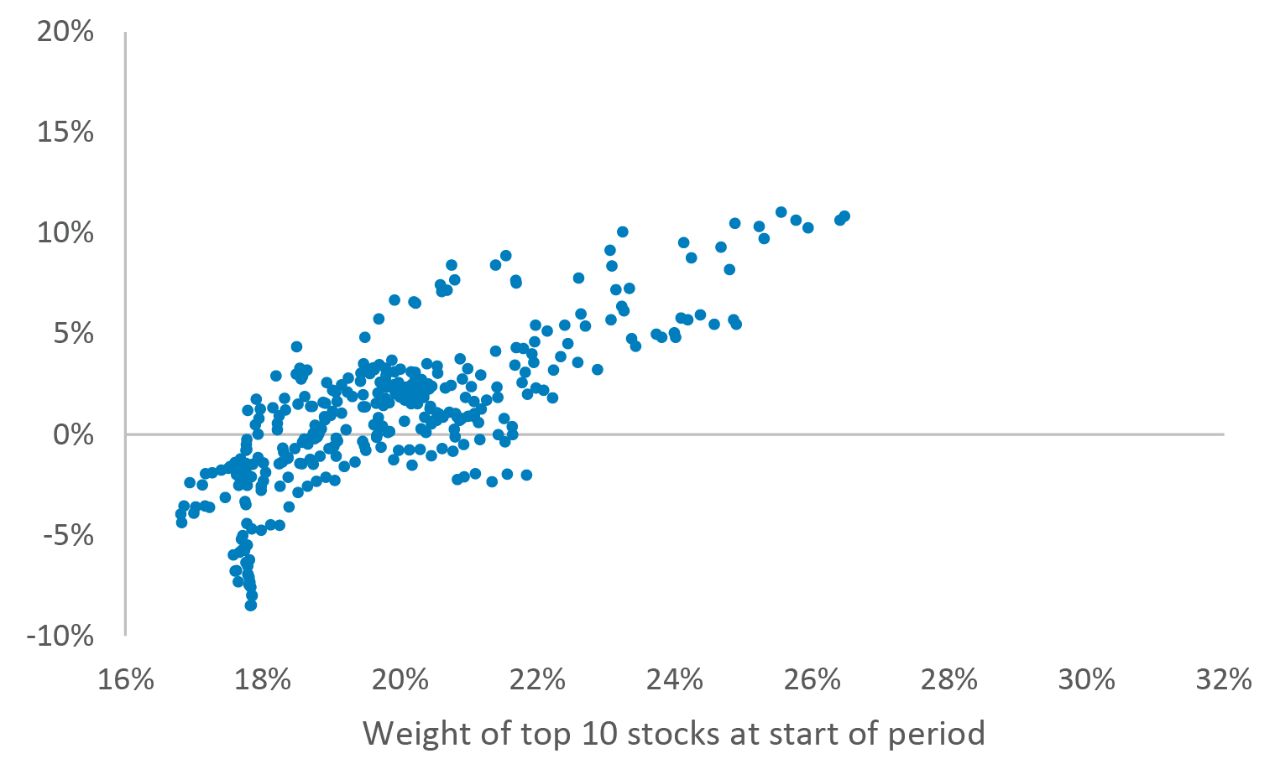
Our research shows that, historically, investors passively tracking the US stock market would have lost out on returns in the years following high levels of index concentration. At a time when investors are increasingly allocating to passively managed strategies at the expense of active, the tables could be set to turn.

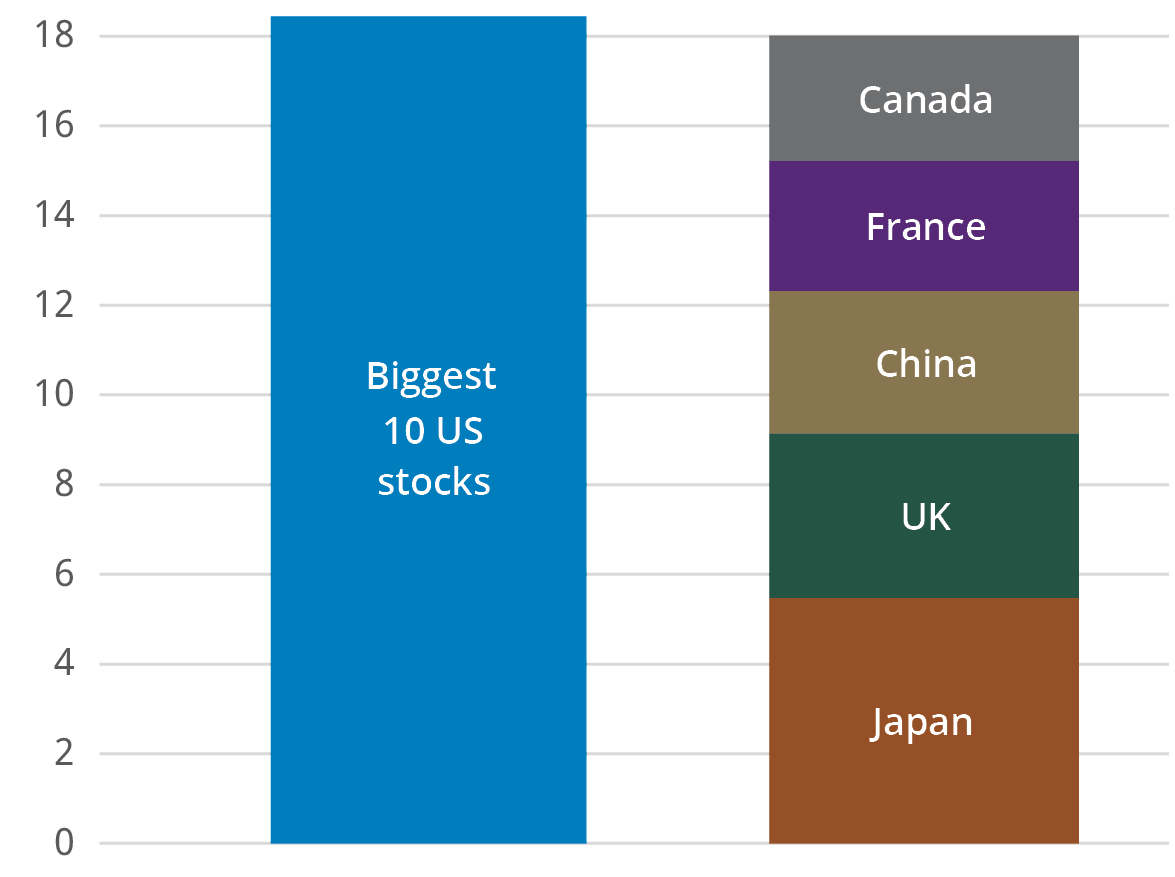
This isn’t just an issue for the US stock market: The US has grown to be 63% of the global market at the end of October (MSCI ACWI Index)2—so international investors have ended up with a lot of exposure to US stocks and, more so, a lot of exposure to just 10 stocks. Those 10 stocks make up nearly 18% of the global market—the same as Japan, the UK, China, France, and Canada combined (FIGURE 2).

FIGURE 1

Top-Heavy Markets
Weight of the 10 Largest Stocks in the S&P 500 Index Over Time

As of 12/31/81-10/31/23. Constituent weights are available monthly since May 1996 and annually before that. Data Sources: LSEG DataStream, S&P, and Schroders.

FIGURE 2

The 10 Biggest US Stocks Are Equal to Japan, UK, China, Canada, and France Combined
Weight in the MSCI ACWI Index (%)

As of 10/31/23. Data Sources: LSEG DataStream, S&P, and Schroders.


Should Investors Worry About Index Concentration When It Comes to Future Returns?

One way to assess this is to compare the performance of a standard market cap-weighted index and its equal-weighted cousin.

For those less familiar, the equal-weighted version of the S&P 500 Index is a more diversified version of the market. It has the same constituents, but they are each weighted at 0.2% (1/500); the 10 largest stocks account for 2% rather than 31%.

If the equal-weighted S&P 500 Index is outperforming the standard S&P 500 Index, this means that the bigger stocks are underperforming the smaller stocks within the Index—and vice-versa. It means investors would be better served by allocating money away from the biggest stocks to which most passive portfolios have the greatest exposure.


Deviating From the Market Has Been a Winning Strategy When Concentration Is High

Our new research finds that, in the past, there’s been a strong, statistically significant relationship between the degree of concentration in the S&P 500 Index and how the equal-weighted S&P 500 Index has performed relative to the S&P 500 Index.

The higher the concentration, the greater the outperformance of the equal-weighted S&P 500 Index over the next five years (FIGURE 3). Deviating from the market has been a winning strategy when concentration has been high. The relationship has been weaker, though still positive, when assessed over shorter investment horizons.


FIGURE 3

High Concentration Has Preceded Poor Performance from the Biggest Stocks
Subsequent Five-Year Outperformance of Equal-Weighted S&P 500 Index vs. Market-Cap Weighted S&P 500 Index

As of 12/31/89-10/31/23. Values above zero mean equal-weight is outperforming. Constituent weights are available monthly since May 1996 and annually previously. For those earlier periods, we’ve linearly interpolated between the annual figures to generate a monthly series. Redoing the analysis but only using annual figures for earlier periods doesn’t impact our conclusions. Return data is available for the S&P 500 Equal-Weighted Index since December 1989. Rolling 60-month returns have been analyzed. Statistical note: The rolling 60-month analysis includes overlapping periods, and serial correlation is present in the data. These bias the standard errors in regular statistical tests, which can result in a false positive result i.e., a conclusion of relationship when there is none. We have applied a Newey-West adjustment to the standard errors to correct for this. The conclusion of statistical significance is robust to this adjustment.


Based on today’s 31% weight for the 10 largest stocks, this relationship suggests that the equal-weighted S&P 500 Index could outperform by more than 15% per year over the next five years. We believe this is a strong argument that the passive, market-cap-weighted strategy favored by many could struggle compared to strategies that have more freedom to deviate from such concentrated exposure.

Now, of course, this time may be different. And we’re in uncharted territory to an extent. There are no data points to corroborate whether the gradient of the line will remain the same as we get further over to the far right-hand side of the chart.

However, even if the magnitude is up for debate, the broad conclusion appears more robust: When the market has become very concentrated in a few stocks, investors have historically done better by allocating away from those stocks. We think the tables could be set to turn in favor of more actively managed strategies at last.

Talk to your financial professional about concentration risks in your portfolio. 


1 S&P 500 Index is a market capitalization-weighted price index composed of 500 widely held common stocks.
2 MSCI ACWI Index is a free float-adjusted market capitalization index that measures equity market performance in the global developed and emerging markets, consisting of developed and emerging market country indices. MSCI index performance is shown net of dividend withholding tax.

Important Risks: Investing involves risk, including the possible loss of principal. • Different investment styles may go in and out of favor, which may cause underperformance to the broader stock market. • Diversification does not ensure a profit or protect against a loss in a declining market.

The views expressed herein are those of Schroders Investment Management (Schroders), are for informational purposes only, and are subject to change based on prevailing market, economic, and other conditions. The views expressed may not reflect the opinions of Hartford Funds or any other sub-adviser to our funds. The views and information discussed should not be construed as research, a recommendation, or investment advice, nor should they be considered an offer or solicitation to buy or sell any security. This information is current at the time of writing and may not be reproduced or distributed in whole or in part, for any purpose, without the express written consent of Schroders or Hartford Funds.

WP775 3289566

Insight from sub-adviser Schroders Investment Management
Author Headshot
Head of Strategic Research

The material on this site is for informational and educational purposes only. The material should not be considered tax or legal advice and is not to be relied on as a forecast. The material is also not a recommendation or advice regarding any particular security, strategy or product. Hartford Funds does not represent that any products or strategies discussed are appropriate for any particular investor so investors should seek their own professional advice before investing. Hartford Funds does not serve as a fiduciary. Content is current as of the publication date or date indicated, and may be superseded by subsequent market and economic conditions.

Investing involves risk, including the possible loss of principal. Investors should carefully consider a fund's investment objectives, risks, charges and expenses. This and other important information is contained in the mutual fund, or ETF summary prospectus and/or prospectus, which can be obtained from a financial professional and should be read carefully before investing.

Mutual funds are distributed by Hartford Funds Distributors, LLC (HFD), Member FINRA|SIPC. ETFs are distributed by ALPS Distributors, Inc. (ALPS). Advisory services may be provided by Hartford Funds Management Company, LLC (HFMC) or its wholly owned subsidiary, Lattice Strategies LLC (Lattice). Certain funds are sub-advised by Wellington Management Company LLP and/or Schroder Investment Management North America Inc (SIMNA). Schroder Investment Management North America Ltd. (SIMNA Ltd) serves as a secondary sub-adviser to certain funds. HFMC, Lattice, Wellington Management, SIMNA, and SIMNA Ltd. are all SEC registered investment advisers. Hartford Funds refers to HFD, Lattice, and HFMC, which are not affiliated with any sub-adviser or ALPS. The funds and other products referred to on this Site may be offered and sold only to persons in the United States and its territories.

© Copyright 2024 Hartford Funds Management Group, Inc. All Rights Reserved. Not FDIC Insured | No Bank Guarantee | May Lose Value