• Products
  • Insights
  • Practice Management
  • Resources
  • About Us

What's Driving Markets...
1. Market participants were kept guessing on the timing of the Federal Reserve's (the Fed's) first rate cut. The Federal Open Market Committee (FOMC) removed the tightening bias in its statement but added an additional line about needing more confidence in sustainably slower inflation before beginning to cut its policy rate. The Fed’s confidence in inflation moderating back toward target has grown (as indicated in both the statement and Chair Powell’s January 31 press conference), but because inflation data has surprised in both directions multiple times over the last three years, the Fed will await more evidence.

Powell gave explicit pushback on chances of a March rate cut during the press conference, saying he doubted the FOMC would have enough evidence by then. However, markets are still clinging to hope for a cut at the March FOMC meeting, which is, in part, a bet on moderating January inflation data (released at the end of February) as the deciding catalyst. Those hopes were partly dashed by the strong January payrolls report, which indicated both jobs and wage gains.


FIGURE 1

The Probability of a March Rate Cut Fades on Strong Data
Federal Funds Rate Futures (%) (June 2023-January 2024)

Optimism for a March rate cut is represented by large negative numbers, while pessimism is represented by smaller negative numbers. Sources: Bloomberg, Wellington Management, Hartford Funds.


2. The Treasury Quarterly Refunding Announcment (QRA),a normally staid event, has become market-moving news over the last several months. From our perspective, the market’s focus on the QRA is overblown relative to the information that’s shared by the Treasury Department. However, there are still key takeaways to note:

  1. Treasury is only marginally increasing issuance of longer-dated coupons.
  2. Treasury needs to borrow less than anticipated as tax receipts have been robust.
  3. The Department has not chosen an explicit course of issuance action in response to a possible ending of the Fed’s quantitative tightening.2

3. Economic data continues to support the soft-landing scenario. Buoyed by a resilient consumer, 4th-quarter GDP exceeded expectations, propelling 2023 growth to 2.5%—a far cry from the recession scenario forecasted by many pundits at the start of the year. The Fed’s preferred inflation gauge—core Personal Consumption Expenditures (PCE)3—appears to be decelerating ahead of the Fed’s projection, though the evolution of wage data will be an important indicator to monitor the future path of core inflation.


FIGURE 2

Cooling US Inflation and Low Unemployment: A Soft-Landing Recipe?
FOMC Projections for Moderating Core PCE Index and a Mild Jobless Rate (%)

Past data as of 12/23, projections through 12/24. Sources: Bloomberg, Wellington Management, Hartford Funds.


The evolution of wage data will be an important indicator to monitor the future path of core inflation.


4. Corporate issuance surged in January as companies rushed to market following the typical December slowdown and took advantage of the lower borrowing costs. The supply was met with very strong demand from investors in both the investment-grade and high-yield4 corporate markets, with most deals well-oversubscribed and offered with slim new-issue concessions—and pricing at spread5 levels much tighter than initial price talk.


FIGURE 3

The Corporate Bond Market Is Open for Business
Corporate Issuance Surged in January as Borrowing Costs Declined (US$, billions)

As of 1/24. Source: Barclays Research, Wellington Management, Hartford Funds.


We are starting to see an uptick in shipping costs that could crimp the deceleration in goods prices.


What's Keeping Us Up at Night

1. Three US soldiers were killed in Jordan in a drone attack. While, as of this writing, the Biden administration hasn't yet retaliated against Iran or Iranian-backed proxy groups, some form of retaliation is likely being planned. This, along with the airstrikes against the Houthis in Yemen, represents a widening of the conflict in the Middle East since the October 7 Hamas attack. In the near term, we're already starting to see shipping prices moving upward as cargo carriers and other ships have to start utilizing the much longer route around the Cape of Good Hope. We are starting to see an uptick in shipping costs that could crimp the deceleration in goods prices that Chair Powell mentioned in his press conference.


FIGURE 4

Geopolitical Instability Is Once Again Driving Up Shipping Rates
Price of Shipping a 40-Foot Box Overseas from the Port of Shanghai ($)

As of 1/25/24. Sources: Bloomberg, Wellington Management, Hartford Funds.


2. The US election cycle will start to heat up in the coming months. This generally will prove to be a challenging time for any legislative fixes to occur. Moreover, as polls move, there will likely be noise and impact on industries sensitive to government spending and policy (defense, healthcare, etc.). However, in a surprising move, on the last day of January, the House passed a bipartisan tax bill (H.R. 7024) that would increase the child tax credit, the depreciation allowance for R&D, the tax relief for losses due to natural disasters, and the low-income tax credit. We would consider this bill stimulative from a fiscal-policy perspective. We will see how the Senate digests it.

3. Concerns about the banking sector reemerged after a regional bank announced charge-offs on troubled commercial real-estate loans and increased future loan-loss provisions. The bank recently eclipsed the $100 billion in asset size that brings a higher level of scrutiny on credit risk, capital, liquidity, and regulatory/compliance costs. Global systemically important banks with over $700 billion in assets are subject to even more oversight and regulation and have demonstrated significant resiliency. While we don’t see systemic risk from the challenges facing this regional bank, we're monitoring for potential adverse impacts on growth if banks are forced to pull back on lending in response to higher-than-expected commercial real-estate loan losses.


Investment Implications for Consideration

  • Given how drawn out and uncertain the rate cycle has been year-to-date, we still favor higher-quality total-return strategies that are less constrained by benchmarks. These could include global sovereign and currency strategies that can potentially shine during these periods or “go-anywhere”6 strategies that may be able to navigate the late cycle.
  • We acknowledge the tumult of rate markets this year. But, given where spread levels are in many sectors, core-bond and core-bond-plus7 positions make sense as we (gradually) approach the end of the tightening cycle. The gradual cooling of inflation and slowing of the economy makes higher-quality fixed income potentially attractive from a recessionary perspective, as well as for positive convexity.8 
  • Securitized credit9 could be a potential hedge against rate volatility since it has generally offered attractive risk-adjusted spreads. Senior parts of the capital structure, in particular, seem attractive in case the cycle turns faster than expected. 
  • High yield, despite its excellent performance year-to-date, warrants a cautious approach given how late in the cycle we are and the normalizing of default rates relative to current spreads. However, we acknowledge there’s a substantial rate cushion that should provide some potential total-return risk mitigation in the event of a risk-off event. Given the robust carry,10 this may be a good equity substitute. For all higher-yielding credit, including high yield, bank loans, and convertible debt, we advocate an “up-in-quality” issuer bias in case the slowing economy undershoots a soft-landing scenario and default/downgrade rates accelerate.


FIGURE 5

Fixed-Income Sector Excess Returns

As of 1/31/24. Past performance does not guarantee future results. Excess returns are defined as investment returns from a security or portfolio that exceed a benchmark or index with a similar level of risk. Indices are unmanaged and not available for direct investment. See below for representative index definitions. Sources: Bloomberg, JP Morgan, and Wellington Management.

FIGURE 6

US Yields (%)

As of 1/31/24. Sources: Bloomberg, Wellington Management.

FIGURE 7

Fixed-Income Spreads (basis points)12

As of of 1/31/24. US IG Corp is represented by the Bloomberg US Corporate Bond Index; US HY Corp is represented by the Bloomberg US Corporate High Yield Bond Index; EMD is represented by the J.P. Morgan EMBI Global Diversified Index; MBS is represented by the Bloomberg US MBS Index; Bank Loans are represented by the Morningstar/LSTA US Leveraged Loan Index. See below for representative index definitions. Sources: Bloomberg, JP Morgan, Morningstar LSTA, Wellington Management.

To learn more about opportunities in fixed income, please talk to your financial representative. 


1 The US Treasury Department sells a lot of bonds to keep up with the federal government’s borrowing needs. To prepare investors, the Treasury has for decades published a “quarterly refunding” statement that spells out its near-term plans for note and bond sales. These reports have been attracting greater attention as the US debt has grown. In August 2023, for example, the Treasury said it would have to ramp up sales for the first time in 2 1/2 years and predicted further increases. But then a few months later it unexpectedly tempered the pace of its increases in sales of longer-term Treasuries, spurring a rally in those securities. Although the Treasury pushed through one more increase in February and suggested that no more boosts were likely in 2024, these quarterly announcements remain important to bond investors.

2 Quantitative tightening (QT) refers to monetary policies that contract, or reduce, the Federal Reserve System (Fed) balance sheet. This process is also known as balance-sheet normalization. The Fed, or any central bank, shrinks its monetary reserves by either selling government bonds or letting them mature and removing them from its cash balances. This removes liquidity, or money, from financial markets.

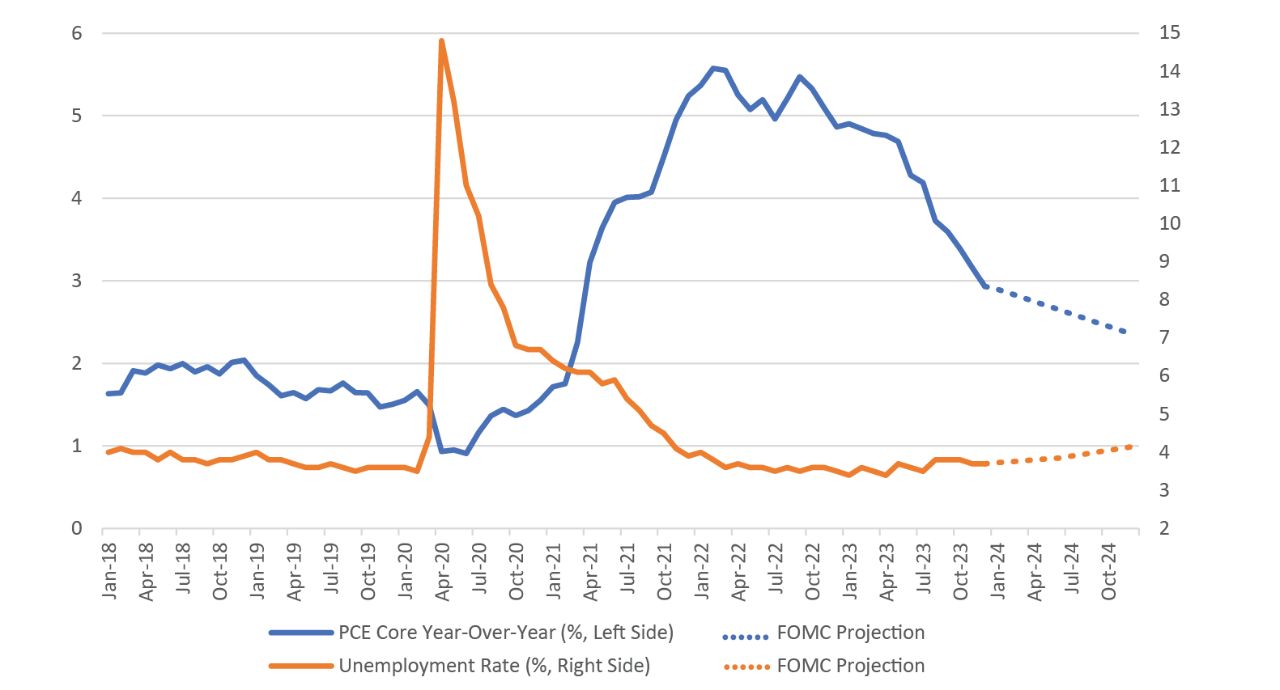
3 Personal consumption expenditures (PCE), also known as consumer spending, is a measure of the spending on goods and services by people in the US. The PCE accounts for about two-thirds of domestic spending and is a significant driver of gross domestic product.

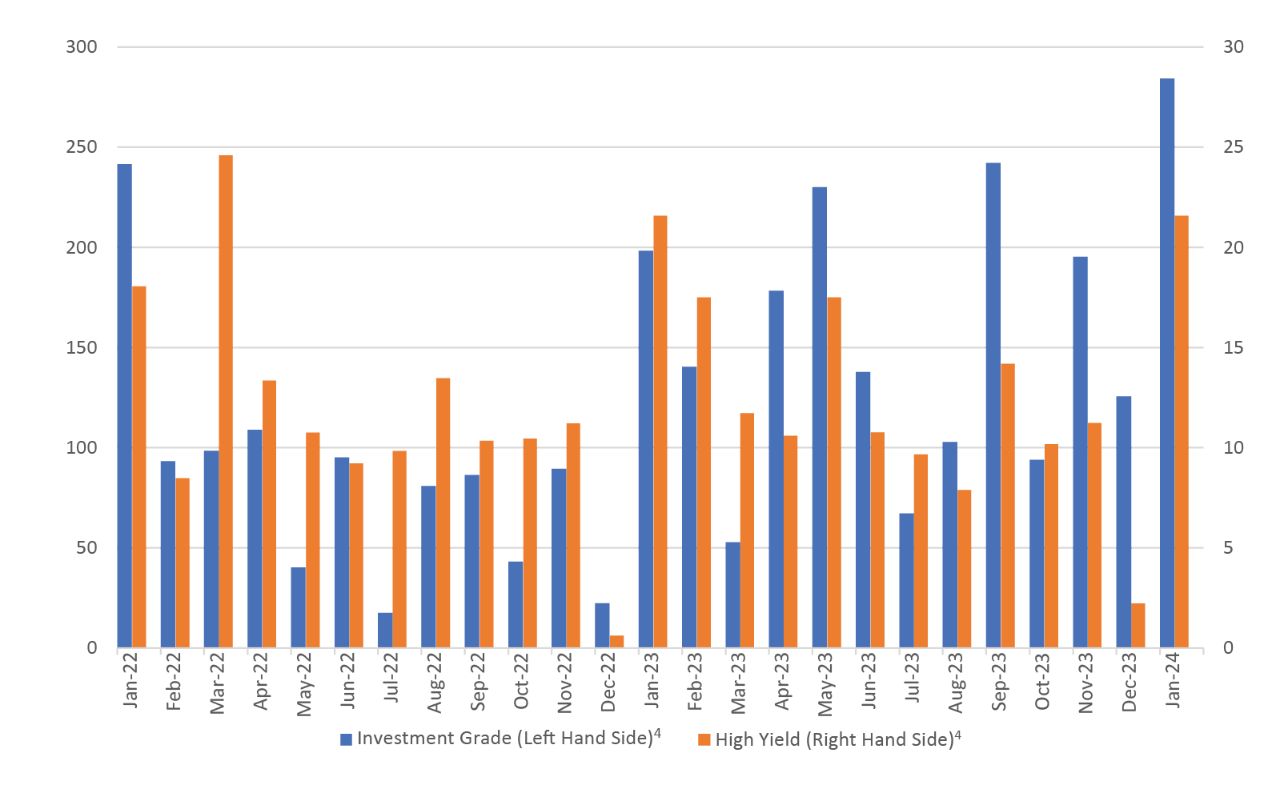
4 High-yield (HY) securities, or "junk bonds," are rated below-investment-grade because there is a greater possibility that the issuer may be unable to make interest and principal payments on those securities. Investment-grade (IG) securities are fixed-income securities that are rated at "BBB" or higher by Standard & Poor’s or Moody’s. 

5 Spreads are the difference in yields between two fixed-income securities with the the same maturity but originating from different investment sectors.

6 Go-anywhere strategies are typically benchmark-agnostic and not bound by limits on exposure by sector, quality, currency, or country. Whereas traditional core-bond-plus strategies generally have flexibility to invest across the fixed-income landscape, they generally have upper limits on the amount that can be invested in securities rated below-investment-grade, domiciled outside the US, non-US-dollar-denominated, or reside in a particular sector (e.g., emerging markets).

7 Core/core plus strategies typically invest in a baseline of investment-grade bonds such as government, corporate, and securitized debt. Core-plus funds can take that baseline and add additional sectors such as corporate high-yield, emerging-market debt, or non-US currency exposures to enhance returns.

8 Convexity is the relationship between bond prices and bond yields.

9 Securitized credit involves pooling a large number of loans into an investable asset. Examples include mortgage-backed or asset-backed securities.

10 Carry is the difference between the yield on a longer-maturity bond and the cost of borrowing.

11 Emerging-market bonds (EMD) are debt instruments issued by developing countries. These bonds tend to offer higher yields than Treasuries or corporate bonds in the US. Emerging-market issues tend to carry higher risks than domestic debt instruments.

12 A basis point is a unit that is equal to 1/100th of 1%, and is used to denote the change in a financial instrument. The basis point is commonly used for calculating changes in interest rates, equity indexes and the yield of a fixed-income security.


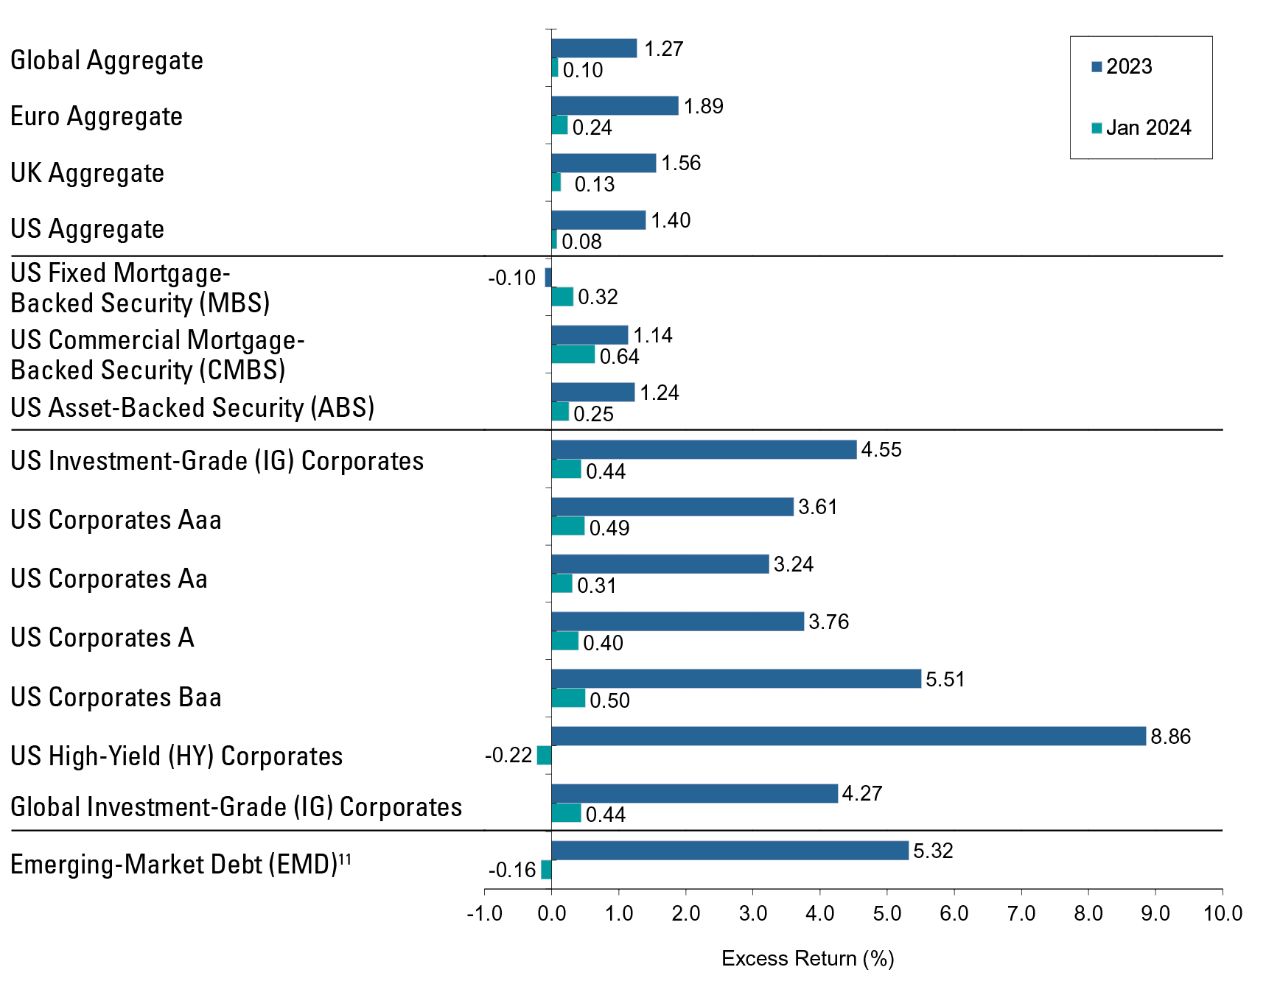
Representative Indices from Figure 5:

Global Aggregate: Bloomberg Global Aggregate Index; Euro Aggregate: Bloomberg Global Aggregate Index - European Euro; UK Aggregate: Bloomberg Global Aggregate Index - United Kingdom; US Aggregate: Bloomberg US Aggregate Bond Index; US Fixed MBS: Bloomberg US MBS Index; US CMBS: Bloomberg CMBS ERISA Eligible Index; US ABS: Bloomberg Asset-Backed Securities Index; US IG Corporates: Bloomberg US Corporate Bond Index; US Corporates Aaa: Bloomberg Aaa Corporate Index; US Corporates Aa: Bloomberg Aa Corporate Index; US Corporates A: Bloomberg A Corporate Index; US Corporates Baa: Bloomberg Baa Corporate Index; US High-Yield Corporates: Bloomberg US Corporate High Yield Bond Index; Global IG Corporates: Bloomberg Global Credit - Corporate Index; Emerging-Markets Debt: Bloomberg Emerging Markets Hard Currency Index.


Index Definitions:

Bloomberg Global Aggregate Index is a broad-based measure of the global investment-grade fixed-rate debt markets. Bloomberg Global Aggregate Index - European Euro includes fixed-rate, investment-grade Euro denominated bonds. Bloomberg Global Aggregate Index - United Kingdom includes fixed-rate, investment-grade sterling-denominated bonds. Bloomberg US Aggregate Bond Index is composed of securities from the Bloomberg Government/Credit Bond Index, Mortgage-Backed Securities Index, Asset-Backed Securities Index, and Commercial Mortgage-Backed Securities Index. Bloomberg US MBS Index tracks fixed-rate agency mortgage backed passthrough securities guaranteed by Ginnie Mae (GNMA), Fannie Mae (FNMA), and Freddie Mac (FHLMC). Bloomberg CMBS ERISA Eligible Index measures the performance of investment-grade commercial mortgage-backed securities, which are classes of securities that represent interests in pools of commercial mortgages. The index includes only CMBS that are Employee Retirement Income Security Act of 1974. Bloomberg Asset-Backed Securities Index, the ABS component of the Bloomberg US Aggregate Index, has three subsectors: credit and charge cards, autos, and utility. Bloomberg US Corporate Bond Index covers all publicly issued, fixed rate, nonconvertible, investment-grade debt. Bloomberg Aaa Corporate Index is designed to measure the performance of investment-grade corporate bonds that have a credit rating of Aaa. Bloomberg Aa Corporate Index is designed to measure the performance of investment-grade corporate bonds that have a credit rating of Aa. Bloomberg A Corporate Index is designed to measure the performance of investment-grade corporate bonds that have a credit rating of A. Bloomberg Baa Corporate Index is designed to measure the performance of investment-grade corporate bonds that have a credit rating of Baa. Bloomberg US Corporate High Yield Bond Index is an unmanaged broad-based market-value-weighted index that tracks the total return performance of non-investment grade, fixed-rate, publicly placed, dollar denominated and nonconvertible debt registered with the Securities and Exchange Commission. Bloomberg Global Credit - Corporate Index is an unmanaged index considered representative of fixed rate, non-investment grade debt of companies in the US, developed markets, and emerging markets. Bloomberg Emerging Markets Hard Currency Index includes USD-denominated debt from sovereign, quasi-sovereign, and corporate EM issuers. Morningstar/LSTA Leveraged Loan Index is a market-value-weighted index that is designed to measure the performance of the US leveraged loan market based upon market weightings, spreads, and interest payments. J.P. Morgan EMBI Global Diversified Index is a broad-based, unmanaged index which tracks liquid, US Dollar emerging-market fixed- and floating-rate debt instruments issued by sovereign and quasi-sovereign entities. 

Important Risks: Investing involves risk, including the possible loss of principal. • Fixed income security risks include credit, liquidity, call, duration, and interest-rate risk. As interest rates rise, bond prices generally fall. • Investments in high-yield (“junk”) bonds involve greater risk of price volatility, illiquidity, and default than higher-rated debt securities. • Mortgage-related and asset-backed securities’ risks include credit, interest-rate, prepayment, and extension risk. The value of the underlying real estate of real estate related securities may go down due to various factors, including but not limited to strength of the economy, amount of new construction, laws and regulations, costs of real estate, availability of mortgages, and changes in interest rates. • Loans can be difficult to value and less liquid than other types of debt instruments; they are also subject to nonpayment, collateral, bankruptcy, default, extension, prepayment and insolvency risks. • Foreign investments may be more volatile and less liquid than US investments and are subject to the risk of currency fluctuations and adverse political, economic and regulatory developments. These risks may be greater, and include additional risks, for investments in emerging markets. 

The views expressed herein are those of Wellington Management, are for informational purposes only, and are subject to change based on prevailing market, economic, and other conditions. The views expressed may not reflect the opinions of Hartford Funds or any other sub-adviser to our funds. They should not be construed as research or investment advice nor should they be considered an offer or solicitation to buy or sell any security. This information is current at the time of writing and may not be reproduced or distributed in whole or in part, for any purpose, without the express written consent of Wellington Management or Hartford Funds.

FIOWP017 3409454

Insight from sub-adviser Wellington Management
Author Headshot
Managing Director at Wellington Management LLP and Fixed-Income Strategist for Hartford Funds


The material on this site is for informational and educational purposes only. The material should not be considered tax or legal advice and is not to be relied on as a forecast. The material is also not a recommendation or advice regarding any particular security, strategy or product. Hartford Funds does not represent that any products or strategies discussed are appropriate for any particular investor so investors should seek their own professional advice before investing. Hartford Funds does not serve as a fiduciary. Content is current as of the publication date or date indicated, and may be superseded by subsequent market and economic conditions.

Investing involves risk, including the possible loss of principal. Investors should carefully consider a fund's investment objectives, risks, charges and expenses. This and other important information is contained in the mutual fund, or ETF summary prospectus and/or prospectus, which can be obtained from a financial professional and should be read carefully before investing.

Mutual funds are distributed by Hartford Funds Distributors, LLC (HFD), Member FINRA|SIPC. ETFs are distributed by ALPS Distributors, Inc. (ALPS). Advisory services may be provided by Hartford Funds Management Company, LLC (HFMC) or its wholly owned subsidiary, Lattice Strategies LLC (Lattice). Certain funds are sub-advised by Wellington Management Company LLP and/or Schroder Investment Management North America Inc (SIMNA). Schroder Investment Management North America Ltd. (SIMNA Ltd) serves as a secondary sub-adviser to certain funds. HFMC, Lattice, Wellington Management, SIMNA, and SIMNA Ltd. are all SEC registered investment advisers. Hartford Funds refers to HFD, Lattice, and HFMC, which are not affiliated with any sub-adviser or ALPS. The funds and other products referred to on this Site may be offered and sold only to persons in the United States and its territories.

© Copyright 2024 Hartford Funds Management Group, Inc. All Rights Reserved. Not FDIC Insured | No Bank Guarantee | May Lose Value