Pre-Sales Support
Mutual Funds and ETFs - 800-456-7526
Monday-Thursday: 8:00 a.m. – 6:00 p.m. ET
Friday: 8:00 a.m. – 5:00 p.m. ET
Post-Sales and Website Support
888-843-7824
Monday-Friday: 9:00 a.m. - 6:00 p.m. ET

Asset Class and Index Definitions
Bloomberg Emerging Markets Aggregate Bond Index is a hard-currency emerging-markets debt benchmark that includes USD-denominated debt from sovereign, quasi-sovereign, and corporate EM issuers.
Bloomberg Global Aggregate Bond Index is a multi-currency benchmark that includes Treasury, government-related, corporate and securitized fixed-rate bonds from both developed and emerging-markets issuers.
Bloomberg Global High Yield Index is a multi-currency measure of the global high-yield debt market.
Bloomberg Municipal Bond Index is an unmanaged index that is considered representative of the broad market for investment-grade, tax-exempt bonds with a maturity of at least one year.
Bloomberg US Treasury 10+ Year Index measures the performance of public obligations of the US Treasury with maturities of 10 years and greater, including securities roll up to the US Aggregate, US Universal, and Global Aggregate Indices.
Bloomberg US Treasury 1-3 Year Index measures the performance of US dollar-denominated, fixed-rate, nominal debt issued by the US Treasury. It is the subset of the US Treasury Index includes bonds with maturities of 1 to 3 years.
Bloomberg US Treasury 5-7 Year Index measures the performance of US dollar-denominated, fixed-rate, nominal debt issued by the US Treasury. It is the subset of the US Treasury Index includes bonds with maturities of 5 to 7 years.
Bloomberg US 7-10 Year Treasury Bond Index measures the performance of the US Government bond market and includes public obligations of the US Treasury with a maturity of between seven and up to (but not including) 10 years.
Bloomberg US Aggregate ABS Index is a component of the Bloomberg US Aggregate Index and has three subsectors: credit and charge cards, autos, and utilities.
Bloomberg US Aggregate Bond Index is composed of securities that covers the US investment grade fixed rate bond market, with index components for government and corporate securities, mortgage pass-through securities, and asset-backed securities.
Bloomberg US Corporate Index measures the investment-grade, fixed-rate, taxable corporate-bond market.
Bloomberg US MBS Index tracks fixed-rate agency mortgage-backed passthrough securities guaranteed by Ginnie Mae (GNMA), Fannie Mae (FNMA), and Freddie Mac (FHLMC).
Bloomberg US Treasury Bill 1-3 Month Index is designed to measure the performance of public obligations of the US Treasury that have a remaining maturity of greater than or equal to 1 month and less than 3 months.
IA SBBI US 30-Day T-Bill Index measures the performance of a single issue of outstanding Treasury Bill which matures closest to, but not beyond, one month from the rebalancing date.
IA SBBI US Intermediate-Term Government Bond Index measures the performance of five-year maturity US Treasury Bonds.
Morningstar LSTA Leveraged Loan Index is a market-value-weighted index that is designed to measure the performance of the US leveraged-loan market based upon market weightings, spreads, and interest payments.
MSCI ACWI Index is a free float-adjusted market-capitalization index that measures equity market performance in the global developed and emerging markets, consisting of developed and emerging-market country indices..
MSCI World ex USA Index is a free float-adjusted market capitalization index that captures large- and mid-cap representation across developed markets countries—excluding the US.
Russell 1000 Growth Index measures the performance of the large-cap growth segment of the US equity universe.
Russell 1000 Value Index measures the performance of those Russell 1000 Index companies with lower price-to-book ratios and lower forecasted growth values.
S&P 500 Index is a market capitalization-weighted price index composed of 500 widely held common stocks.
S&P 500 Price Index is a market capitalization-weighted price index composed of 500 widely held common stocks, and does not include the reinvestment of dividend payments.
Important Risks: Investing involves risk, including the possible loss of principal. • Foreign investments may be more volatile and less liquid than US investments and are subject to the risk of currency fluctuations and adverse political, economic, and regulatory developments. These risks may be greater, and include additional risks, for investments in emerging markets or if a fund focuses in a particular geographic region or country. • Fixed-income security risks include credit, liquidity, call, duration, event and interest-rate risk. As interest rates rise, bond prices generally fall. • Investments in high-yield (“junk”) bonds involve greater risk of price volatility, illiquidity, and default than higher-rated debt securities. • Municipal securities may be adversely impacted by state/local, political, economic, or market conditions. Investors may be subject to the federal Alternative Minimum Tax as well as state and local income taxes. Capital gains, if any, are taxable. • Bank loans can be difficult to value and less liquid than other types of debt instruments; they are also subject to nonpayment, collateral, bankruptcy, default, extension, prepayment, and insolvency risks. • US Treasury securities are backed by the full faith and credit of the US government as to the timely payment of principal and interest.
Key lessons from successful investors throughout history:
Your behavior matters more than the market’s behavior
Patience is an undervalued investment virtue
Historical perspective can help you stay calm when others are panicking
Discussing your ideas and concerns with a financial professional can help sharpen your thinking and potentially help you avoid costly mistakes
Outlook
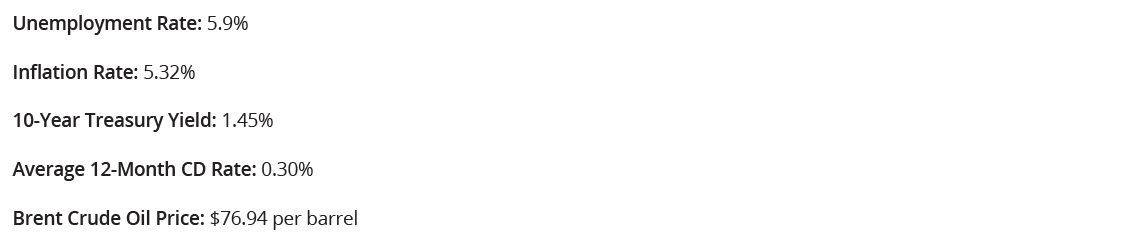
Economic Snapshot
Unemployment Rate: 3.8%
Inflation Rate: 3.5%
10-Year Treasury Yield: 4.2%
12-Month CD Rate: 5.08%
Brent Crude Oil Price: $86.17 per barrel
As of 3/31/24. Data Sources: FactSet; Inflation–US Department of Labor via FactSet; CD rate is proxied by the highest 12-month CD rates available on Bankrate, 4/24.
Outlook
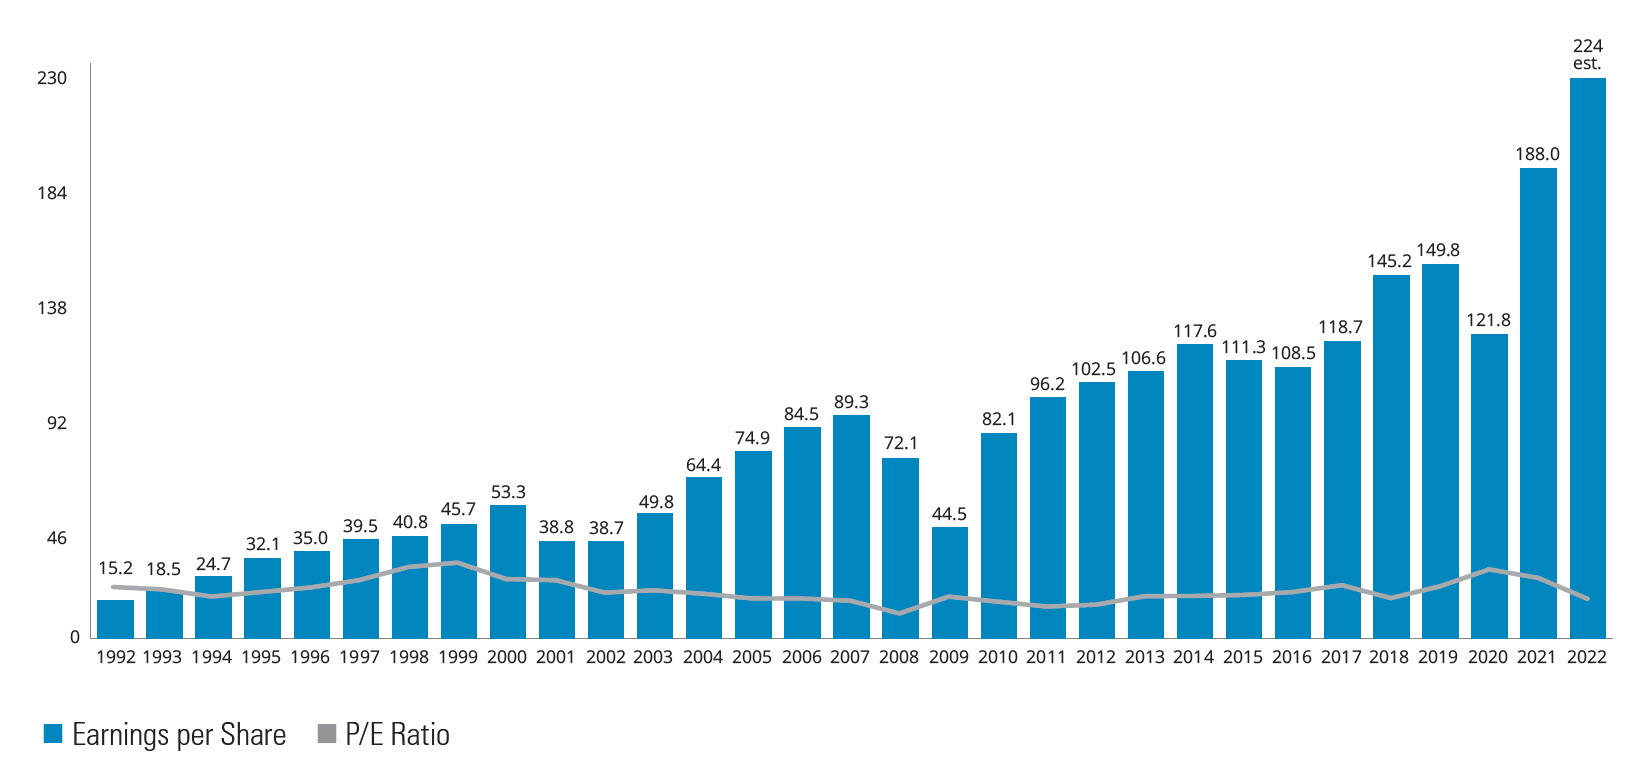
S&P 500 Index Earnings Are Near Record Highs
S&P 500 Index Earnings ($) and Price-to-Earnings (P/E) Ratio
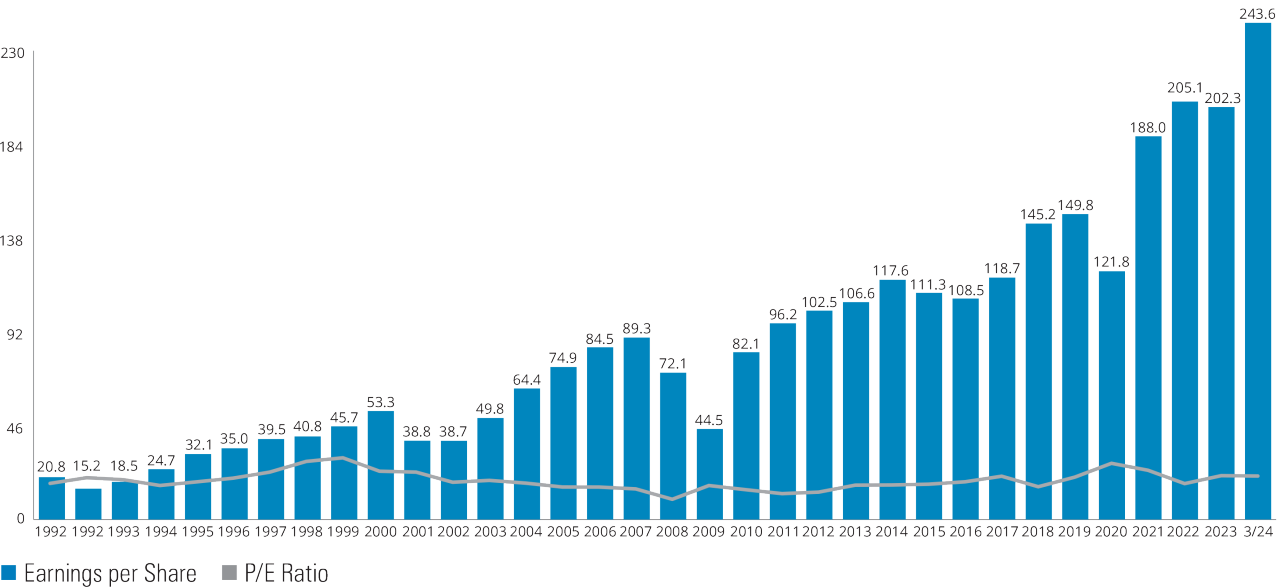
As of 3/31/24. Past performance does not guarantee future results. Indices are unmanaged and not available for direct investment. Earnings per share is calculated as a company’s profit divided by the outstanding shares of its common stock. The resulting number serves as an indicator of a company’s profitability. P/E ratio is the ratio of the S&P 500 Index’s price divided by earnings per share. Please see representative index definitions below. Data Source: FactSet, 4/24.
Outlook
What’s Happened After a Good Year in the Market?
S&P 500 Index Calendar Year Returns (%)
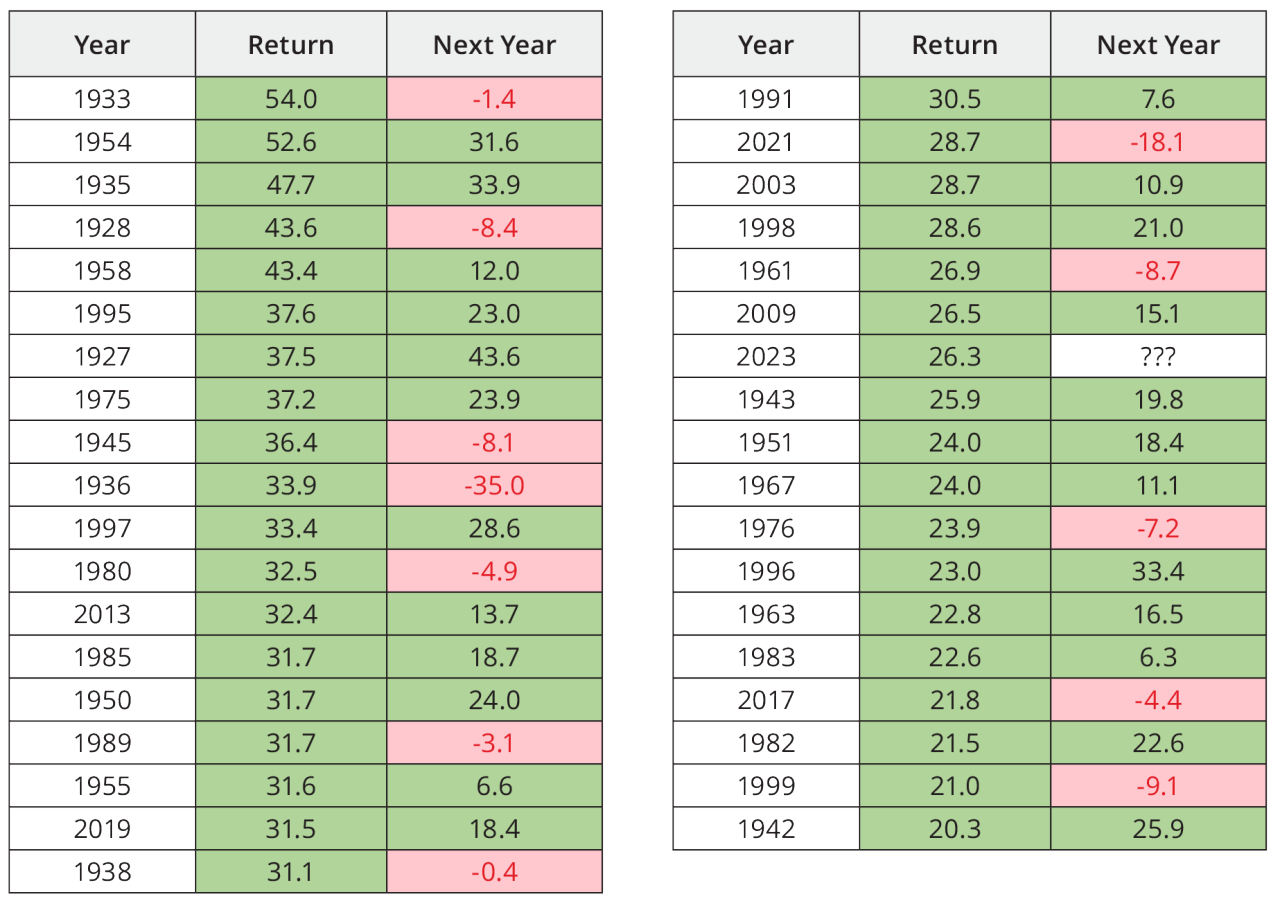
Past performance does not guarantee future results. As of 12/31/23. Data Sources: Morningstar and Hartford Funds, 1/24.
Outlook
Strong Fixed-Income Returns After Negative Years
Calendar Year Performance (%)
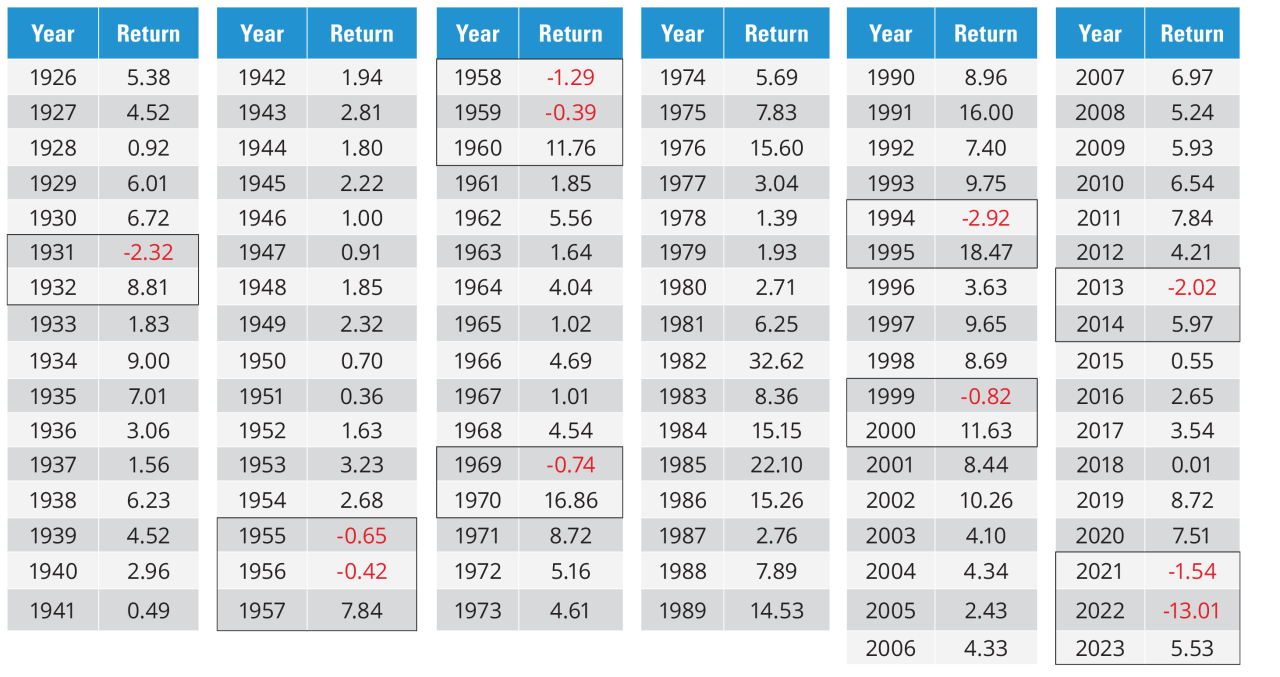
Past performance does not guarantee future results. Returns are for IA SBBI US Intermediate-Term Government Bond Index from 1926-1975 and the Bloomberg US Aggregate Bond Index from 1976-2023. Please see representative index definitions below. Data Source: Morningstar, 1/24.
Historical Perspective
Investors Need to Carefully Balance Income Potential With Risk and Diversification
Fixed Income vs. Equity Correlation Chart (2008–2023)
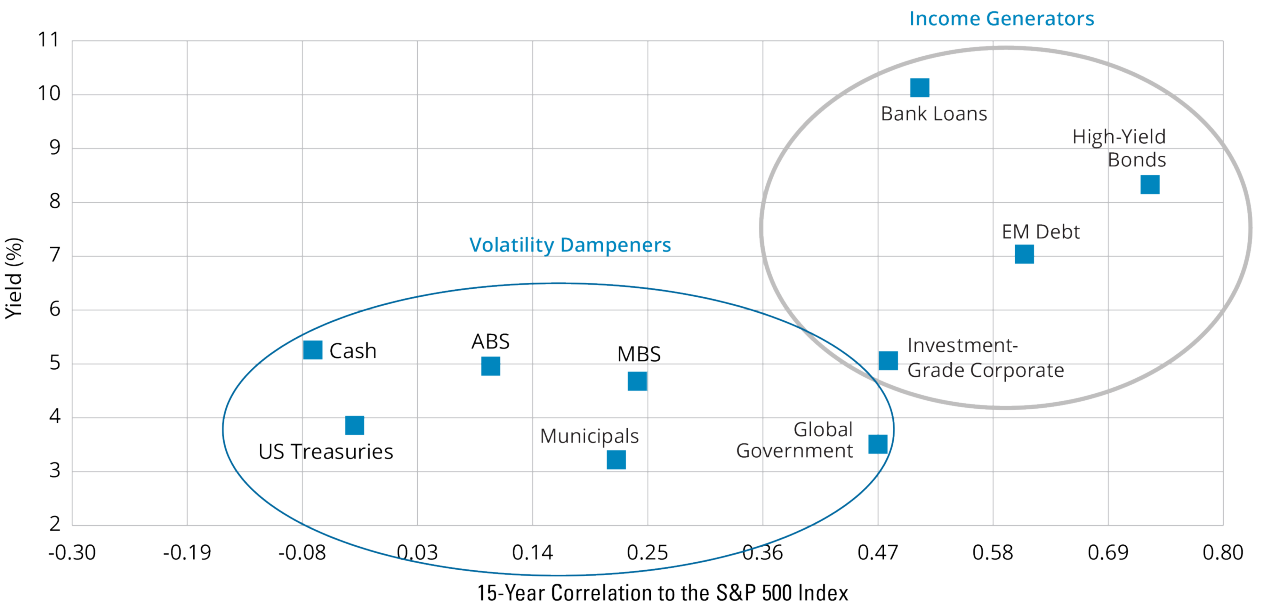
As of 12/31/23. Past performance does not guarantee future results. Asset classes are represented by: Cash: Bloomberg US Treasury Bill 1-3 Month Index; US Treasuries: Bloomberg US 7-10 Year Treasury Bond Index; MBS: Bloomberg US MBS Index; ABS: Bloomberg US Aggregate ABS Index; Global Government: Bloomberg Global Aggregate Bond Index; Municipals: Bloomberg Municipal Bond Index; Investment-Grade Corporate: Bloomberg US Corporate Bond Index; EM Debt: Bloomberg Emerging Markets Aggregate Bond Index; Bank Loans: Morningstar LSTA Leveraged Loan Index; High Yield Bond: Bloomberg Global High Yield Index. Yield is yield to maturity (i.e., the expected total return if a bond is held until maturity) for all indices except Municipals, which is Yield to Worst (i.e., the lowest possible yield on a bond without it defaulting). For illustrative purposes only. Please see representative index definitions below. Diversification does not ensure a profit or protect against a loss in a declining market. Data Sources: Bloomberg, S&P Dow Jones, and Morningstar, 1/24.
Historical Perspective
The US Isn’t Always Best
Percentage of World’s Top-50 Stocks That Are Non-US
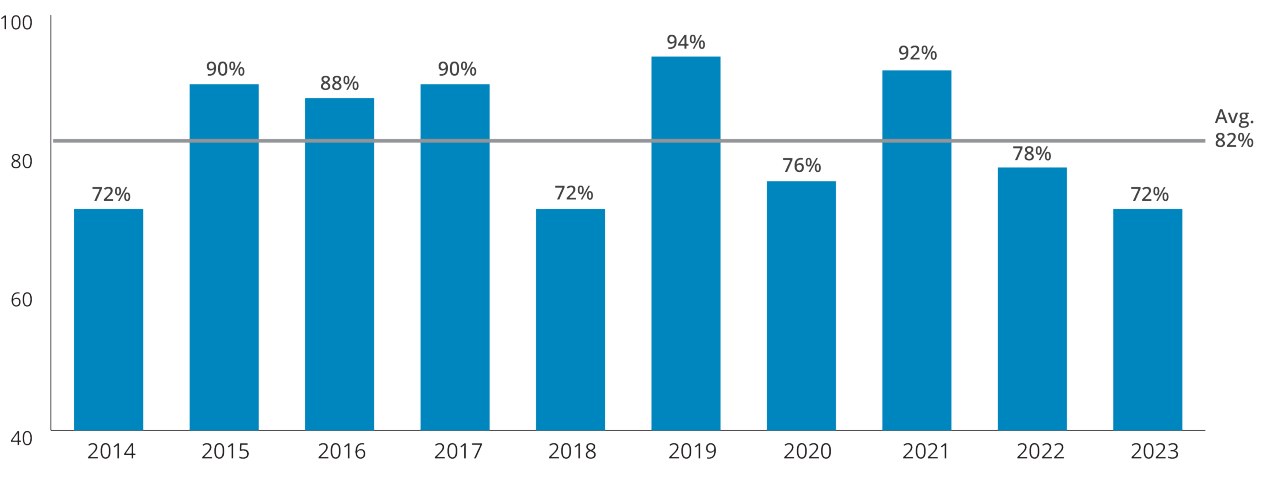
As of 12/31/23. Past performance does not guarantee future results. Based on the annual calendar-year returns of 50 highest-performing stocks of the MSCI ACWI Index. Please see representative index definitions below. For illustrative purposes only. Data Source: FactSet, 1/24.
Historical Perspective
Intra-Year Dips in US Stocks Happen Frequently
S&P 500 Index Returns (%) and Maximum Drawdowns (%)
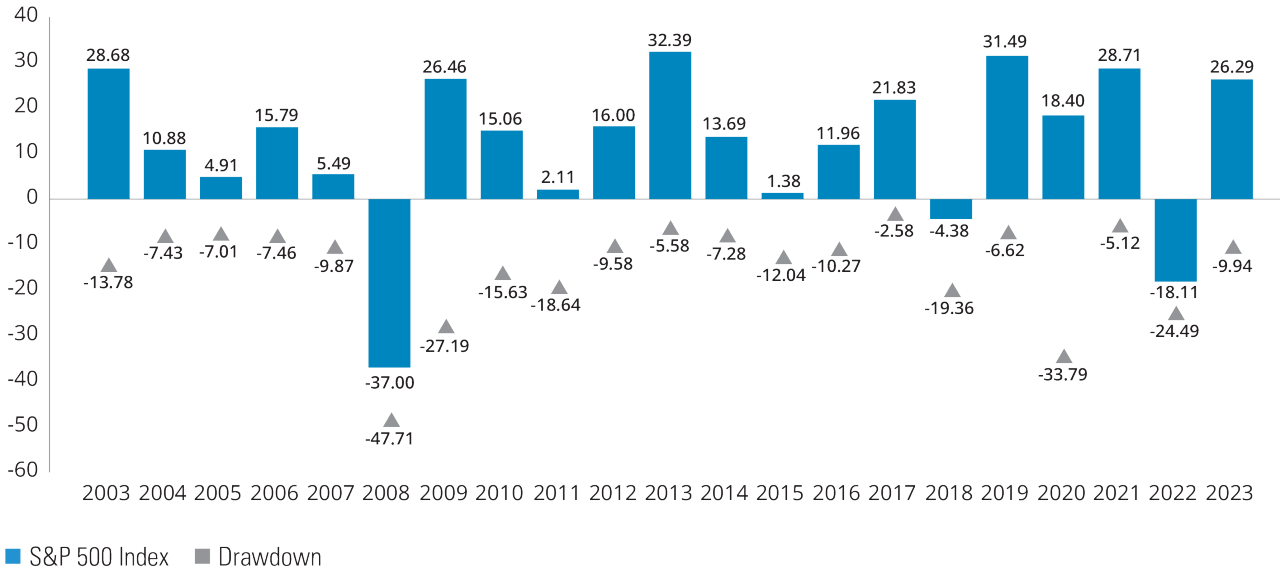
As of 12/31/23. Past performance does not guarantee future results. Assumes reinvestment of capital gains and dividends and no taxes. Drawdown refers to the largest market drop from peak to trough during the calendar year. Data Sources: Morningstar and Hartford Funds, 1/24.
Historical Perspective
US and International Stocks Have Traded Periods of Outperformance
US Equity vs. International Equity 5-Year Monthly Rolling Returns (%)
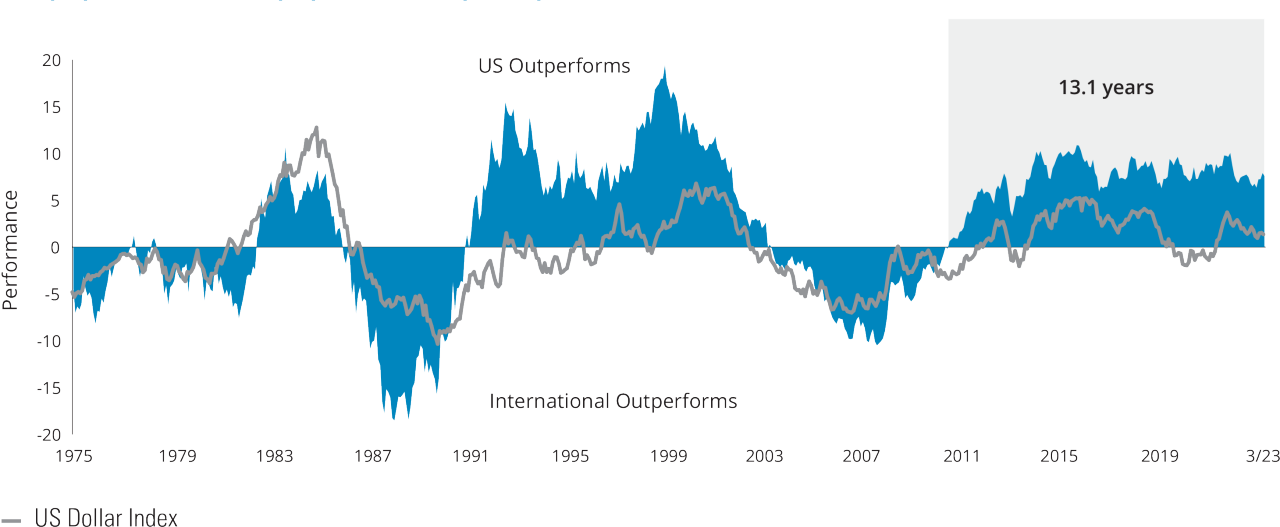
As of 3/31/24. Past performance does not guarantee future results. The chart shows the S&P 500 Index’s returns minus the MSCI World ex USA Index’s returns. When the line is above 0, domestic stocks outperformed international stocks. When the line is below 0, international stocks outperformed domestic stocks. The performance shown above is index performance and is not representative of any Hartford Fund’s performance. US equity is represented by the S&P 500 Index. International equity is represented by the MSCI World ex USA Index. For illustrative purposes only. Please see representative index definitions below. Data Sources: Morningstar, Bloomberg, and Hartford Funds, 4/24.
Historical Perspective
Growth and Value Stocks Have Traded Periods of Outperformance
Russell 1000 Growth Index vs. Russell 1000 Value Index 5-Year Monthly Rolling Returns (%)
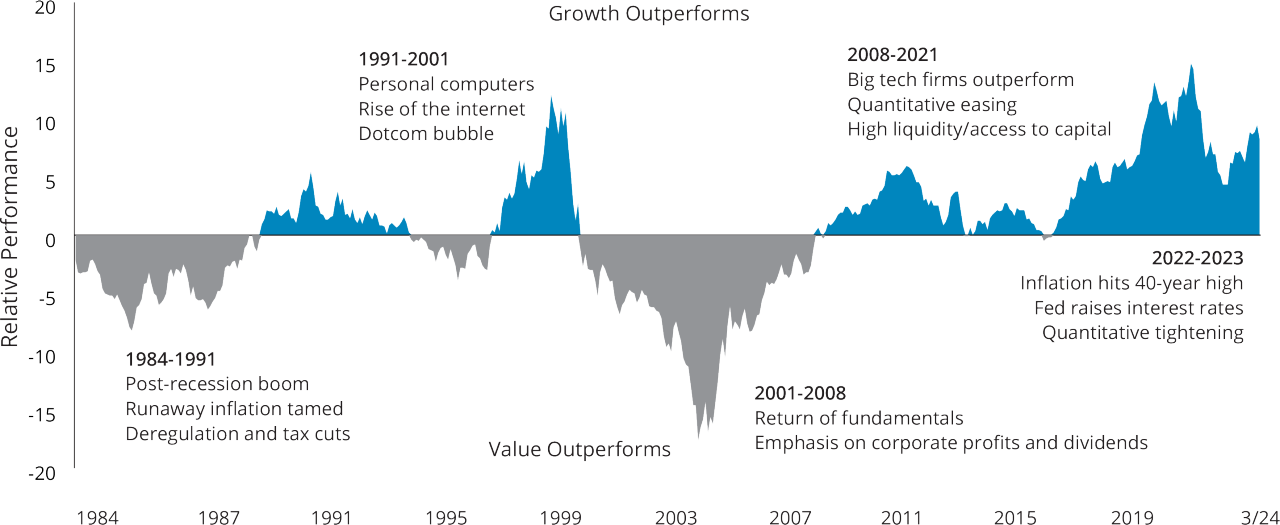
As of 3/31/24. Past performance does not guarantee future results. The chart shows the values of the Russell 1000 Growth Index returns minus the Russell 1000 Value Index returns. When the line is above 0, growth stocks outperformed value stocks. When the line is below 0, value stocks outperformed growth stocks. The performance shown above is index performance and is not representative of any Hartford Fund’s performance. Growth stocks are represented by the Russell 1000 Growth Index. Value stocks are represented by the Russell 1000 Value Index. Please see representative index definitions below. For illustrative purposes only. Data Sources: Morningstar and Hartford Funds, 4/24.
Historical Perspective
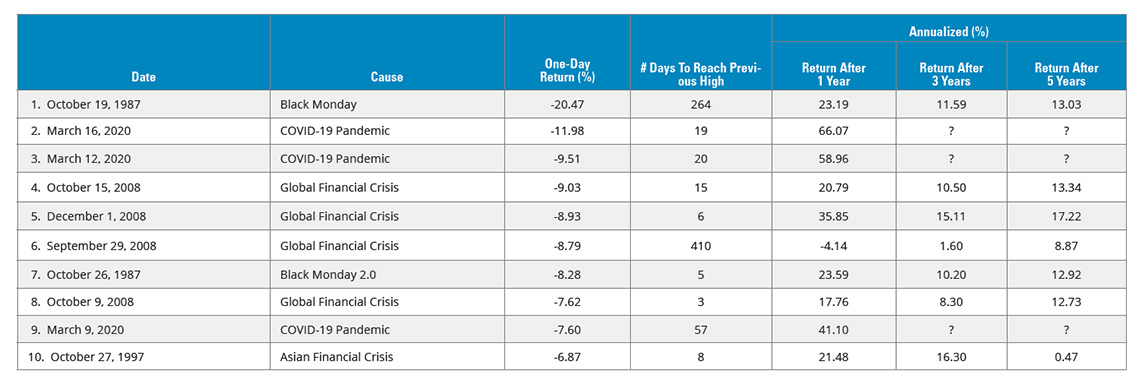
Top 10 Stock Market Drops & Recoveries
10 Worst Single-Day Percentage Declines for US Stocks (1980–2023)
| Annualized (%) | ||||||
| Date | Cause | One-Day Return (%) |
# Days To Reach Previous High | Return After 1 Year |
Return After 3 Year |
Return After 5 Year |
| 1. October 19, 1987 | Black Monday | -20.47 | 264 | 23.19 | 11.59 | 13.03 |
| 2. March 16, 2020 | COVID-19 Pandemic | -11.98 | 19 | 66.07 | 18.41 | ? |
| 3. March 12, 2020 | COVID-19 Pandemic | -9.51 | 20 | 58.96 | 15.91 | ? |
| 4. October 15, 2008 | Global Financial Crisis | -9.03 | 15 | 20.79 | 10.50 | 13.34 |
| 5. December 1, 2008 | Global Financial Crisis | -8.93 | 6 | 35.85 | 15.11 | 17.22 |
| 6. September 29, 2008 | Global Financial Crisis | -8.79 | 410 | -4.14 | 1.60 | 8.87 |
| 7. October 26, 1987 | Black Monday 2.0 | -8.28 | 5 | 23.59 | 10.20 | 12.92 |
| 8. October 9, 2008 | Global Financial Crisis | -7.62 | 3 | 17.76 | 8.30 | 12.73 |
| 9. March 9, 2020 | COVID-19 Pandemic | -7.60 | 57 | 41.10 | 12.58 | ? |
| 10. October 27, 1997 | Asian Financial Crisis | -6.87 | 8 | 21.48 | 16.30 | 0.47 |
Past performance does not guarantee future results. Data shown is for the S&P 500 Price Index as of 12/31/23 and does not include the reinvestment of dividend payments. Please see representative index definitions below. Data Sources: Morningstar, Ned Davis Research, and Hartford Funds, 1/24.
Historical Perspective
Missing the Market’s Best Days Has Been Costly
S&P 500 Index Growth of $10,000 (1994–2023)
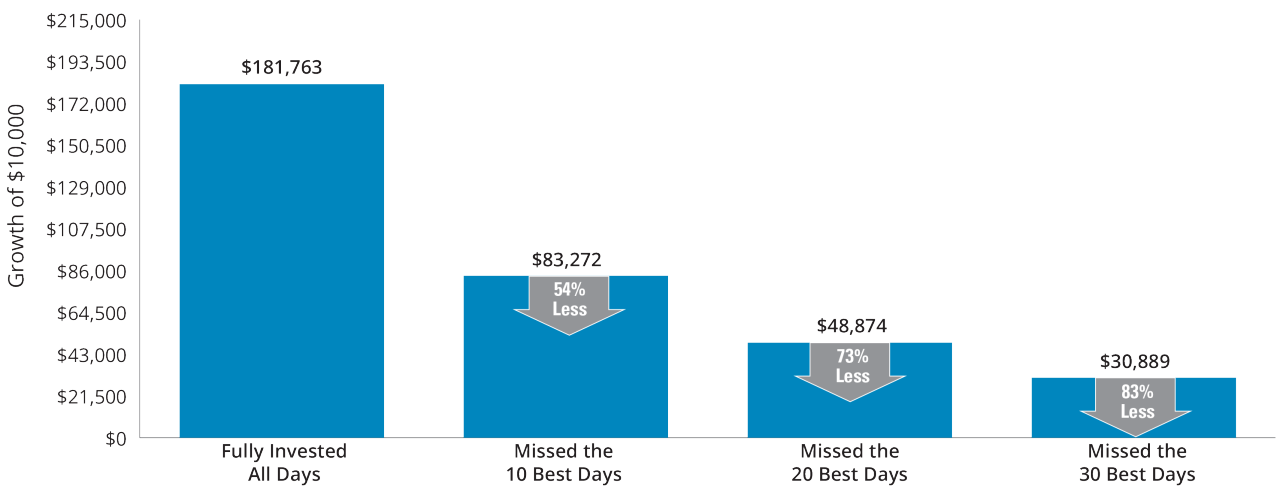
As of 12/31/23. Past performance does not guarantee future results. For illustrative purposes only. Data Sources: Ned Davis Research, Morningstar, and Hartford Funds, 1/24.
Historical Perspective
S&P 500 Index Bull Markets by the Numbers
Since 1928, there have been 27 bull markets
Average gain: 114.9%
Average length: 992 days or 2.7 years
Longest bull: 1987–2000 (582% gain); second longest; 2009–2020 (400% gain)
The first half of a bull has outperformed the second half 74% of the time (20 out of 27 bulls) by an average of 9%
The average gain during the first month of a new bull market: 13.6%
As of 12/31/23. Past performance does not guarantee future results. Data Source: Morningstar Direct, 1/24.
Historical Perspective
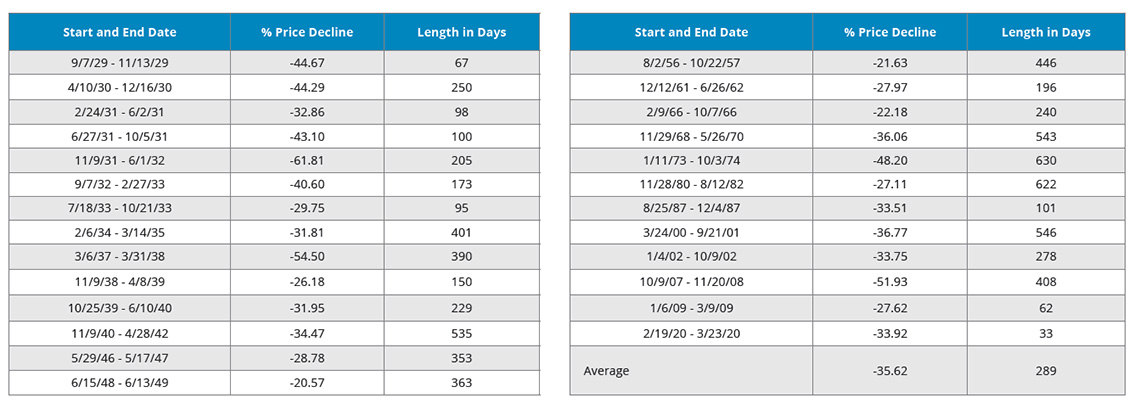
Bear Markets Are a Normal Part of Investing
S&P 500 Index Declines of 20% or More (1928–2023)
| Start and End Date | % Price Decline | Length in Days |
| 9/7/29 - 11/13/29 | -44.67 | 67 |
| 4/10/30 - 12/16/30 | -44.29 | 250 |
| 2/24/31 - 6/2/31 | -32.86 | 98 |
| 6/27/31 - 10/5/31 | -43.10 | 100 |
| 11/9/31 - 6/1/32 | -61.81 | 205 |
| 9/7/32 - 2/27/33 | -40.60 | 173 |
| 7/18/33 - 10/21/33 | -29.75 | 95 |
| 2/6/34 - 3/14/35 | -31.81 | 401 |
| 3/6/37 - 3/31/38 | -54.50 | 390 |
| 11/9/38 - 4/8/39 | -26.18 | 150 |
| 10/25/39 - 6/10/40 | -31.95 | 229 |
| 11/9/40 - 4/28/42 | -34.47 | 535 |
| 5/29/46 - 5/17/47 | -28.78 | 353 |
| 6/15/48 - 6/13/49 | -20.57 | 363 |
| Start and End Date | % Price Decline | Length in Days |
| 8/2/56 - 10/22/57 | -21.63 | 446 |
| 12/12/61 - 6/26/62 | -27.97 | 196 |
| 2/9/66 - 10/7/66 | -22.18 | 240 |
| 11/29/68 - 5/26/70 | -36.06 | 543 |
| 1/11/73 - 10/3/74 | -48.20 | 630 |
| 11/28/80 - 8/12/82 | -27.11 | 622 |
| 8/25/87 - 12/4/87 | -33.51 | 101 |
| 3/24/00 - 9/21/01 | -36.77 | 546 |
| 1/4/02 - 10/9/02 | -33.75 | 278 |
| 10/9/07 - 11/20/08 | -51.93 | 408 |
| 1/6/09 - 3/9/09 | -27.62 | 62 |
| 2/19/20 - 3/23/20 | -33.92 | 33 |
| 1/3/2022 - 10/12/2022 | -25.43 | 282 |
| Average | -35.24 | 289 |
As of 12/31/23. Past performance does not guarantee future results. Data Source: Ned Davis Research, 1/24.
Historical Perspective
A Balanced Portfolio Can Help Balance Out Volatility
Cumulative Returns for Stocks, Bonds, and a Balanced Portfolio (2000–2023)
| Years | Stocks | Bonds | Balanced | Investor Mindset |
| 2000-2002 | -37.6% | 33.5% | -6.4% | "Why do I own stocks?" |
| 2003-2007 | 82.9% | 24.2% | 51.8% | "Why do I own bonds?" |
| 2008 | -37.0% | 5.2% | -15.9% | "Why do I own stocks?" |
| 2009-2017 | 258.8% | 40.7% | 129.8% | "Why do I own bonds?" |
| 2018 | -4.4% | 0.0% | -2.2% | "Why do I own stocks?" |
| 2019-2023 | 107.2% | 5.6% | 50.8% | "Why do I own bonds?" |
| Total return 2000-2023 | 410.9% | 159.3% | 305.4% | |
| Growth of $100,000 | $510,924 | $259,310 | $405,382 |
As of 12/31/23. Past performance does not guarantee future results. Stocks are represented by S&P 500 Index. Bonds are represented by the Bloomberg US Aggregate Bond Index. Balanced Portfolio is represented by 50% S&P 500 Index and 50% Bloomberg US Aggregate Bond Index. For illustrative purposes only. Data Sources: Morningstar and Hartford Funds, 1/24.
Investor Behavior
Buying and Selling at the Wrong Times Could Be Costly
30-year Annualized Returns by Asset Class (%) (1992–2023)
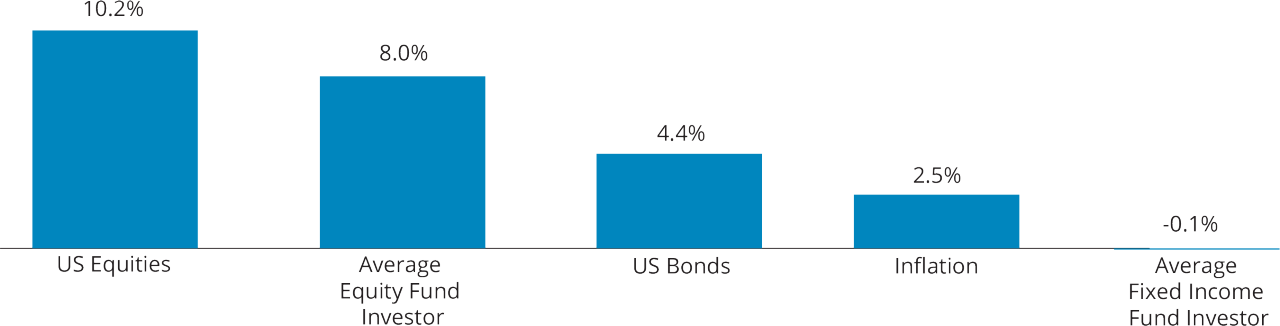
As of 12/31/23. Performance data for indices represents a lump-sum investment in 1/1/93–12/31/23 with no withdrawals. US Equities are represented by the S&P 500 Index. US Bonds are represented by the Bloomberg US Aggregate Bond Index. Index performance is not indicative of any Hartford Funds’ performance.
Average Equity Fund Investor and Average Fixed Income Fund Investor performance results are calculated using data supplied by the Investment Company Institute. Investor returns are represented by the change in total mutual fund assets after excluding sales, redemptions, and exchanges. This method of calculation captures realized and unrealized capital gains, dividends, interest, trading costs, sales charges, fees, expenses, and any other costs. After calculating investor returns in dollar terms, two percentages are calculated for the period examined: Total investor return rate and annualized investor-return rate. Total investor-return rate is determined by calculating the investor-return dollars as a percentage of the net of the sales, redemptions, and exchanges for each period.
Dalbar’s Quantitative Analysis of Investor Behavior Methodology – Dalbar’s Quantitative Analysis of Investor Behavior uses data from the Investment Company Institute (ICI), Standard & Poor’s, and Bloomberg Index Products to compare mutual-fund investor returns to an appropriate set of benchmarks. Covering the period from 1/1/93–12/31/23, the study utilizes mutual-fund sales, redemptions and exchanges each month as the measure of investor behavior. These behaviors reflect the “average investor.” Based on this behavior, the analysis calculates the “average investor return” for various periods. These results are then compared to the returns of respective indices.
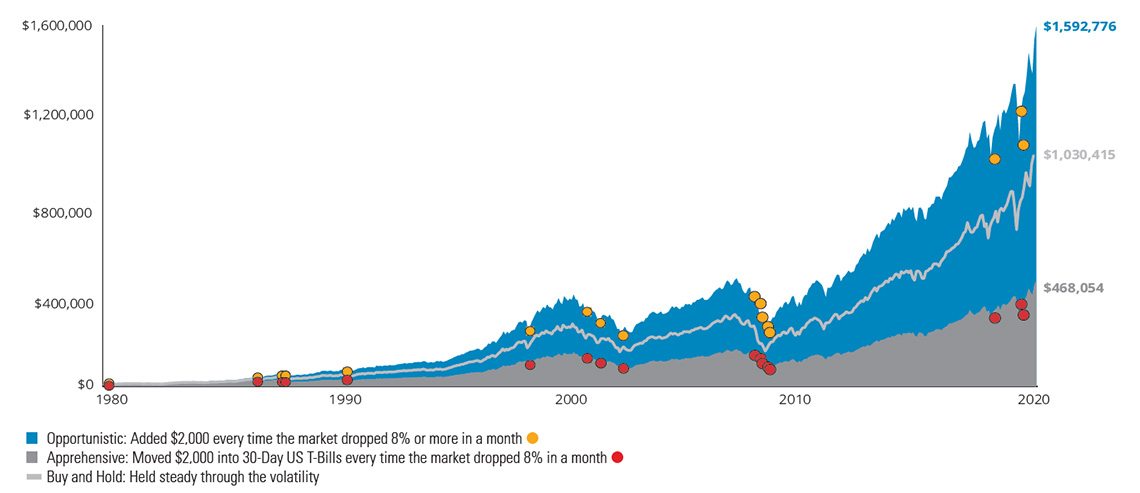
Investor Behavior
Buying Stocks After Big Market Drops Has Historically Been Profitable
S&P 500 Index Hypothetical Growth of $10,000 (1980–2023)
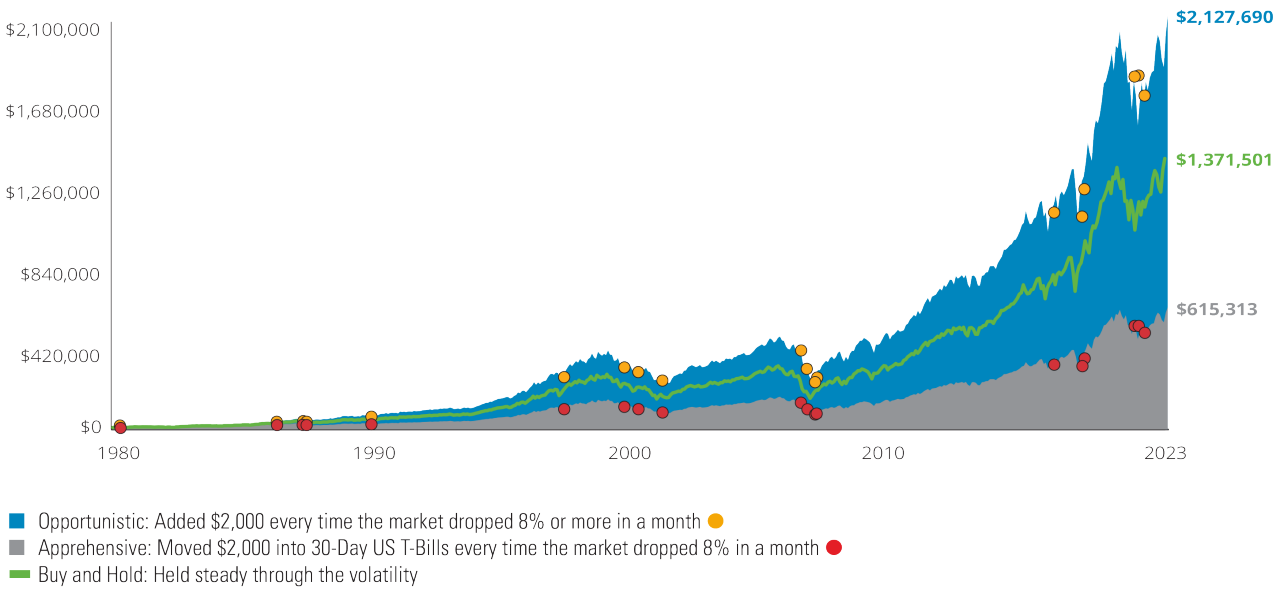
As of 12/31/23. Past performance does not guarantee future results. Assumes reinvestment of capital gains and dividends and no taxes. Data Sources: Thomson Reuters and Hartford Funds, 1/24.