• Products
  • Insights
  • Practice Management
  • Resources
  • About Us

Functions Of The Reactive And Reflective Parts Of Our Brains

Reactive Brain

  • Avoid danger or loss
  • Can shut down reflective brain
  • Emotional responses

Reflective Brain

  • Complex decisions
  • Rational
  • Analytical

Remaining calm is a Navy Seal’s key to success. Yes, they endure extreme combat training. But during a mission, all that training would be useless if they couldn’t control their emotions. To remain calm, they use “box breathing.” You can try it by breathing in for four seconds, holding your breath for four seconds, exhaling for four seconds, and holding your lungs empty for four seconds. Repeat it a few times. In the most stressful situations, box breathing helps Seals remain calm.1

Similarly, investors need to remain calm when market volatility strikes, but it can be difficult to control our emotions. When we fear losing money or missing out on gains, emotions can influence our decision-making ability. Like the Seals, we need a way to control our emotions to avoid making decisions that could hurt our long-term results.


1. Two Parts of Our Brain With Different Objectives

Imagine you’re taking a relaxing walk down a trail. Suddenly, a snake slithers on the path in front of you. Do you start trying to determine what kind of snake it is, or whether or not it’s poisonous? Probably not. Most of us, with the exception of snake enthusiasts, automatically stop, jump back, and start walking backwards. 

This type of response is caused by what neuroscientists call our reactive brain. It’s the part of our brain that helps us avoid danger or loss.2 With investing, it reacts when we’re afraid of losing money. It can also react with excitement when we have a big gain or worry if we’re afraid of missing one. For example, our reactive brain is activated when people in the office pool their money together to buy a lottery ticket. Our reactive brain wants us to participate so we don’t miss out on a windfall.

Another part of our brain is what’s called the reflective brain. It performs complex decision-making and planning, e.g. solving a calculus problem, or following a recipe. How the reactive and reflective parts of our brain work together can have significant effects on our investment results.


2. When Our Reactive Brain Takes Over

We like to think of ourselves as rational decision-makers when it comes to investing. We envision ourselves building a long-term plan, with a diversified portfolio of stocks, bonds, and cash investments —and sticking with it. But sometimes, market volatility can influence our rational outlook, such as an 1,000- or 2,000-point drop or rise in the Dow (See Figure 1). Many things can drive volatility, such as trade deals, national debt, interest rates, and more recently, a pandemic. Dramatic headlines often follow, proclaiming either soaring or plunging markets, which can cause our rational mindset to go haywire.2

Sometimes, those big point drops turn into bear markets (typically defined as a 20% market drop). Since WWII, there have been 13 bear markets—one about every 5.7 years.3 When they happen, do you think to yourself, “Oh, that’s just another bear market. I’m a long-term investor, so I’m not going to give in to fear by changing my portfolio”? Possibly.

But often a bear market can cause a different reaction—one that causes investors to question their investment plans. News about market drops can trigger our reactive brain in about 12 milliseconds.2 Because its function is to help us avoid danger and loss, our reactive brain can tempt us to change our portfolio to avert losing more money.


Functions Of The Reactive And Reflective Parts Of Our Brains

Reactive Brain

  • Avoid danger or loss
  • Can shut down reflective brain
  • Emotional responses

Reflective Brain

  • Complex decisions
  • Rational
  • Analytical

Figure 1. Big Drops and Rises Activate Our Reactive Brains

The Dow’s Largest Point Losses and Gains

Largest Daily Point Gains
3/24/2020 2,112.98
3/13/2020 1,985.00
4/6/2020 1,627.46
3/26/2020 1,351.62
3/2/2020 1,293.97
Largest Daily Point Losses
3/16/2020
-2,997.10
3/12/2020 -2,352.60
3/9/2020 -2,013.76
6/11/2020 -1,861.82
3/11/2020 -1,464.95

When our reactive brain responds to large drops or rises, we can be tempted to change our portfolios.

Past performance does not guarantee future results. Investors cannot directly invest in an index.

Source: Factset, 2021


But What About Our Reflective Brain?

Can’t our more rational reflective brain counter the emotional response of the reactive brain? Unlike the reactive brains 12-millisecond response speed, the reflective brain takes 40 milliseconds for the market-drop news to reach it—more than three times longer.2 By that time, our reactive brain may have already taken control of our decision-making, essentially shutting down the reflective brain’s more rational perspective.2


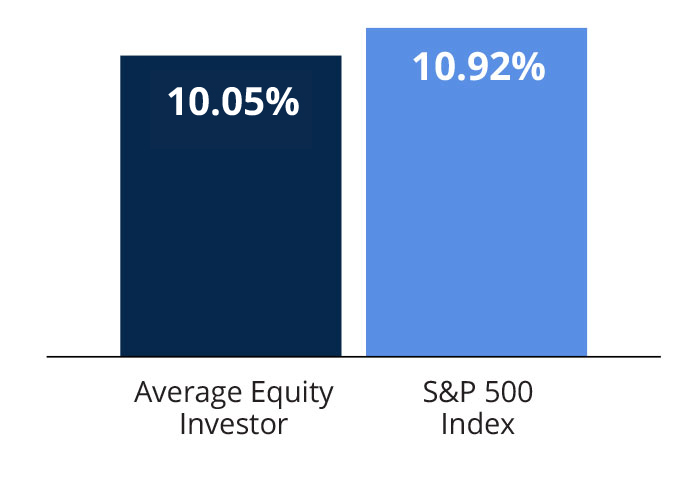
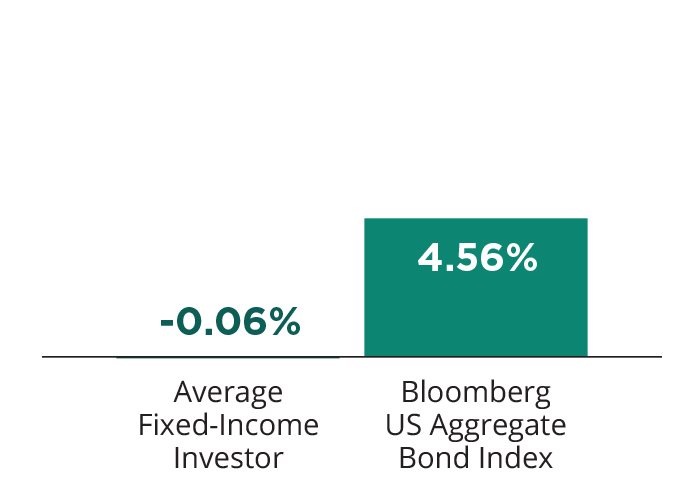
Figure 2: Individual Investors Have Underperformed Market Indices

Average Annual Returns for the 30 Year Period Ending 12/31/2021

Source: Quantitative Analysis of Investor Behavior, Dalbar, 2021

Past performance does not guarantee future results. Performance data for indices represents a lump sum investment in January 1992 to December 2021 with no withdrawals. Stocks are represented by the S&P 500 Index. Bonds are represented by the Bloomberg US Aggregate Bond Index. Indices are unmanaged, unavailable for direct investment, and do not reflect fees, expenses, or sales charges.

 Please see below for the calculation of the average equity and fixed-income investor.


When Our Reactive Brain Takes Over, We’re More Likely to Make Decisions That Could Hurt Long-Term Results

We may be more apt to choose safer investments during market volatility. As a result, we could miss recoveries. Alternatively, after a series of upward market moves, we may choose more aggressive investments, then experience significant losses if the market drops again. Over time, these kinds of reactive decisions tend to reduce the returns of individual investors.

Dalbar’s Quantitative Analysis of Investor Behavior demonstrates that emotions can get the best of investors when it comes to decision-making. Over the past 30 years, based on average annual returns, the average equity investor underperformed the market each year by an average of 3.52%. The market returned 10.65%, while the average equity investor’s return was 7.13% (See Figure 2).

The reactive brain’s influence can reduce investment results. According to the Dalbar report, “...it’s the psychological traps, triggers, and misconceptions that cause investors to act irrationally. That irrationality leads to buying and selling at the wrong time, which can lead to underperformance.”


3. How We Can Resist Our Reactive Brain When the Market Drops

There’s plenty of information online to help you build a portfolio yourself. There are also online services that will do it for you. These options may be cheaper than hiring a financial professional, but building a portfolio is only one aspect of investing.

How you manage that portfolio over time will affect your long-term results. Will you be able to control your emotions when your reactive brain wants to take over during market volatility? There are resources that can teach investors how to remain calm and make rational investment decisions. However, many investors may not have the time or motivation to learn these techniques. And even if they did, it doesn’t guarantee that they won’t make mistakes in a market meltdown.

A financial professional can help you manage your emotions and decision-making when your reactive brain tries to take over. They’ve seen bear markets come and go. They know how to weather the storm when markets get rough. 

On the surface, hiring an financial professional will cost you more than managing your portfolio yourself. Many financial professional charge a percentage of an investor’s balance, typically about 1% a year.4

But that 1% fee may be worth it, especially if a financial professional could help you avoid the types of mistakes that caused to the individual investor to underperform the market by 3.52%.2


“But Even With a Financial Professional, I Still Can’t Stand Losing Money”

A financial professional could help you avoid emotion-based investment decisions. But ultimately, you’re in control of your decisions. At any time, you can tell your financial professional that you can’t take any more market volatility and want to change your portfolio. The financial professional will honor your decision. So if you choose to work with a financial professional, you’ll have to decide if you’re going to trust their advice when volatility strikes.


Remember 3 Things About Decision-Making During Periods of Market Volatility

First, realize that your brain has two parts that are involved with decision making, the reactive and reflective systems. Second, when volatility strikes, your reactive brain can overpower and even shut down your reflective brain. When the reactive brain takes over, you can be apt to make emotionally-based decisions. Third, a financial professional could help you avoid emotionally-based investment mistakes.


Sticking to a Plan Can Be Difficult

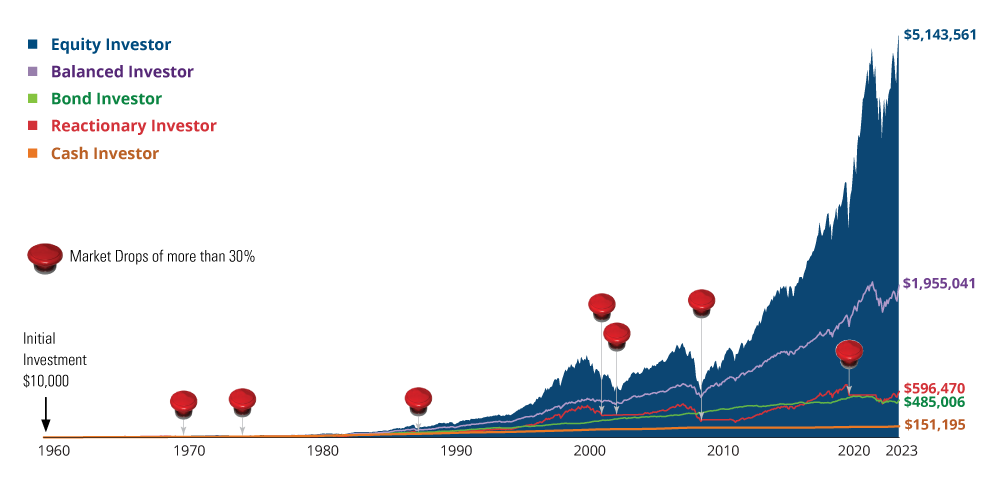
If you look at investment history achieving investment success appears pretty simple (See Figure 3). Stocks had more volatility, but they outperformed bonds and cash. That’s why many investors build a portfolio over-weighted in stocks, and stick with it for the long-term.

But sticking with that plan isn’t easy. Remaining calm under stress, like a Navy Seal, can be extremely difficult, especially during times of volatility. During bear markets our reactive brain can take control and tempt us to change our plan to minimize losses. A financial professional can help you resist these urges and keep your plan in place.


Figure 3: The Price of Panic

$10,000 Invested S&P 500 Index 12/31/59–12/31/2021

Despite repeated, sometimes verbatim, predictions of dire global catastrophe or outrageous economic boom, the markets have been resilient to either hyped extreme.

When the market drops 30%, it’s possible for our reactive brain to influence decision making. We can be tempted to make our portfolio safer, like the Reactionary Investor did in the graph above. Historically, those panicked decisions hurt investment returns.

Past performance does not guarantee future results. Equity returns are represented by the S&P 500 Index. Bond returns are represented by the Bloomberg Long-Term US Treasury Total Return Index. Reactionary returns indicate the results of an investor who invested in S&P 500 Index, moved 100% into 90-Day T-Bills each time the market dropped 30% and then moved 100% back into S&P 500 Index two years later. Balanced returns are represented by 50% S&P 500 Index and 50% Bloomberg Long-Term US Treasury Total Return Index. Cash returns are represented by 90-Day T-Bills.

Data Source: Ned Davis Research, 12/19. For illustrative purposes only. Indices are unmanaged and not available for direct investment..


Next Steps

1 Reflect on past periods of market volatility, e.g. The Great Recession of 2007-2009, or when the market dropped nearly 20% in December 2018, or the bear market in 2020
2 Think about how you responded. Were you tempted to change your portfolio? Did you?
3 Have a conversation with your financial professional about how he or she could help you respond during future market volatility


The Headline Syndrome: How to Avoid Panicked Investment Decisions When the Market Drops >

Financial Professionals Next Steps

1 Download or order this article.
2 This article is based off of our popular Media Replay module. Click here to access additional content to share. 

Dalbar’s Quantitative Analysis of Investor Behavior Methodology - Dalbar’s Quantitative Analysis of Investor Behavior uses data from the Investment Company Institute (ICI), Standard & Poor’s, and Barclays Index Products to compare mutual fund investor returns to an appropriate set of benchmarks. Covering the period from January 1, 1991 to December 31, 2020, the study utilizes mutual fund sales, redemptions and exchanges each month as the measure of investor behavior. These behaviors reflect the “average investor.” Based on this behavior, the analysis calculates the “average investor return” for various periods. These results are then compared to the returns of respective indices.

Average equity investor and average bond investor performance results are calculated using data supplied by the Investment Company Institute. Investor returns are represented by the change in total mutual fund assets after excluding sales, redemptions, and exchanges. This method of calculation captures realized and unrealized capital gains, dividends, interest, trading costs, sales charges, fees, expenses, and any other costs. After calculating investor returns in dollar terms, two percentages are calculated for the period examined: total investor return rate and annualized investor return rate. Total investor return rate is determined by calculating the investor return dollars as a percentage of the net of the sales, redemptions, and exchanges for each period.

Sources:

“How To De-Stress In 5 Minutes Or Less, According To A Navy SEAL,” Forbes, 5/30/19. Most recent data available.

Lennick, Doug. Financial intelligence, FPA Press, 4/21/2010. Most recent data available.

Ned Davis Research, 12/21

4 "The Problem With How Many Financial Advisers Set Their Fees," The Wall Street Journal, 11/12/21

Investing involves risk, including the possible loss of principal. • Fixed income security risks include credit, liquidity, call, duration, event and interest-rate risk. As interest rates rise, bond prices generally fall. •Diversification does not ensure a profit or protect against a loss in declining market.

This information should not be considered investment advice or a recommendation to buy/sell any security. In addition, it does not take into account the specific investment objectives, tax and financial condition of any specific person. This information has been prepared from sources believed reliable but the accuracy and completeness of the information cannot be guaranteed. This material and/or its contents are current at the time of writing and are subject to change without notice.

Index Descriptions

Indices are unmanaged, and unavailable for direct investment, and do not represent the performance of any Hartford Funds.

Dow Jones Industrial Average is a price-weighted average of 30 significant stocks traded on the New York Stock Exchange and the Nasdaq.

S&P 500 Index is a market capitalization-weighted price index composed of 500 widely held common stocks.

Bloomberg US Aggregate Bond Index is composed of securities that covers the US investment grade fixed rate bond market, with index components for government and corporate securities, mortgage pass-through securities, and asset-backed securities.

“Bloomberg®” and any Bloomberg Index are service marks of Bloomberg Finance L.P. and its affiliates, including Bloomberg Index Services Limited (“BISL”), the administrator of the indices (collectively, “Bloomberg”) and have been licensed for use for certain purposes by Hartford Funds. Bloomberg is not affiliated with Hartford Funds, and Bloomberg does not approve, endorse, review, or recommend any Hartford Funds product. Bloomberg does not guarantee the timeliness, accurateness, or completeness of any data or information relating to Hartford Fund products. 

228937

The material on this site is for informational and educational purposes only. The material should not be considered tax or legal advice and is not to be relied on as a forecast. The material is also not a recommendation or advice regarding any particular security, strategy or product. Hartford Funds does not represent that any products or strategies discussed are appropriate for any particular investor so investors should seek their own professional advice before investing. Hartford Funds does not serve as a fiduciary. Content is current as of the publication date or date indicated, and may be superseded by subsequent market and economic conditions.

Investing involves risk, including the possible loss of principal. Investors should carefully consider a fund's investment objectives, risks, charges and expenses. This and other important information is contained in the mutual fund, or ETF summary prospectus and/or prospectus, which can be obtained from a financial professional and should be read carefully before investing.

Mutual funds are distributed by Hartford Funds Distributors, LLC (HFD), Member FINRA|SIPC. ETFs are distributed by ALPS Distributors, Inc. (ALPS). Advisory services may be provided by Hartford Funds Management Company, LLC (HFMC) or its wholly owned subsidiary, Lattice Strategies LLC (Lattice). Certain funds are sub-advised by Wellington Management Company LLP and/or Schroder Investment Management North America Inc (SIMNA). Schroder Investment Management North America Ltd. (SIMNA Ltd) serves as a secondary sub-adviser to certain funds. HFMC, Lattice, Wellington Management, SIMNA, and SIMNA Ltd. are all SEC registered investment advisers. Hartford Funds refers to HFD, Lattice, and HFMC, which are not affiliated with any sub-adviser or ALPS. The funds and other products referred to on this Site may be offered and sold only to persons in the United States and its territories.

© Copyright 2024 Hartford Funds Management Group, Inc. All Rights Reserved. Not FDIC Insured | No Bank Guarantee | May Lose Value