
Pre-Sales Support
Mutual Funds and ETFs - 800-456-7526
Monday-Thursday: 8:00 a.m. – 6:00 p.m. ET
Friday: 8:00 a.m. – 5:00 p.m. ET
Post-Sales and Website Support
888-843-7824
Monday-Friday: 9:00 a.m. - 6:00 p.m. ET
After crashing hard in April, the US stock market rebounded even harder, recently hitting a new all-time high. This has left many investors feeling nervous about the potential for a fall.
Many others have parked savings in cash, attracted by the high rates being offered. The thought of investing cash that’s currently sitting on the sidelines feels uncomfortable when the stock market is at an all-time high. But should it?
The conclusion from our analysis of stock-market returns since 1926 is unequivocal: No.
The market is actually at an all-time high more often than you might think. Of the 1,188 months since January 1926, the market was at an all-time high in 363 of them, or 31% of the time.
And, on average, 12-month returns following an all-time high being hit have been better than at other times: 10.4% compared with 8.8% when the market wasn’t at a high. Returns on a two- or three-year horizon have been similar, regardless of whether the market was at an all-time high or not (FIGURE 1).
FIGURE 1
12-Month Returns: Higher After All-Time Stock Highs
Average Inflation-Adjusted Returns for US Large-Cap Equities
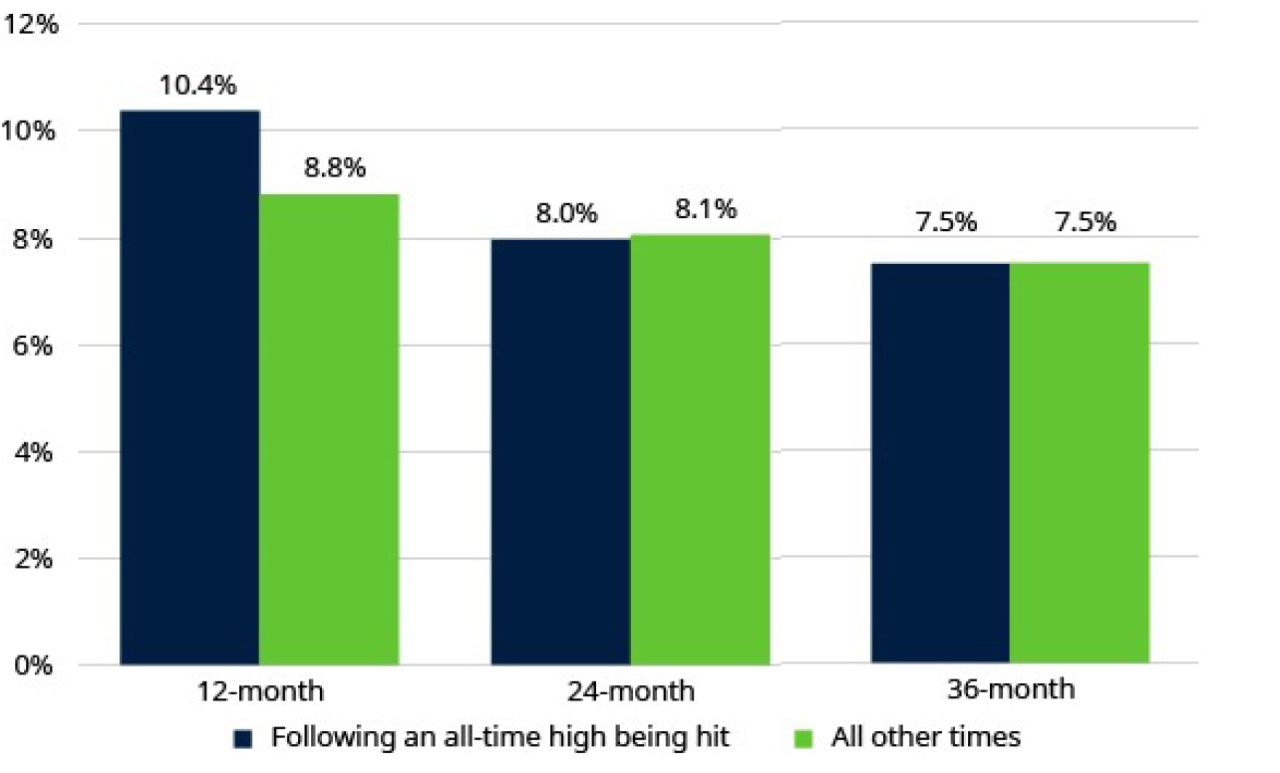
As of 12/31/24. Past performance does not guarantee future results. Indices are unmanaged and not available for direct investment. Data from January 1926 to December 2024. Stocks represented by Ibbotson® SBBI® US Large-Cap Stocks. See below for representative index definitions.1 Source: Morningstar Direct, accessed via CFA Institute and Schroders.
Differences Compound Over Time
A $100 investment in the US stock market in January 1926 would have been worth $103,294 at the end of 2024 in inflation-adjusted terms—growth of 7.3% a year. In contrast, a strategy of switching out of the market and into cash for the next month whenever the market hit an all-time high (and went back in again whenever it wasn’t at an all-time high) would only be worth $9,922—90% lower (FIGURE 2). The return on this portfolio would have been 4.8% in inflation-adjusted terms. Over long time horizons, differences in returns can seriously add up.
FIGURE 2
Selling Stocks at an All-Time High Can Potentially Destroy Long-Term Wealth
Growth of $100, Inflation-Adjusted (1926-2024)
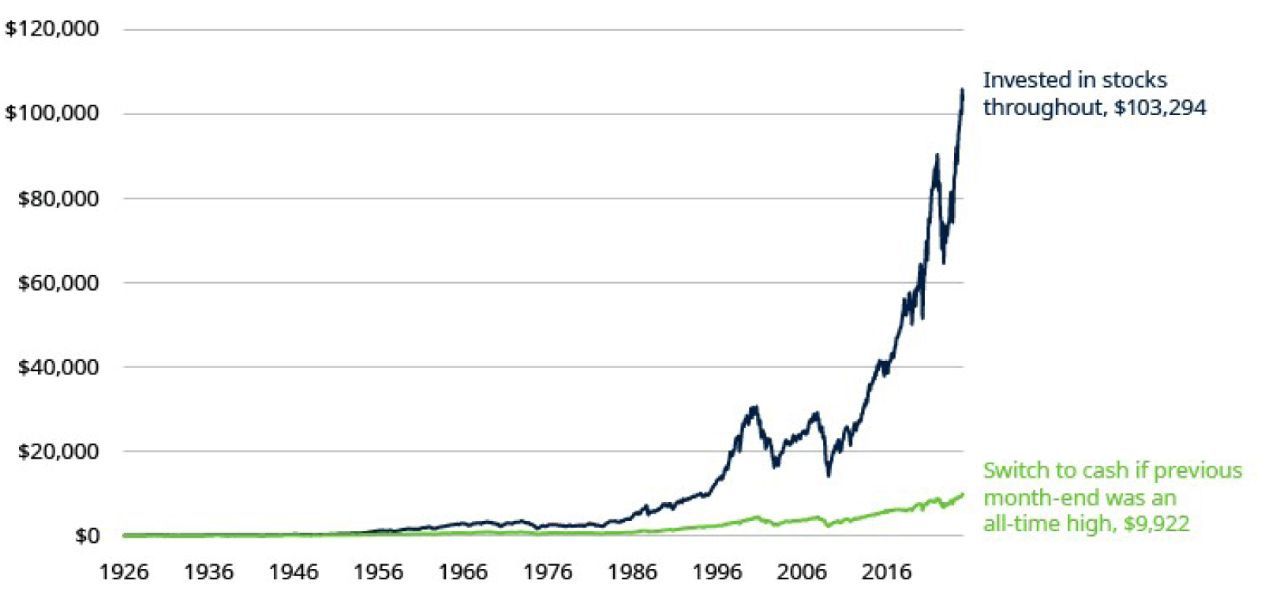
As of 12/31/24. Past performance does not guarantee future results. Indices are unmanaged and not available for direct investment. Data from January 1926 to December 2024. Y-axis is a logarithmic scale. The switching strategy moves stocks into cash for the next month whenever the previous month-end reached an all-time high, and is invested in stocks whenever it didn’t. Results exclude transaction costs. Stocks represented by Ibbotson® SBBI® US Large-Cap Stocks, Cash by Ibbotson® US (30-day) Treasury Bills. See below for representative index definitions.1 Source: Morningstar Direct, accessed via CFA Institute and Schroders.
A $100 investment in the US stock market in January 1926 would have been worth $103,294 at the end of 2024 in inflation-adjusted terms—growth of 7.3% a year.
This analysis covers a nearly 100-year time horizon, longer than most people plan for. But, even over shorter horizons (FIGURE 3), investors would have missed out on a lot of potential wealth if they’d been frightened away whenever the market was riding high.
FIGURE 3
Untimely Selling During Shorter Time Horizons Can Also Erode Wealth
Growth of $100, Inflation-Adjusted Terms
| Growth of $100 Invested "X" Years Ago | Invested in Stocks Throughout | Switched to Cash When Previous Month-End Was an All-Time High | Wealth Destroyed by Switching |
| 10 years | $255 | $185 | -27% |
| 20 years | $433 | $268 | -38% |
| 30 years | $1,064 | $449 | -58% |
| 50 years | $5,627 | $2,035 | -64% |
| Since 1926 | $103,294 | $9,922 | -90% |
As of 12/31/24. Past performance does not guarantee future results. Indices are unmanaged and not available for direct investment. Data from January 1926 to December 2024. The switching strategy moves stocks into cash for the next month whenever the previous month-end reached an all-time high, and is invested in stocks whenever it didn’t. Results exclude transaction costs. Stocks represented by Ibbotson® SBBI® US Large-Cap Stocks, Cash by Ibbotson® US (30-day) Treasury Bills. See below for representative index definitions.1 Source: Morningstar Direct, accessed via CFA Institute and Schroders.
Conclusion? Don't Fret Over All-Time Highs
It's normal to feel nervous about investing when the stock market is at an all-time high, but history suggests that giving in to that feeling could be very damaging for your wealth. There may be valid reasons for you to dislike stocks. But the market being at an all-time high shouldn’t be one of them.
A financial professional can help you develop a consistent investing plan based on your long-term goals.
1 The IA SBBI® US Large Cap Stocks Index, part of the Ibbotson Associates Stocks, Bonds, Bills and Inflation Series (SBBI®), represents the performance of large-cap stocks in the US. Cash is measured by the IA SBBI® US 30-Day T-Bill Index, which measures the performance of short-term US Treasury bills with maturities of 30 days. This index is often used as a benchmark for cash equivalents and represents the returns on cash investments over a short-term period.
Important Risks: Investing involves risk, including the possible loss of principal.
This information should not be considered investment advice or a recommendation to buy/sell any security. In addition, it does not take into account the specific investment objectives, tax and financial condition of any specific person. This information has been prepared from sources believed reliable, but the accuracy and completeness of the information cannot be guaranteed. This material and/or its contents are current at the time of writing and are subject to change without notice.
The views expressed herein are those of Schroders Investment Management, are for informational purposes only, and are subject to change based on prevailing market, economic, and other conditions. The views expressed may not reflect the opinions of Hartford Funds or any other sub-adviser to our funds. They should not be construed as research or investment advice nor should they be considered an offer or solicitation to buy or sell any security. This information is current at the time of writing and may not be reproduced or distributed in whole or in part, for any purpose, without the express written consent of Schroders Investment Management or Hartford Funds.


