1 Every quarter, the Office of Debt Management at the United States Department of the Treasury announces its funding needs for the next two quarters. The announcement details which securities will be offered and the dates of their announcement, auction, and settlement. This is mostly of interest to bond traders who will be looking at the amount of debt that is to be issued so that they can gauge the supply of debt in the market.
2 Duration is a measure of the sensitivity of an investment’s price to nominal interest-rate movement. A short-duration strategy is one where a fixed-income investor is focused on buying bonds with a small amount of time to maturity.
3 The CPI in the US is defined by the Bureau of Labor Statistics as “a measure of the average change over time in the prices paid by urban consumers for a market basket of consumer goods and services.
4 ISM manufacturing index stands for the Institute for Supply Management Manufacturing Index. Also known as the Purchasing Managers' Index (PMI), it's a monthly indicator of US economic activity based on a survey of purchasing managers at more than 300 manufacturing firms.
5 Short covering refers to buying back borrowed securities in order to close out an open short position at a profit or loss. It requires purchasing the same security that was initially sold short, and handing back the shares initially borrowed for the short sale. Short selling a security is when a trader borrows shares from a broker and immediately sells them with the expectation that the share price will fall shortly after. If it does, the trader can buy the shares back at the lower price, return them to the broker, and keep the difference, minus loan interest, as profit.
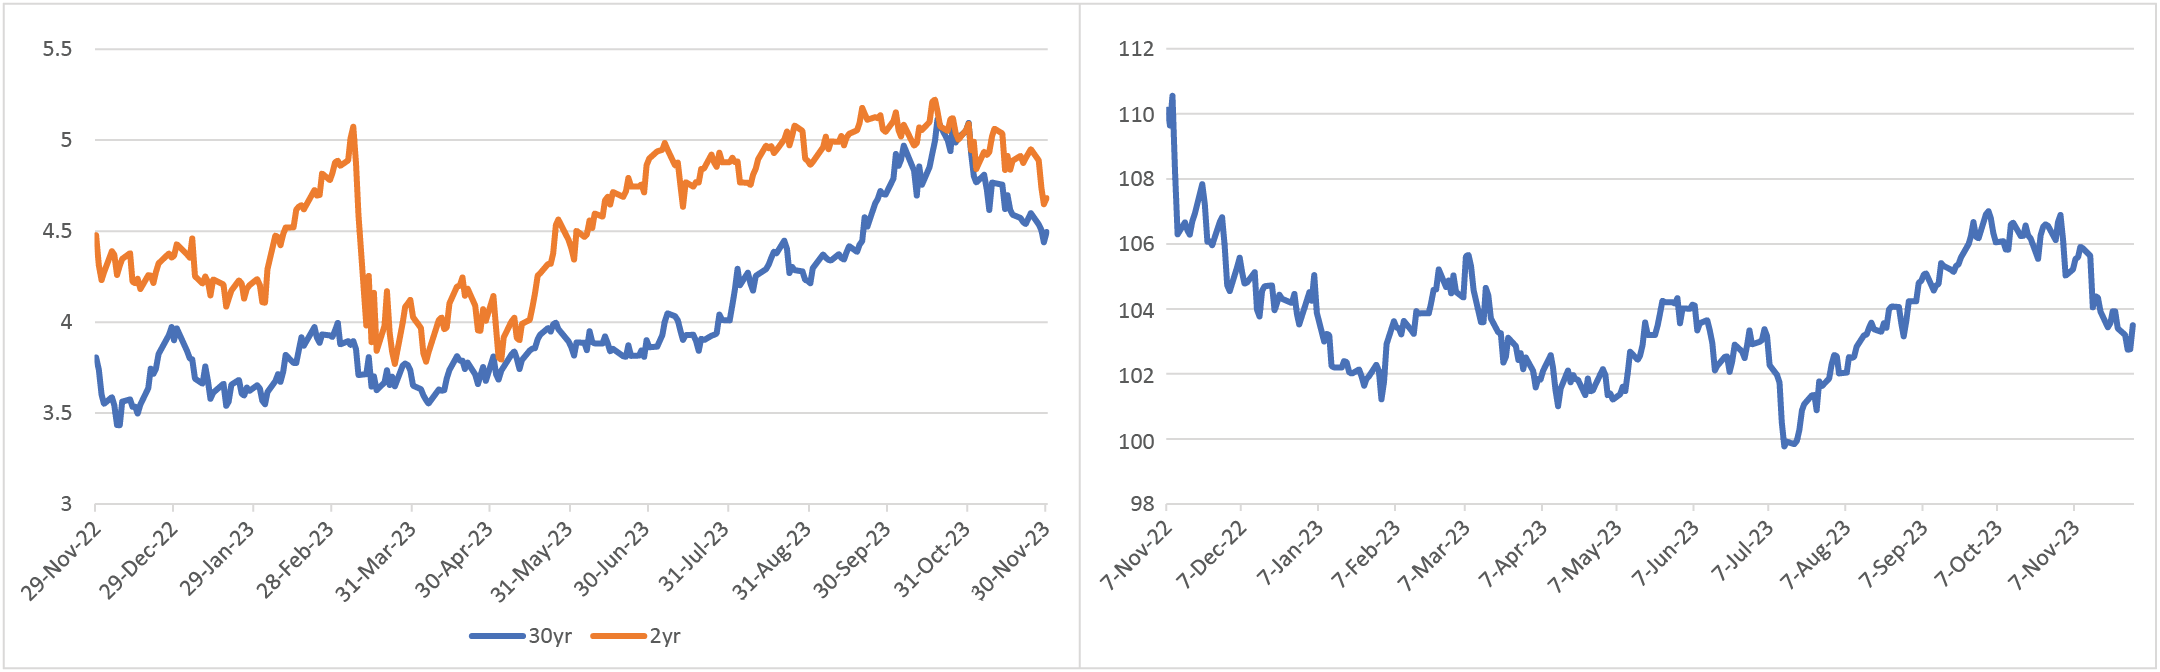
6 Long bonds offer a maturity date far out on the investment horizon. For the U.S. Treasury market, this includes the 30-year Treasury which has the longest maturity of all offerings. Corporate bonds, however, can issue maturities in different variations. Corporate bonds may offer maturities of 15, 20, or 25 years.
7 The yield curve is a line that plots interest rates of bonds having equal credit quality but differing maturity dates; its slope is used to forecast the state of the economy and interest-rate changes.
8 On-the-run Treasuries are the most recently issued US Treasury bonds or notes of a particular maturity.
9 A basis point (bps) is a unit that is equal to 1/100th of 1%, and is used to denote the change in a financial instrument. The basis point is commonly used for calculating changes in interest rates, equity indices, and the yield of a fixed-income security.
10 The Bloomberg US Corporate High Yield Bond Index measures the USD-denominated, high-yield, fixed-rate corporate bond market. Securities are classified as high yield if the middle rating of Moody’s, Fitch, and S&P is Ba1/BB+/BB+ or below.
11 Spreads are the difference in yields between two fixed-income securities with the same maturity but originating from different investment sectors.
12 An investment-grade rating is a rating that signifies whether a municipal or corporate bond presents a relatively low risk of default. Bond-rating firms such as Standard & Poor’s (S&P), Moody's, and Fitch use different designations, consisting of the upper- and lower-case letters "A" and "B," to identify a bond's credit quality rating. "AAA" and "AA" (high credit quality) and "A" and "BBB" (medium credit quality) are considered investment grade. Credit ratings for bonds below these designations ("BB," "B," "CCC," etc.) are considered low credit quality and are commonly referred to as junk bonds.
13 The option-adjusted spread is the measurement of the spread of a fixed-income security rate and the risk-free rate of return, which is then adjusted to account for an embedded option (defined as provisions included with some fixed-income securities that allow the investor or the issuer to take specific actions, such as calling back the issue).
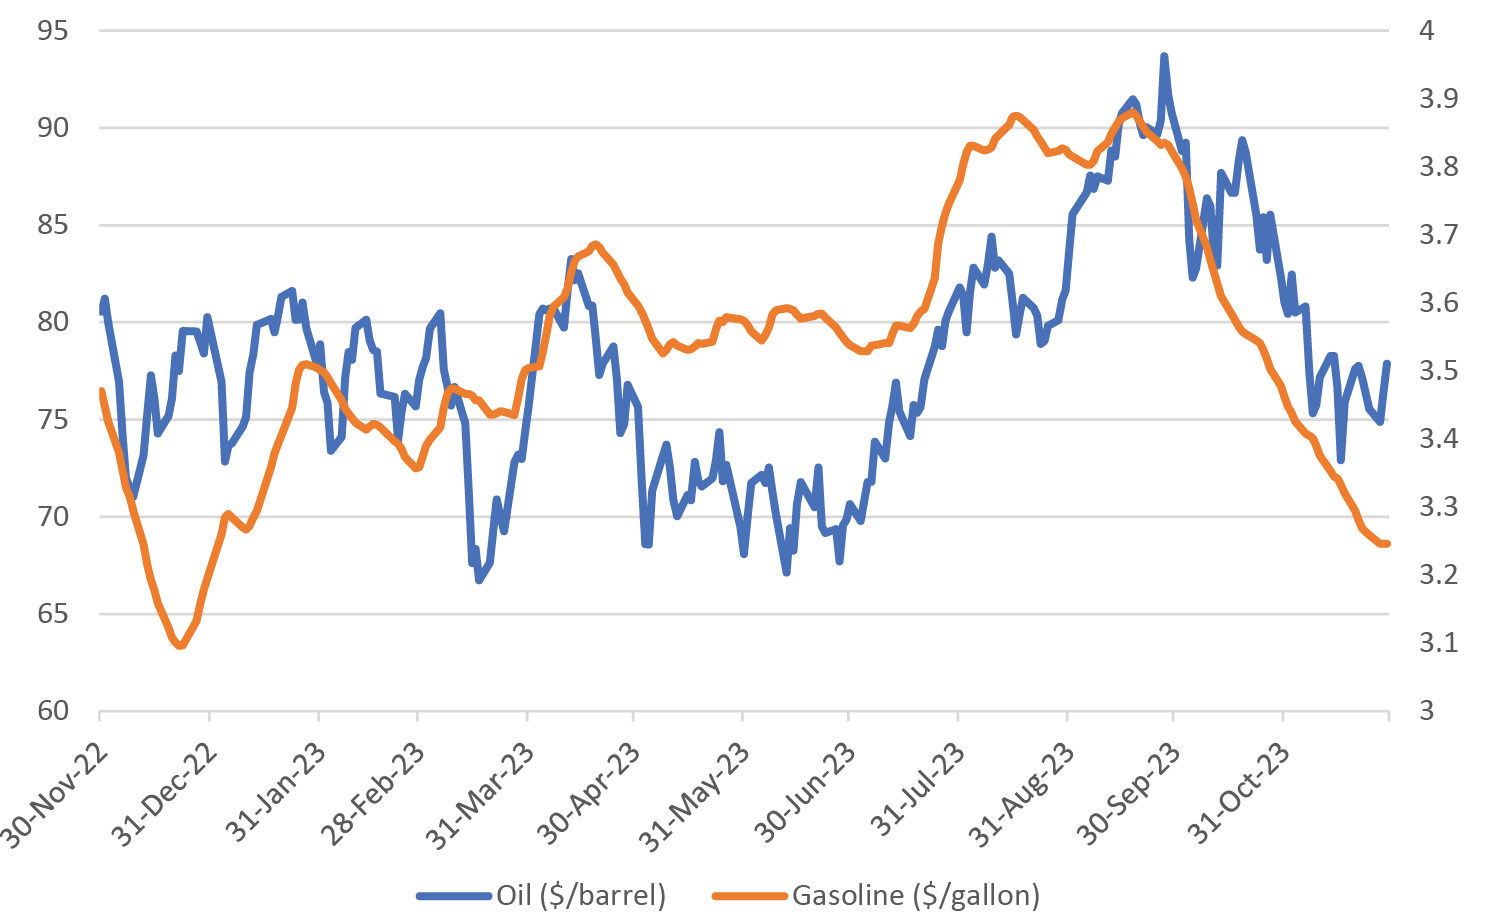
14 A corridor-like system for energy prices refers to a system of managing the US Strategic Petroleum Reserve in a manner designed to maintain an unofficial floor and ceiling to US oil prices. If oil prices rise too high, the US government releases oil from the reserve to increase supply. If prices drop too low, the government refills the reserve via purchases.
15 Go-anywhere strategies are typically benchmark-agnostic and not bound by limits on exposure by sector, quality, currency, or country. While traditional core-bond-plus strategies generally have flexibility to invest across the fixed-income landscape, they generally have upper limits on the amount that can be invested in securities that are rated below-investment-grade, domiciled outside the US, non-US-dollar-denominated, or classified within a particular sector (e.g., emerging markets).
16 Core/core plus strategies typically invest in a baseline of investment-grade bonds such as government, corporate, and securitized debt. Core-plus funds can take that baseline and add additional sectors such as corporate high-yield, emerging-market debt, or non-US currency exposures to enhance returns.
17 Convexity is a measure of the curvature, or the degree of the curve, in the relationship between bond prices and bond yields. If a bond's duration rises and yields fall, the bond is said to have positive convexity.
18 Securitized credit involves pooling a large number of loans into an investable asset. Examples include mortgage-backed or asset-backed securities.
19 High-yield (HY) securities, or "junk bonds," are rated below-investment-grade because there is a greater possibility that the issuer may be unable to make interest and principal payments on those securities.
20 Investment-grade (IG) securities are fixed-income securities that are rated at "BBB" or higher by Standard & Poor’s or Moody’s.
21 See footnote 19.
22 Emerging-market bonds (EMD) are debt instruments issued by developing countries. These bonds tend to offer higher yields than Treasuries or corporate bonds in the US. Emerging-market issues tend to carry higher risks than domestic debt instruments.
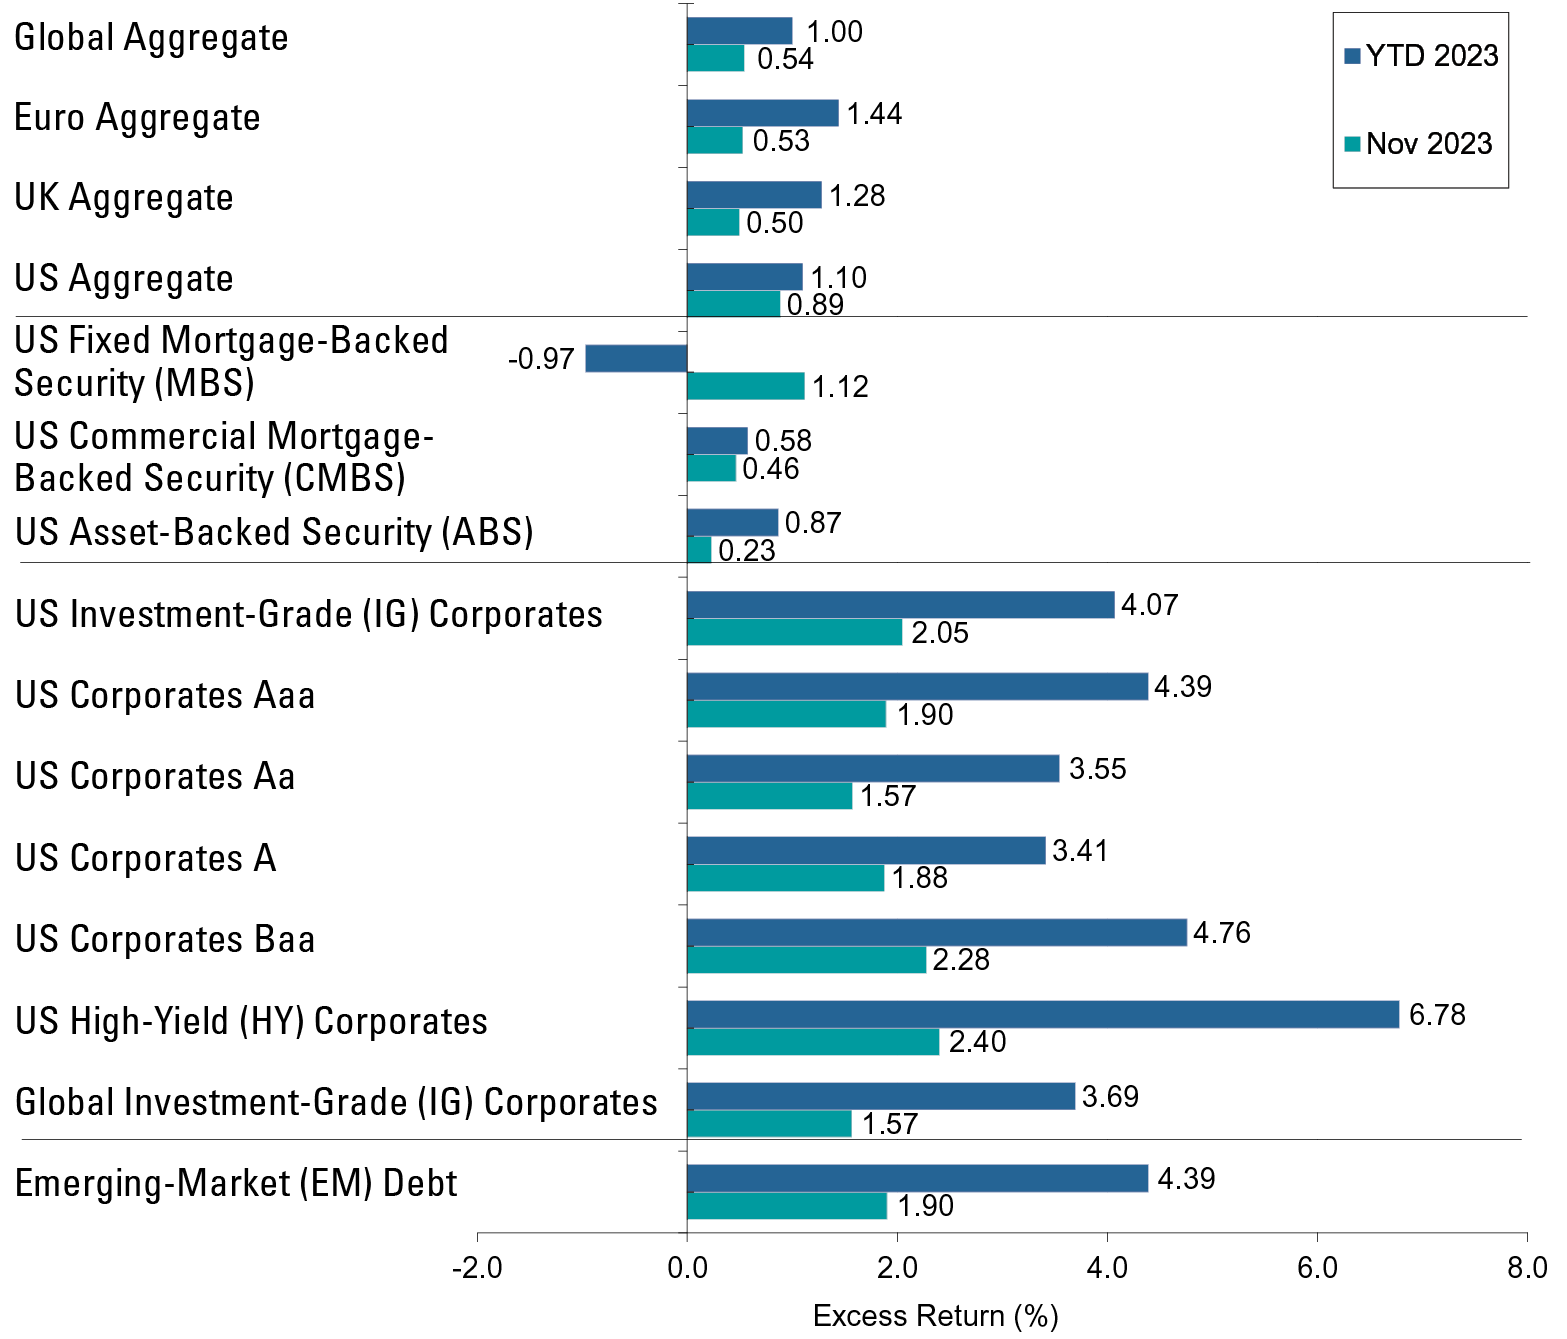
Global Aggregate is represented by the Bloomberg Global Aggregate Index, a broad-based measure of the global investment-grade fixed-rate debt markets. Euro Aggregate is represented by the Bloomberg Global Aggregate Index - European Euro, which includes fixed-rate, investment-grade Euro denominated bonds. UK Aggregate: Bloomberg Global Aggregate Index - United Kingdom which includes fixed-rate, investment-grade sterling-denominated bonds. US Aggregate: Bloomberg US Aggregate Bond Index is composed of securities from the Bloomberg Government/Credit Bond Index, Mortgage-Backed Securities Index, Asset-Backed Securities Index, and Commercial Mortgage-Backed Securities Index. US Fixed MBS: Bloomberg Agency Fixed-Rate MBS Index tracks fixed-rate agency mortgage backed passthrough securities guaranteed by Ginnie Mae (GNMA), Fannie Mae (FNMA), and Freddie Mac (FHLMC). US CMBS: Bloomberg CMBS ERISA Eligible Index, which measures the performance of investment-grade commercial mortgage-backed securities, which are classes of securities that represent interests in pools of commercial mortgages. The index includes only CMBS that are Employee Retirement Income Security Act of 1974. US ABS: Bloomberg Asset-Backed Securities Index, the ABS component of the Bloomberg US Aggregate Index, which has three subsectors: credit and charge cards, autos, and utility. US IG Corporates: Bloomberg US Corporate Bond Index covers all publicly issued, fixed rate, nonconvertible, investment-grade debt. US Corporates Aaa: Bloomberg Aaa Corporate Index designed to measure the performance of investment-grade corporate bonds that have a credit rating of Aaa; US Corporates Aa: Bloomberg Aa Corporate Index designed to measure the performance of investment-grade corporate bonds that have a credit rating of Aa; US Corporates A: Bloomberg A Corporate Index, designed to measure the performance of investment-grade corporate bonds that have a credit rating of A; US Corporates Baa: Bloomberg Baa Corporate Index; designed to measure the performance of investment-grade corporate bonds that have a credit rating of Baa; US High-Yield Corporates: Bloomberg US Corporate High Yield Index is an unmanaged broad-based market-value-weighted index that tracks the total return performance of non-investment grade, fixed-rate, publicly placed, dollar denominated and nonconvertible debt registered with the Securities and Exchange Commission. Global IG Corporates: Bloomberg Global Credit - Corporate Index is an unmanaged index considered representative of fixed rate, non-investment grade debt of companies in the US, developed markets, and emerging markets. Emerging-Markets Debt: Bloomberg Emerging Markets Hard Currency Index includes USD-denominated debt from sovereign, quasi-sovereign, and corporate EM issuers. Bank Loans: LSTA Leveraged Loan Index, which is a market-value-weighted index that is designed to measure the performance of the US leveraged loan market based upon market weightings, spreads, and interest payments. JP Morgan Emerging Markets Bond Index Global Index is a broad-based, unmanaged index which tracks total return for external currency denominated debt (Brady bonds, loans, Eurobonds and US dollar-denominated local market instruments) in emerging markets. Bloomberg US MBS Index tracks fixed-rate agency mortgage backed pass-through securities guaranteed by Ginnie Mae (GNMA), Fannie Mae (FNMA), and Freddie Mac (FHLMC)
Important Risks: Investing involves risk, including the possible loss of principal. • Fixed income security risks include credit, liquidity, call, duration, and interest-rate risk. As interest rates rise, bond prices generally fall. • Investments in high-yield (“junk”) bonds involve greater risk of price volatility, illiquidity, and default than higher-rated debt securities. • Mortgage-related and asset-backed securities’ risks include credit, interest-rate, prepayment, and extension risk. The value of the underlying real estate of real estate related securities may go down due to various factors, including but not limited to strength of the economy, amount of new construction, laws and regulations, costs of real estate, availability of mortgages, and changes in interest rates. • Loans can be difficult to value and less liquid than other types of debt instruments; they are also subject to nonpayment, collateral, bankruptcy, default, extension, prepayment and insolvency risks. • Foreign investments may be more volatile and less liquid than US investments and are subject to the risk of currency fluctuations and adverse political, economic and regulatory developments. These risks may be greater, and include additional risks, for investments in emerging markets.
The views expressed herein are those of Wellington Management, are for informational purposes only, and are subject to change based on prevailing market, economic, and other conditions. The views expressed may not reflect the opinions of Hartford Funds or any other sub-adviser to our funds. They should not be construed as research or investment advice nor should they be considered an offer or solicitation to buy or sell any security. This information is current at the time of writing and may not be reproduced or distributed in whole or in part, for any purpose, without the express written consent of Wellington Management or Hartford Funds.