
Pre-Sales Support
Mutual Funds and ETFs - 800-456-7526
Monday-Thursday: 8:00 a.m. – 6:00 p.m. ET
Friday: 8:00 a.m. – 5:00 p.m. ET
Post-Sales and Website Support
888-843-7824
Monday-Friday: 9:00 a.m. - 6:00 p.m. ET
For years, fixed income was seen as the steady anchor in portfolios—a reliable source of income and stability. But the last decade has challenged that narrative. Yields fell, forward returns disappointed investors, and many began to question whether bonds could still play their traditional role. Even now, as yields have rebounded, memories of leaner years linger, and the temptation to chase equity returns remains strong.
Yield to Worst in Long-Term Bond Trends
While market forecasts and interest-rate predictions often miss the mark, there’s one metric that has historically provided a useful measure: yield to worst (YTW).1 YTW reflects both the income a bond generates and the price changes that occur if it’s called or matures early, paying back at the bond's par value.2 The relationship between YTW and the returns earned over the next decade is remarkably strong (FIGURE 1). In fact, YTW explains most of the variation in long-term outcomes, with a correlation3 of about 0.90 between YTW and subsequent 10-year returns.
FIGURE 1
Bond Yields Suggest Potentially Attractive Forward Returns
Bloomberg US Aggregate Bond Index Yield to Worst and Rolling 10-Year Returns
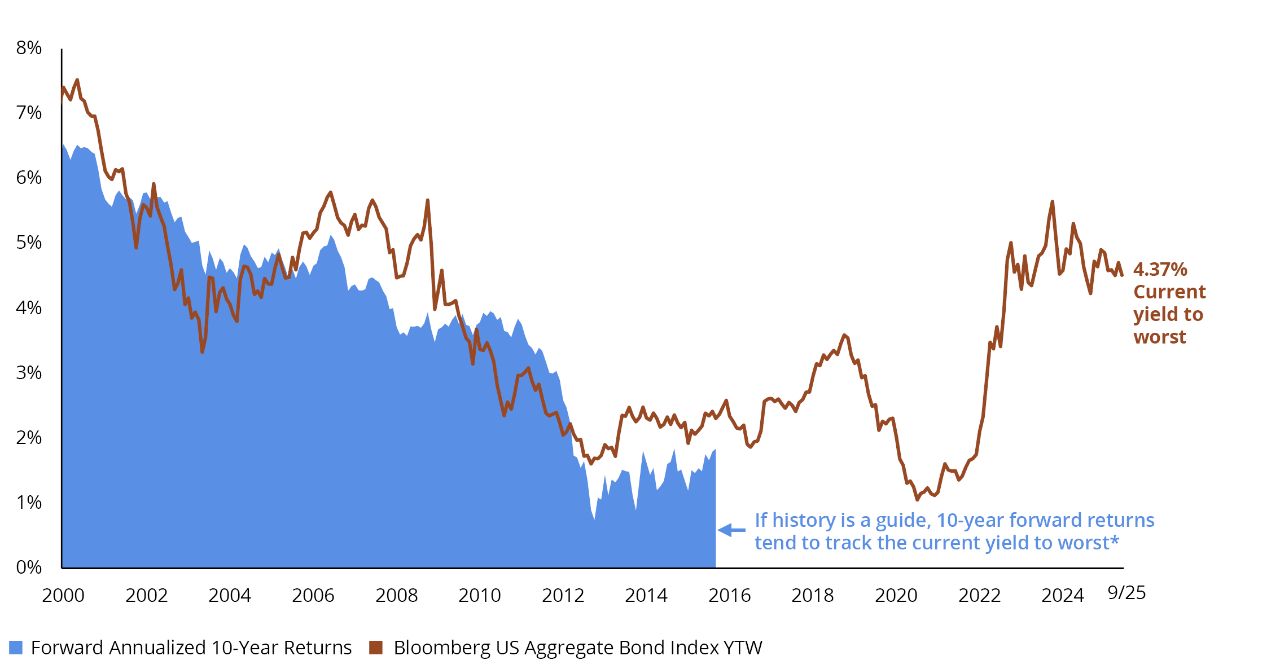
Chart Data: 1/1/00-9/30/25. Past performance does not guarantee future results. * 10-year forward returns show the average annual return from investing at a given yield and holding for 10 years. For example, the final return in the chart reflects investing at the yield to worst on 9/30/05 and holding through 9/30/15. This highlights how past yields, especially yield to worst, have aligned with long-term returns. Please see below for index definition. Data Sources: Bloomberg, Morningstar, and Hartford Funds, 10/25.
Today, the Bloomberg US Aggregate Bond Index's YTW sits at 4.37%, a level that’s well above the lows of the past few years and suggests a more favorable outlook for bond investors. Historically, YTW in this range has led to average forward 10-year returns of about 4.60% annualized.4 However, it’s important to remember that while yield is a powerful factor for long-term expectations, it’s not a guarantee. Volatility, rate shifts, and changing market dynamics can all influence outcomes along the way.
Building Perspective for Today’s Bond Investors
Amid shifting market conditions, fundamentals such as yield have become increasingly important for shaping fixed-income expectations. When yields are higher, the long-term outlook for fixed income has historically improved. Understanding this connection between YTW and future return potential can help frame expectations and support more resilient portfolio construction, especially in an environment in which volatility and uncertainty remain elevated.
To learn more about managing fixed-income risk, please talk to your financial professional.
Bloomberg US Aggregate Bond Index is composed of securities that cover the US investment-grade fixed-rate bond market, with index components for government and corporate securities, mortgage pass-through securities, and asset-backed securities.
1 Yield to worst (YTW) is the minimum yield that can be received on a bond assuming the issuer doesn’t default on any of its payments.
2 Par value is the price at which a bond was issued, also known as its face value. Par value is static, unlike market value, which fluctuates with credit ratings, time to maturity, and interest-rate fluctuations.
3 Correlation is a statistical measure of how two investments move in relation to each other. A correlation of 1.0 indicates the investments have historically moved in the same direction; a correlation of -1.0 means the investments have historically moved in opposite directions; and a correlation of 0 indicates no historical relationship in the movement of the investments.
4 For this analysis, “range” is defined as yields within 25 basis points above or below a 4.5% YTW. A basis point is a unit that is equal to 1/100th of 1% and is used to denote the change in a financial instrument. The basis point is commonly used for calculating changes in interest rates, equity indices, and the yield of a fixed-income security.
Important Risks: Investing involves risk, including the possible loss of principal. • Fixed income security risks include credit, liquidity, call, duration, and interest-rate risk. As interest rates rise, bond prices generally fall. • Diversification does not ensure a profit or protect against a loss in declining market.
This information should not be considered investment advice or a recommendation to buy/sell any security. In addition, it does not take into account the specific investment objectives, tax and financial condition of any specific person. This information has been prepared from sources believed reliable, but the accuracy and completeness of the information cannot be guaranteed. This material and/or its contents are current at the time of writing and are subject to change without notice.


