• Products
  • Insights
  • Practice Management
  • Resources
  • About Us

Market Outlook

The Federal Reserve (Fed) appears increasingly likely to cut rates faster and more dramatically than markets previously anticipated. But this isn’t your typical rate-cutting cycle. Today’s setup offers a rare mix: elevated long rates and meaningful rolldown potential (the potential price gain from a bond’s price moving toward its face value as it approaches maturity). Meanwhile, the fiscal backdrop may be transitioning from a period of uncertainty to one that supports growth.


Why Short Duration Now?

Our outlook favors a so-called bull steepener—in which short-term rates rally while longer-term rates either remain where they are or move higher due to inflation, fiscal deficits, and questions around Fed independence. 

We believe this environment is particularly favorable for short-duration strategies, especially since markets are in transition, and volatility is likely. We see two potential paths:

Scenario 1: The front end of the curve rallies, boosting price appreciation and enhancing total returns. Investors can benefit by continuing to earn income as yields move lower.

Scenario 2: Inflation remains sticky, the market backdrop becomes more growth-supported, and longer-term yields remain where they are or drift higher. In this case, short duration may still offer compelling income while limiting exposure to longer-maturity risk.


What Sets the Hartford Short Duration Fund Apart?

Both scenarios could be constructive for the Hartford Short Duration Fund. With a current SEC yield2 of 4.48% (I share as of 6/30/25), an average duration of 1.99 years, and the potential for capital appreciation, we believe the Fund is well-positioned for shifting markets.

The Hartford Short Duration Fund seeks to help investors capture income in a variety of market environments while managing interest-rate sensitivity by seeking to offer:

  • Diversified exposure: The Fund makes use of a broad opportunity set, including Treasuries, agency mortgages, investment-grade corporates, and securitized credit (non-agency residential mortgage-backed securities, commercial mortgage-backed securities, and asset-backed securities), as well as high-yield bonds and bank loans for additional income potential.  

  • Active management: The Fund can actively rotate through these sectors based on relative value to select potentially attractive individual bonds as opportunities arise.

  • A focus on quality credit: Primarily invested in investment-grade holdings, the Fund’s team fundamentally believes that income is the most consistent form of return. As such, the Fund seeks differentiated sources of income that help provide diversification to help buffer market volatility.
     

Hartford Short Duration Has Offered Strong Returns With Less Volatility 
Three-year Annualized Returns vs. Volatility

As of 7/1/22-6/30/25. Past performance does not guarantee future results. Investors cannot directly invest in indices. Based on Bloomberg sector indices vs. the Hartford Short Duration Fund I. Standard deviation measures the spread of the data about the mean value and is a measure of the portfolio’s total-return volatility over the last three years. A higher standard deviation indicates greater historical volatility. See below for representative indices. Source: Morningstar, 9/25. 


Final Thoughts

With elevated starting yields, a supportive rate environment, and a strategy designed for flexibility, the Hartford Short Duration Fund may offer a compelling way for investors to pursue income and total return. Backed by Wellington’s collaborative investment model and dedicated sector expertise, the strategy may be helpful today as investors try to position themselves for attractive returns despite a dynamic market environment.


PERFORMANCE %
 
CUMULATIVE %
(as of 8/31/2025)
AVERAGE ANNUAL TOTAL RETURNS %
(as of 8/31/2025)
1 MONTH QTD YTD 1YR 3YR 5YR 10YR SI
Hartford Short Duration I 1.01 1.19 4.77 6.08 5.83 2.90 2.92 2.91
Benchmark 0.88 0.86 3.80 4.64 4.14 1.71 1.93 ---
Morningstar Short-Term Bond Category 0.96 --- 4.37 5.24 4.91 2.17 2.34 ---
 
CUMULATIVE %
(as of 6/30/2025)
AVERAGE ANNUAL TOTAL RETURNS %
(as of 6/30/2025)
1 MONTH QTD YTD 1YR 3YR 5YR 10YR SI
Hartford Short Duration I 0.90 1.88 3.54 7.05 5.71 2.95 2.78 2.88
Benchmark 0.64 1.27 2.92 5.94 3.75 1.58 1.84 ---
Morningstar Category 0.86 --- 3.30 6.47 4.62 2.17 2.22 ---

Performance data quoted represents past performance and does not guarantee future results. The investment return and principal value of an investment will fluctuate so that an investor's shares, when redeemed, may be worth more or less than their original cost. Current performance may be lower or higher than the performance data quoted.

SI = Since Inception. Fund Inception: 10/31/2002

Share Class Inception: 2/26/10.
Class I-share performance prior to its inception date reflects Class A-share performance (excluding sales charges) and operating expenses. SI performance is calculated from 10/31/02.

Total Operating Expenses: 0.50%

30-Day SEC Yield (Class I) 4.48% Unsubsidized 30-Day SEC Yield (Class I) 4.48%

To learn more about the Hartford Short Duration Fund, please talk to your financial professional.

1 Duration is a measure of the sensitivity of an investment’s price to nominal interest-rate movement.
2
SEC yield reflects the hypothetical net current income earned, after the deduction of a fund’s expenses, during a 30-day period, expressed as an annual percentage rate based on the fund’s share price at the end of the period. 
3 Expenses are the total annual operating expenses from the Fund’s most recent prospectus at the time of publication.

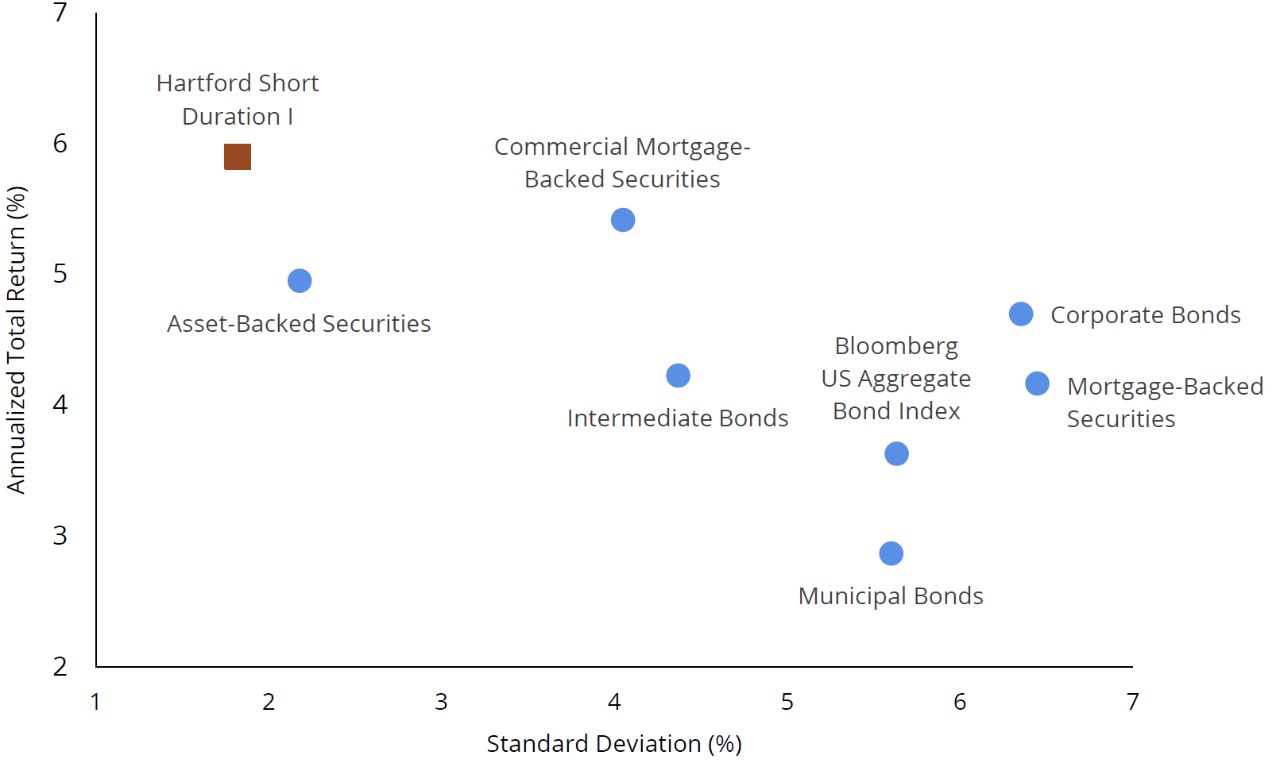
Asset-Backed Securities are represented by the Bloomberg US ABS Index, a broad-based flagship benchmark that measures the investment grade, US dollar-denominated, fixed-rate taxable bond market.
Bloomberg US Aggregate Bond Index is composed of securities from the Bloomberg Government/Credit Bond Index, Mortgage-Backed Securities Index, Asset-Backed Securities Index, and Commercial Mortgage-Backed Securities Index. 
Commercial Mortgage-Backed Securities are represented by the Bloomberg Global  Aggregate US CMBS Index, a component of the Bloomberg U.S. Aggregate Bond Index that includes commercial mortgage-backed securities.
Corporate Bonds are represented by the Bloomberg US Corporate Bond Index, which covers all publicly issued, fixed rate, nonconvertible, investment grade debt.
Intermediate Bonds are represented by the Bloomberg US Aggregate Intermediate Index, an unmanaged index reflecting performance of the intermediate-term government bond market.
Mortgage-Backed Securities are represented by the Bloomberg US Agency Fixed Rate MBS Index, which measures the performance of investment grade fixed-rate mortgage-backed pass-through securities of GNMA, FNMA, and FHLMC.
Municipal Bonds are represented by the Bloomberg Municipal Index, which is designed to cover the USD-denominated long-term tax exempt bond market.

Important Risks: Investing involves risk, including the possible loss of principal. Security prices fluctuate in value depending on general market and economic conditions and the prospects of individual companies. • Fixed income security risks include credit, liquidity, call, duration, event and interest-rate risk. As interest rates rise, bond prices generally fall. • Loans can be difficult to value and less liquid than other types of debt instruments; they are also subject to nonpayment, collateral, bankruptcy, default, extension, prepayment and insolvency risks. • The risks associated with mortgage-related and asset-backed securities as well as collateralized loan obligations (CLOs) include credit, interest-rate, prepayment, liquidity, default and extension risk. • Investments in high-yield (“junk”) bonds involve greater risk of price volatility, illiquidity, and default than higher-rated debt securities. • Derivatives are generally more volatile and sensitive to changes in market or economic conditions than other securities; their risks include currency, leverage, liquidity, index, pricing, valuation, and counterparty risk. • Foreign investments may be more volatile and less liquid than U.S. investments and are subject to the risk of currency fluctuations and adverse political, economic and regulatory developments. • Restricted securities may be more difficult to sell and price than other securities. • Obligations of U.S. Government agencies are supported by varying degrees of credit but are generally not backed by the full faith and credit of the U.S. Government. • The portfolio managers may allocate a portion of the Fund’s assets to specialist portfolio managers, which may not work as intended.

Diversification does not ensure a profit or protect against a loss in a declining market.


WP867 4863275
Insight from sub-adviser Wellington Management
Author Headshot
Portfolio Manager for Hartford Short Duration Fund and Senior Managing Director