• Products
  • Insights
  • Practice Management
  • Resources
  • About Us

After a rapid series of rate hikes in 2022 and 2023 aimed at cooling inflation, more conservative investments such as cash became increasingly attractive. Once inflation eased from its earlier highs, the Federal Reserve (Fed) shifted course, cutting rates through 2025 to support economic growth. With uncertainty now persisting around both inflation and growth, policy has moved into a less predictable cadence, settling into a more measured, pause-driven phase.

Pauses of this kind aren’t unusual. Since 1990, there have been 13 instances in which the Fed went 100 days or more between rate cuts, with the median stretch running about 330 days. That places the current environment within a pattern investors have seen before, even if this cycle reflects its own set of underlying conditions.

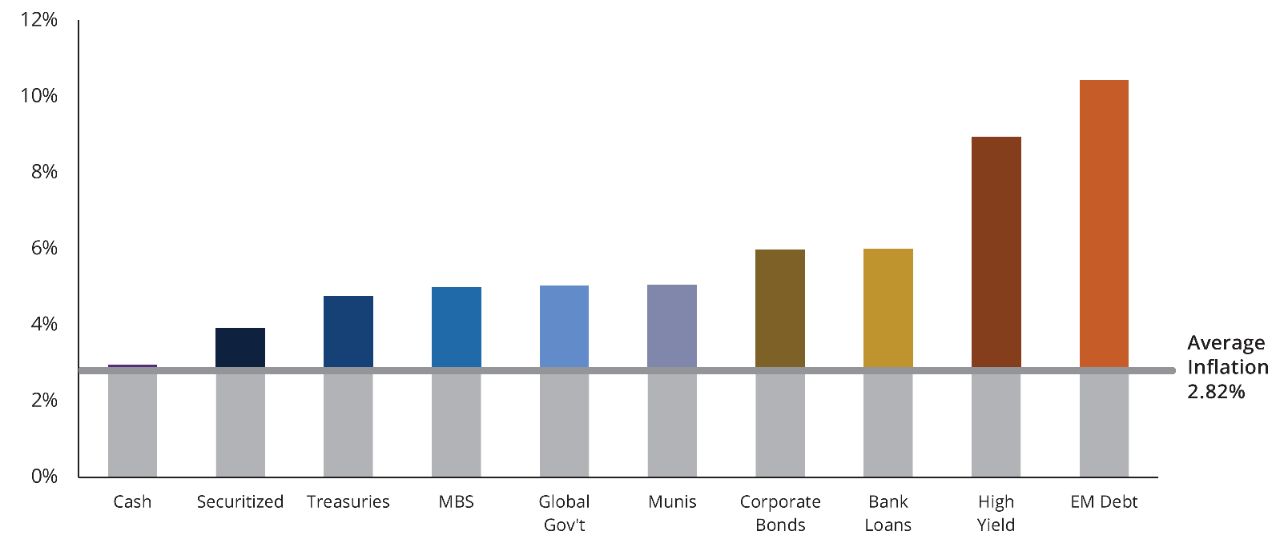
History has shown that the five years following a pause in rate cuts have produced a wide range of outcomes across fixed-income sectors (FIGURE 1), with most outpacing inflation over that period.

That dispersion of returns becomes even more apparent when viewed alongside cash. While previous rate hikes lifted short-term yields, cash has historically landed toward the lower end of outcomes once the Fed stops cutting. And real returns, or returns after taking inflation into account, make cash look even worse.

FIGURE 1

During Extended Fed Rate Pauses, Cash Has Historically Lagged Behind
Average Returns 5 Years After First Fed Rate Cut Following 100+ Day Break in Rate Cuts

Chart Data: 7/90-3/26. Past performance does not guarantee future results. Indices are unmanaged and not available for direct investment. Data shown reflects the 5-year average returns for periods that followed a 100+ day pause between rate cut cycles, observed on 10/29/90, 4/9/92, 7/6/95, 12/19/95, 9/29/98, 1/3/01, 11/6/02, 6/25/03, 9/18/07, 10/8/08, 8/1/19, and 3/4/20. The current rate-cutting cycle, which began in September 2024, is excluded. Please see below for representative index definitions. For illustrative purposes only. Data Sources: FRED, Morningstar, FactSet, and Hartford Funds, 4/26.


While real returns on cash have historically remained limited after Fed pauses, shifting rate cycles have led to opportunities across fixed income. Leadership in asset‑class performance has often moved beyond short-term instruments, with duration1 and credit playing a larger role—leaving cash more likely to fall behind.

No two rate cycles unfold against the same backdrop, and the pauses between policy moves can reflect very different underlying conditions. With policy direction still in flux and other macro drivers continuing to exert influence, today’s environment doesn’t lend itself to a single, static approach. Against that backdrop, the ability to adapt and reallocate as conditions evolve may prove just as important as the starting point.


To learn more about managing fixed-income risk, please talk to your financial professional.

1 Duration is a measure of the sensitivity of an investment’s price to nominal interest-rate movement.

Bank Loans: Morningstar LSTA US Leveraged Loan Index is a market-value-weighted index that is designed to measure the performance of the US leveraged loan market based upon market weightings, spreads and interest payments.

Cash: Bloomberg US Treasury Bill 1-3 Month Index measures the performance of public obligations of the US Treasury that have a remaining maturity of 1-3 months.

Corporate Bonds: Bloomberg US Corporate Bond Index measures the investment grade, fixed-rate, taxable corporate bond market.

EM or Emerging Markets Debt: Bloomberg Emerging Markets Aggregate Bond Index measures USD-denominated debt from sovereign, quasi-sovereign, and corporate emerging-market issuers.

Global Gov’t: Bloomberg Global Government Index refers to a category of indices tracking various segments of the global government debt market.

High Yield: Bloomberg US Corporate High Yield Bond Index is an unmanaged broad-based market-value-weighted index that tracks the total-return performance of non-investment grade, fixed-rate, publicly placed, dollar-denominated and nonconvertible debt registered with the Securities and Exchange Commission.

MBS or Mortgage-Backed Securities: Bloomberg US MBS Index tracks fixed-rate agency mortgage backed pass-through securities guaranteed by Ginnie Mae, Fannie Mae, and Freddie Mac.

Munis or Municipal Bonds: Bloomberg Municipal Bond Index is designed to cover the USD-denominated long-term tax-exempt bond market.

Securitized: Bloomberg US Securitized Index is a market-value-weighted index that tracks the performance of investment-grade, US-dollar denominated securitized debt, including agency mortgage-backed securities (MBS), asset-backed securities (ABS), and commercial mortgage-backed securities (CMBS).

Treasuries: Bloomberg US Treasury Index measures US dollar-denominated, fixed-rate, nominal debt issued by the US Treasury.

Important Risks: Investing involves risk, including the possible loss of principal. • Fixed income security risks include credit, liquidity, call, duration, and interest-rate risk. As interest rates rise, bond prices generally fall.

This information should not be considered investment advice or a recommendation to buy/sell any security. In addition, it does not take into account the specific investment objectives, tax and financial condition of any specific person. This information has been prepared from sources believed reliable, but the accuracy and completeness of the information cannot be guaranteed.


WP902 5509643
Insight from Hartford Funds
Author Headshot