• Products
  • Insights
  • Practice Management
  • Resources
  • About Us

For the first time since 2007, investors are finally getting an attractive interest rate on their cash holdings. With a little searching, you can find money-market funds and one-year CDs that pay 5% or more. Loading up on cash may seem like a good strategy, but like your favorite dessert, is there a downside to having too much of a good thing? 

Here are three reasons why investors should be careful about holding too much cash:

  1. Cash has usually delivered negative returns after inflation and taxes
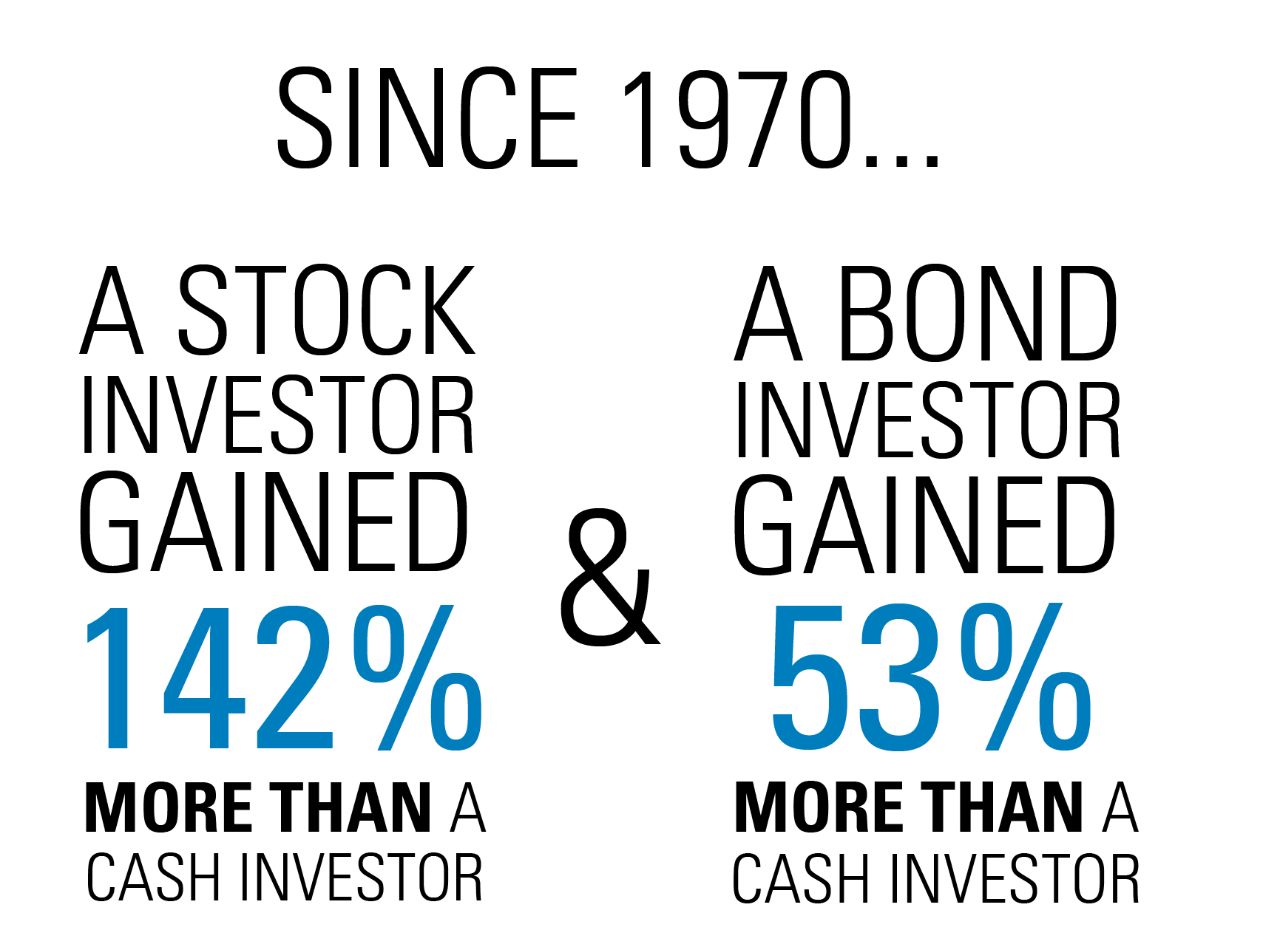
  2. Cash hasn’t historically helped investors grow their wealth
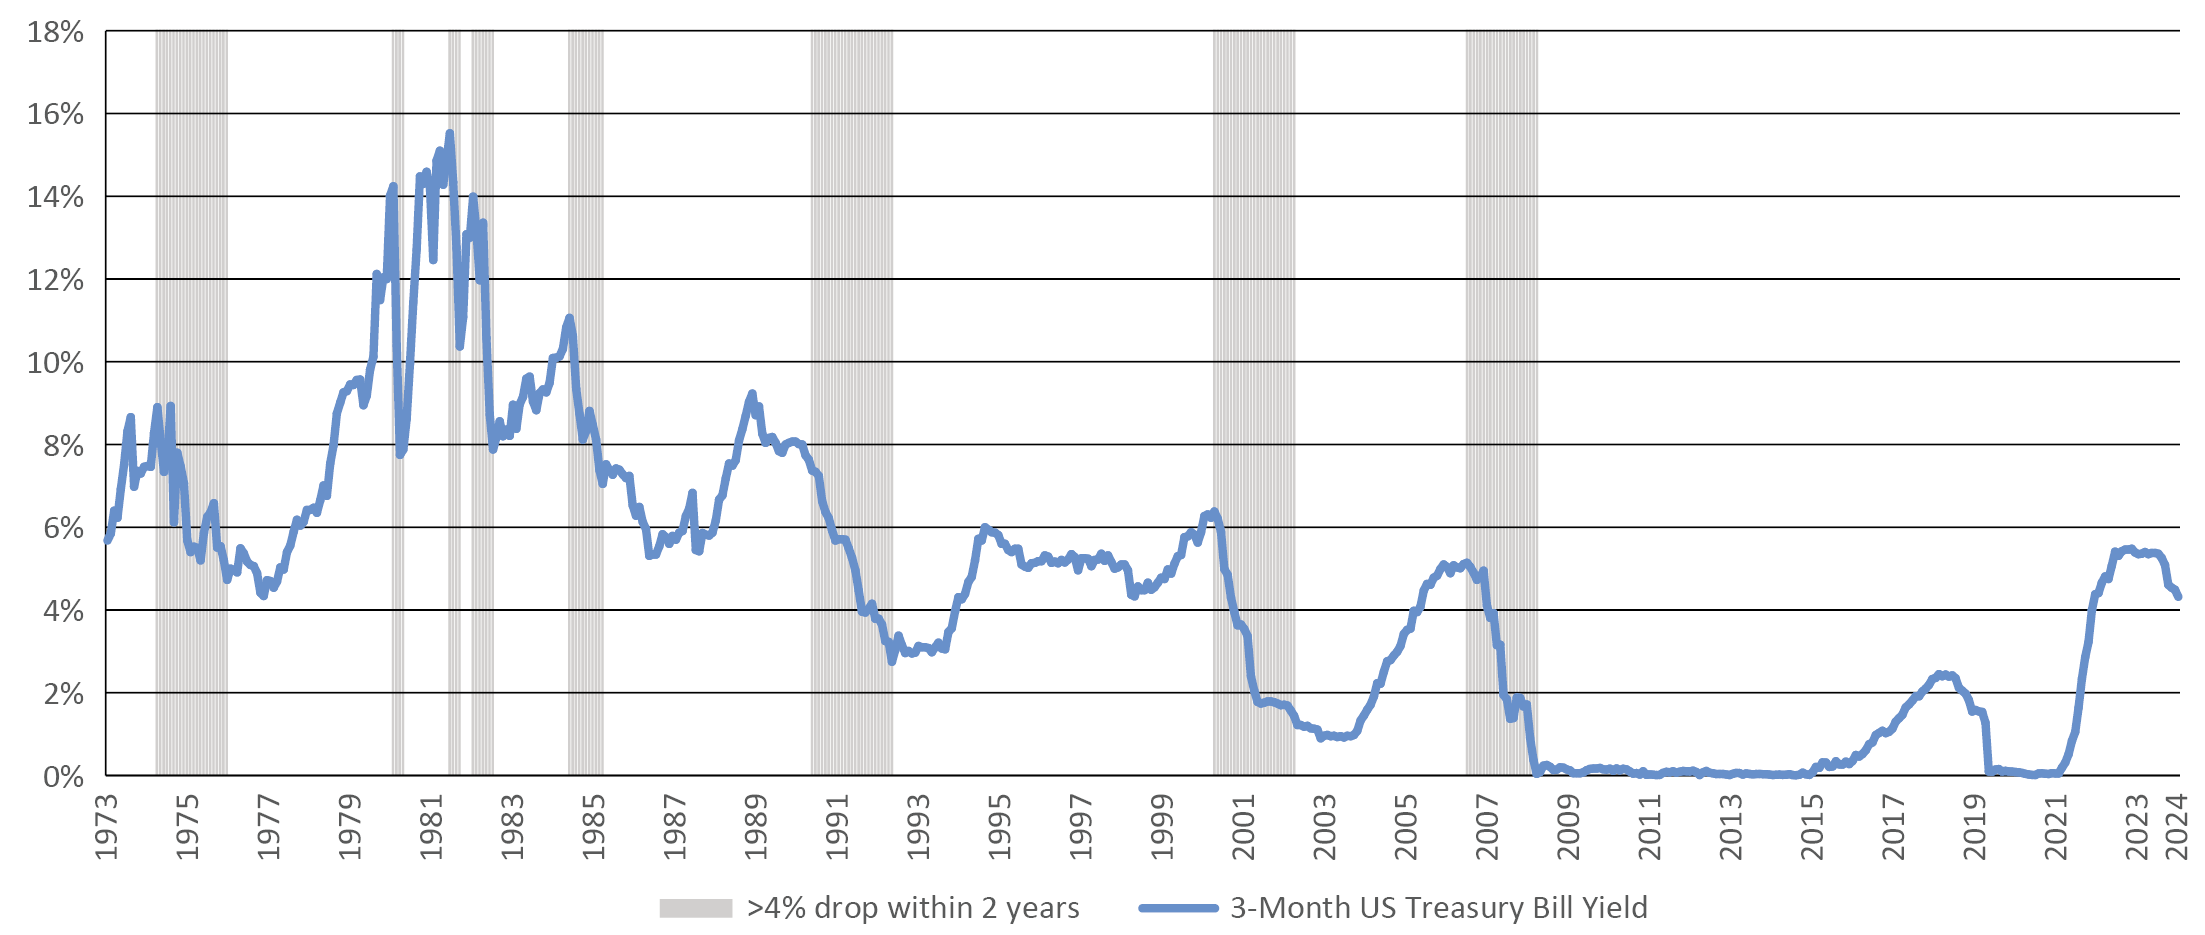
  3. Today’s attractive interest rates may not be available tomorrow


1. Cash Has Usually Delivered Negative Returns After Inflation and Taxes

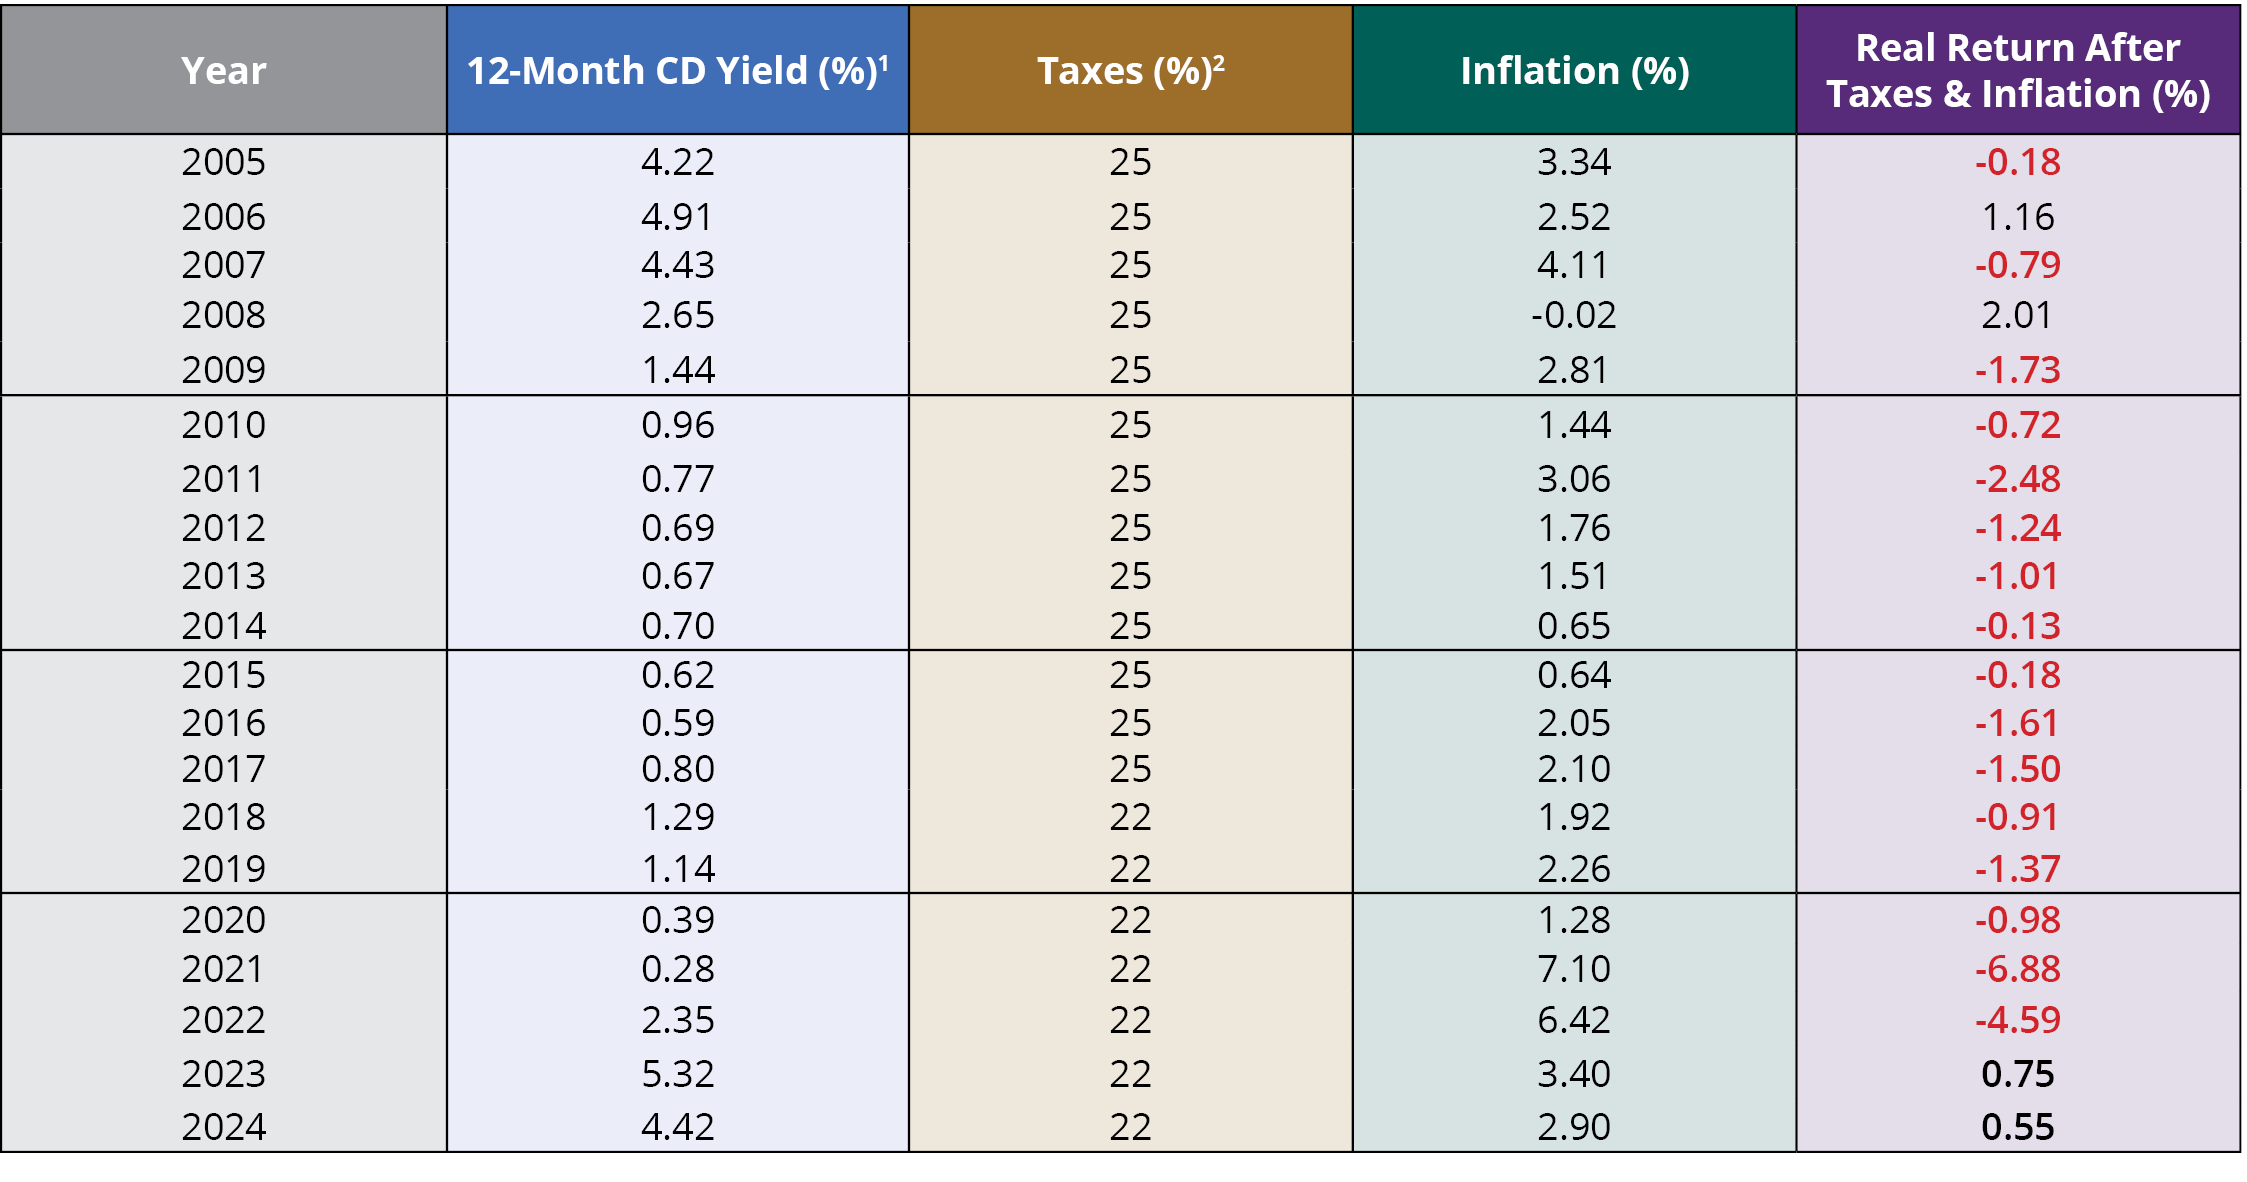
Cash has a key role in every portfolio. Everyone needs cash on hand for recurring expenses such as mortgage payments, college tuition, and credit-card bills. It’s also prudent to have an emergency fund because life is unpredictable. But it’s important for investors to realize that cash investments such as CDs typically don’t generate a positive return after factoring in taxes and inflation (FIGURE 1). Even with a historically generous 12-month CD rate of 5.32%, the after-tax real return (i.e., the return after factoring in inflation and taxes) is still less than 1%. 

FIGURE 1

Inflation and Taxes Have Had a Significantly Negative Effect on CD Returns
Real Return on 12-month CDs (2004-2023)

Inflation and Taxes Have Had a Significantly Negative Effect on CD Return Rates

Past performance does not guarantee future results. CD rates are proxied by Bankrate’s 12-month CD national average; the CD rate for 2023 is the average of the 12-month CD rates offered on Bankrate. CDs are short-term investments that pay fixed principal and interest, are insured by the FDIC up to $250,000, and are subject to changing renewal rates and early withdrawal penalties. The chart uses the highest marginal federal income tax rate based on $100,000 of taxable income for a married couple filing jointly for each calendar year. The tax rate is not representative of the experience of every investor. A lower tax rate would have a favorable effect on the real return. Data Sources: Bloomberg, FactSet, and Hartford Funds, 1/24.


Holding too much cash could cause you to miss out on significant gains.  


2. Cash Hasn’t Historically Helped Investors Grow Their Wealth

One of the most fundamental decisions we make as investors is how much money to allocate among stocks, bonds, and cash. Cash is certainly safer than stocks or bonds in terms of daily volatility. The tradeoff for that feeling of safety, however, is much less long-term growth potential. Cash is the proverbial parking spot for your money, but it probably won’t help you get where you want to go over the long term—and holding too much of it could cause you to miss out on significant gains. 

FIGURE 2

Stocks and Bonds Created Significantly More Wealth Than Cash Over Most Decades

Average Annual Returns for Stocks, Bonds, and Cash by Decade 

Decade
Avg. Stock 
Return (%) 
Avg. Bond
Return (%) 
Avg. Cash
Return (%
1970s 5.90 7.00  6.30
1980s 17.60 12.40 8.90
1990s 18.20  7.70  4.90
2000s -1.00 6.30 2.80
2010s 13.60  3.80  0.50
2020s 12.04 -0.72  1.70
Return from
1/1/70-12/31/23 
 10.70  6.77 4.42

Growth of $10,000 for Stocks, Bonds, and Cash From the Beginning to the End of Each Decade 

Decade
Stocks 
Bonds  Cash
1970s $17,685 
 $19,607  $18,438
1980s $50,384 
$32,266  $23,433 
1990s $53,278 
$20,991  $16,171 
2000s $9,090 
$18,475  $13,125 
2010s $35,666 
$14,445  $10,536 
2020s* $15,759
$9,717  $10,698 
Growth of $10,000
1/1/70-12/31/23 

$2,425,538  $344,363  $103,346 

*Through 12/31/23. Past performance does not guarantee future results. Indices are unmanaged and not available for direct investment. Please below for representative indices. Data source for charts and infographic: Morningstar, 1/24. 


3. Today’s Attractive Interest Rates May Not Be Available Tomorrow 

While earning 5% interest on your cash is extremely attractive, history shows that this generous interest rate may not last. In fact, over the last 50 years there have been eight times when yields on cash fell by 4% or more over periods ranging from three months to two years (FIGURE 3). The reinvestment risk for cash and short-term CDs is one of the biggest risks investors face today. 


FIGURE 3

Cash Can Be Volatile: Yield Drops of 4% or More Within Two Years or Less
3-Month US Treasury Bill Yield % (1/73–12/31/23)

3-Month US Treasury Bill Yield % - 1/73-8/23
 
Date Range Beginning Yield Ending Yield Total Yield Drop
4/74-1/76 8.90 4.73 4.17%
3/80-6/80 14.24 7.88 6.36%
8/81-11/81 15.52 10.37 5.15%
3/82-9/82 13.99 7.88 6.11%
8/84-6/85 11.06 7.05 4.01%
9/90-9/92 7.37 2.75 4.62%
10/00-10/02 6.38 1.44 4.94%
2/07-11/08 5.14 0.04 5.10%
  Average Yield Drop 5.06%

Data Source: Factset, 1/24.

The Risk of Owning Stocks and Bonds vs. Cash

As with any investment, there are relative risks to be considered. Cash, CDs, and money-market funds generally involve the least amount of risk but also offer the least potential return. 

Stocks can be volatile, especially over short periods of time. Companies could fail to execute their business plans or lose value due to increased competition. Stock investors could lose part or all of their principal. 

Bonds tend to carry greater risk than cash equivalents, including the risk that a bond’s lender may be unable to make interest or principal payments on time. Bonds with longer maturities (e.g., 10 years or more) can offer higher returns but can lose value when interest rates rise. Bonds are also subject to the risk that the lender may choose to pay off the bond early, which could deprive investors of potential interest income. When rates are falling, lenders sometimes choose to pay off bonds ahead of maturity in order to reissue bonds at lower prevailing rates.


Takeaways

The amount you allocate to stocks, bonds, and cash can be a major factor in your portfolio’s long-term performance, so choose wisely. If you allocate too much to cash, you may not generate high enough returns to fund your retirement or other investment goals. But if you allocate too little to cash, you may have to sell some stocks or bonds at an unfavorable time to pay for an emergency. Your financial professional can take a holistic view of your finances and help you decide how much to allocate among stocks, bonds, and cash.

If you believe yields on cash, CDs, and money markets could fall in the not-too-distant future, consider buying intermediate-term bonds or CDs that mature further out. Your financial professional can help you create a bond or CD ladder1 so your money comes due and is reinvested at different times, which helps reduce reinvestment risk. You could also consider purchasing an actively managed intermediate-term bond fund or ETF to let professional money managers decide how to navigate changing interest rates.


Talk to your financial professional to help you decide the amount of cash holdings that are right for you.


1 When you create a bond or CD ladder, you divide the total amount of money you want to invest into equal amounts and invest those amounts in bonds or CDs with different maturity dates.

Bonds are represented by the IA SBBI LT Government Index, which measures the performance of a single issue of outstanding US Treasury notes with a maturity term of around 5.5 years. Cash is represented by IA SBBI US 30 Day T-Bill Index, which tracks 30-day Treasury bills. CD rates are based on 3-Month CD rates from the Federal Reserve Bank of St. Louis. Data begins June 1964. 
Stocks are represented by the S&P 500 Index, which is a market capitalization-weighted price index composed of 500 widely held common stocks, using data calculated by Ibbotson Associates.

Important Risks: Investing involves risk, including the possible loss of principal. • Fixed-income security risks include credit, liquidity, call, duration, and interest-rate risk. As interest rates rise, bond prices generally fall.

WP772 3351955

The material on this site is for informational and educational purposes only. The material should not be considered tax or legal advice and is not to be relied on as a forecast. The material is also not a recommendation or advice regarding any particular security, strategy or product. Hartford Funds does not represent that any products or strategies discussed are appropriate for any particular investor so investors should seek their own professional advice before investing. Hartford Funds does not serve as a fiduciary. Content is current as of the publication date or date indicated, and may be superseded by subsequent market and economic conditions.

Investing involves risk, including the possible loss of principal. Investors should carefully consider a fund's investment objectives, risks, charges and expenses. This and other important information is contained in the mutual fund, or ETF summary prospectus and/or prospectus, which can be obtained from a financial professional and should be read carefully before investing.

Mutual funds are distributed by Hartford Funds Distributors, LLC (HFD), Member FINRA|SIPC. ETFs are distributed by ALPS Distributors, Inc. (ALPS). Advisory services may be provided by Hartford Funds Management Company, LLC (HFMC) or its wholly owned subsidiary, Lattice Strategies LLC (Lattice). Certain funds are sub-advised by Wellington Management Company LLP and/or Schroder Investment Management North America Inc (SIMNA). Schroder Investment Management North America Ltd. (SIMNA Ltd) serves as a secondary sub-adviser to certain funds. HFMC, Lattice, Wellington Management, SIMNA, and SIMNA Ltd. are all SEC registered investment advisers. Hartford Funds refers to HFD, Lattice, and HFMC, which are not affiliated with any sub-adviser or ALPS. The funds and other products referred to on this Site may be offered and sold only to persons in the United States and its territories.

© Copyright 2024 Hartford Funds Management Group, Inc. All Rights Reserved. Not FDIC Insured | No Bank Guarantee | May Lose Value