• Products
  • Insights
  • Practice Management
  • Resources
  • About Us

The US dollar (USD) plays a central role in shaping investment outcomes. Its movements influence the availability of capital worldwide, drive cross-border investment flows, and shape relative asset performance. For investors, these shifts matter. A stronger dollar can tighten global financial conditions, pressure emerging markets (EMs), and weigh on US multinationals by diminishing the dollar value of sales made abroad. A weaker dollar often does the reverse, easing financial conditions and supporting returns for non-US assets when converted back into dollars.

Recent history highlights these dynamics: The dollar surged in the wake of COVID-19, reached a two-decade high in 2022 amid aggressive Federal Reserve (Fed) tightening, and has since moderated. These episodes highlight a consistent theme: dollar moves rarely occur in isolation. They are intertwined with shifts in monetary policy, global growth, and risk sentiment—factors that reverberate across asset classes. Understanding these cycles, and their implications for asset behavior, remains essential for navigating global markets.


Milestones That Shaped the Dollar’s Global Role

The USD’s journey over the past five decades has been marked by dramatic turning points when policy shifts, global crises, or coordinated interventions reshaped the currency’s role in world markets (FIGURE 1). Major shifts in the dollar’s trajectory have historically coincided with changes in global liquidity and risk appetite, leaving their mark on asset-class performance. This context helps explain why certain periods favored US assets, pressured EMs, or altered the risk profile of bonds and commodities—and why the patterns established by these events continue to shape how markets respond to currency movements today.


FIGURE 1

Key Events Driving US Dollar Trends
US Dollar Index Value

  • 1973 – End of Bretton Woods: Floating exchange rates introduced lasting currency volatility and risk.
  • 1985 – Plaza Accord: G5 action reversed USD strength, highlighting policy’s influence on currencies.
  • 1999/2001 – Dot-com Bubble: Dollar rose with surging US equities, pressuring global investors.
  • 2008/2009 – Global Financial Crisis: Dollar spiked as a safe haven, then eased with Fed liquidity.
  • 2020 – Post-COVID Surge: Safety flight and Fed action drove dollar higher despite near-zero rates.
  • 2022 – Modern Day High: Rapid Fed tightening pushed dollar to a 20-year peak before easing.

Chart Data: 1/31/67-9/30/25. Past performance does not guarantee future results. Indices are unmanaged and not available for direct investment. The US Dollar Index measures the relative value of the US dollar against a basket of other foreign currencies. For illustrative purposes only. Data Sources: Bloomberg and Hartford Funds.

One reason the dollar’s moves have such wide-reaching effects is the currency’s unique role as a global safe haven.


One clear reason the dollar’s moves have such wide-reaching effects is the currency’s unique role as a global safe haven during times of uncertainty. During periods of market stress, investors often turn to the USD thanks to the size and stability of the US economy, the liquidity of US financial markets, and the USD's role as the world’s primary reserve currency. Dollar-denominated assets can appeal to global investors for their reliability and accessibility, which can drive the currency higher.

Importantly, the safe-haven effect can vary depending on the nature of the crisis and the global backdrop. For example, during financial shocks rooted in the US, such as the Global Financial Crisis in 2008, the dollar initially surged but later moderated as policy responses unfolded. When uncertainty is concentrated outside the US, the dollar’s appeal as a refuge tends to be even stronger.


Dollar Trends and Equity Market Performance

Domestic equities tend to post modest gains even when the dollar strengthens (FIGURE 2), reflecting their relative resilience. Many US companies generate a significant share of revenue domestically, which limits the impact of currency translation. However, US large-cap stocks, particularly multinationals in the S&P 500 Index with substantial overseas sales, can face earnings headwinds as foreign revenues convert into fewer dollars. When the dollar weakens, these headwinds ease, and US equities often see a modest performance boost.

The dollar’s impact is most pronounced in international equities. A weaker dollar typically supports international and EM equities in two ways: first, by improving local currency returns when translated back into dollars, and second, by signaling looser global financial conditions, which often coincides with stronger growth outside the US. Conversely, a stronger dollar can pressure these markets by tightening liquidity and increasing the cost of dollar-denominated debt.

Commodities tend to follow a similar pattern. Because most global commodities are priced in USD, a stronger dollar can make them more expensive for international buyers, which can lead to lower prices globally due to reduced demand. When the dollar weakens, commodity prices typically benefit, as both demand and affordability increase for international buyers.


FIGURE 2

Dollar Strength Pressures International Stocks, While Domestic Equities Benefit
Monthly Average Returns When the Value of the Dollar has Increased or Decreased that Month 

Stocks and Commodities When the Dollar Is Up

Stocks and Commodities When the Dollar Is Down

Chart Data: 10/31/85-9/30/25. All performance data dates back to 10/31/85 unless otherwise specified in the representative index definitions below. Past performance does not guarantee future results. Indices are unmanaged and not available for direct investment. For illustrative purposes only. Data Sources: Morningstar and Hartford Funds.


What Happens to Bonds When the Dollar Moves?

Returns for US fixed-income sectors respond differently to dollar moves. Broadly, government bonds tend to show relatively stable performance regardless of dollar direction, reflecting their domestic focus and lower currency risk (FIGURE 3). Notably, high-yield bonds have historically posted stronger returns than other bond sectors when the dollar is rising, likely due to their higher income and risk profile. When the dollar weakens, returns for credit-sensitive sectors such as corporates and high-yield bonds generally improve even further, supported by increased global liquidity and risk appetite.


FIGURE 3

Credit Sectors Feel It Most, While Treasuries Have Held Steady
Monthly Average Returns When the Value of the Dollar has Increased or Decreased that Month

Bonds When the Dollar Is Up

Bonds When the Dollar Is Down

Chart Data: 10/31/85-9/30/25. All performance data dates back to 10/31/85 unless otherwise specified in the representative index definitions below. Past performance does not guarantee future results. Indices are unmanaged and not available for direct investment. For illustrative purposes only. Data Sources: Morningstar and Hartford Funds.


The Dollar’s Role in Global Investing

Taken together, these patterns highlight the dollar’s reach across asset classes—and the importance of understanding its broader market implications. Dollar trends often mirror shifts in monetary policy, economic strength, and the ease with which capital moves across borders, rippling through markets and influencing trade flows, corporate earnings, and capital allocation. While the relationship is complex, certain patterns have emerged over time:

  • Periods of dollar strength have historically coincided with headwinds for non-US equities, EMs, and commodities. This is often due to tighter global financial conditions and increased costs for dollar-denominated debt.
  • Conversely, a weaker dollar has tended to align with a broader risk-on environment, supporting returns for international assets and commodities, and easing financial conditions globally.

However, these relationships aren’t static. Structural changes (e.g., shifts in global trade, monetary policy, or capital flows) can alter how assets respond to currency movements. For example, after 2008, central-bank policies made some of the usual relationships between the dollar and other assets less predictable. More recently, global markets have become more sensitive to changes in the dollar’s value, underscoring the need for ongoing attention to currency trends.

Bottom line: Historical context and typical asset-class responses to dollar moves provide a useful lens for understanding market developments and anticipating where risks and opportunities may emerge. While dollar trends aren't a standalone signal, they remain a critical factor in global portfolio analysis.


To learn more about managing the USD's effect on your portfolio, please talk to your financial professional.


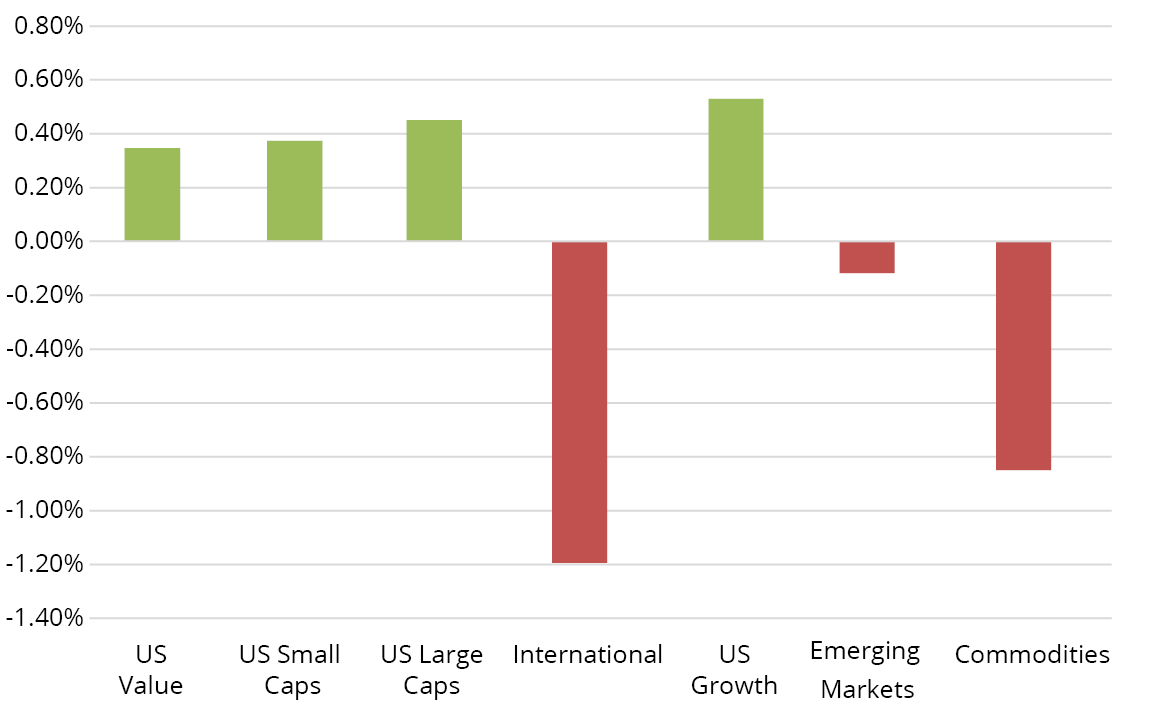
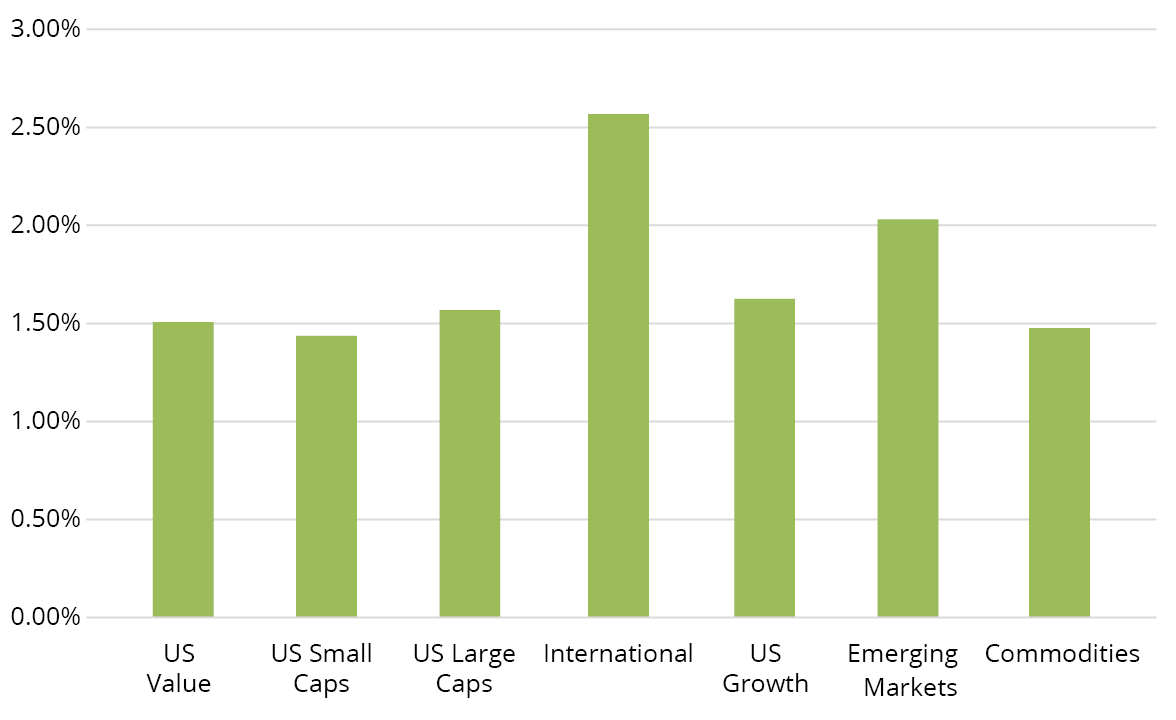
Commodities are represented by the Bloomberg Commodity Index, dating back to 1/1/91, which is a broadly diversified benchmark that measures the performance of futures contracts on physical commodities across major sectors, including energy, agriculture, and metals.

Emerging Markets are represented by the MSCI Emerging Markets Index, which tracks large- and mid-cap equities across emerging economies worldwide, covering approximately 85% of their free-float-adjusted market capitalization. Because the net return version only dates back to 1/1/01, performance reflects a combination of the gross return index (from 1/1/88) and the net return index (from 2001) to provide a more complete historical perspective.

International is represented by the MSCI EAFE Index, which represents large- and mid-cap equities across developed markets in Europe, Australasia, and the Far East, excluding the US and Canada, providing international developed market exposure.

US Growth is represented by the Russell 1000 Growth Index, which measures large-cap US stocks with growth-oriented characteristics, such as higher valuations and stronger forecasted earnings growth.

US Large Caps are represented by the S&P 500 Index, which is a market capitalization-weighted price index that tracks 500 leading large-cap US companies across major industries, widely regarded as a primary benchmark for US equity market performance.

US Small Caps are represented by the Russell 2000 Index, which represents the performance of 2,000 small-cap US companies within the broader Russell 3000 Index, serving as a key gauge of small-cap equity trends.

US Value is represented by the Russell 1000 Value Index, which captures large-cap US stocks exhibiting value traits, including lower valuations and slower growth expectations.

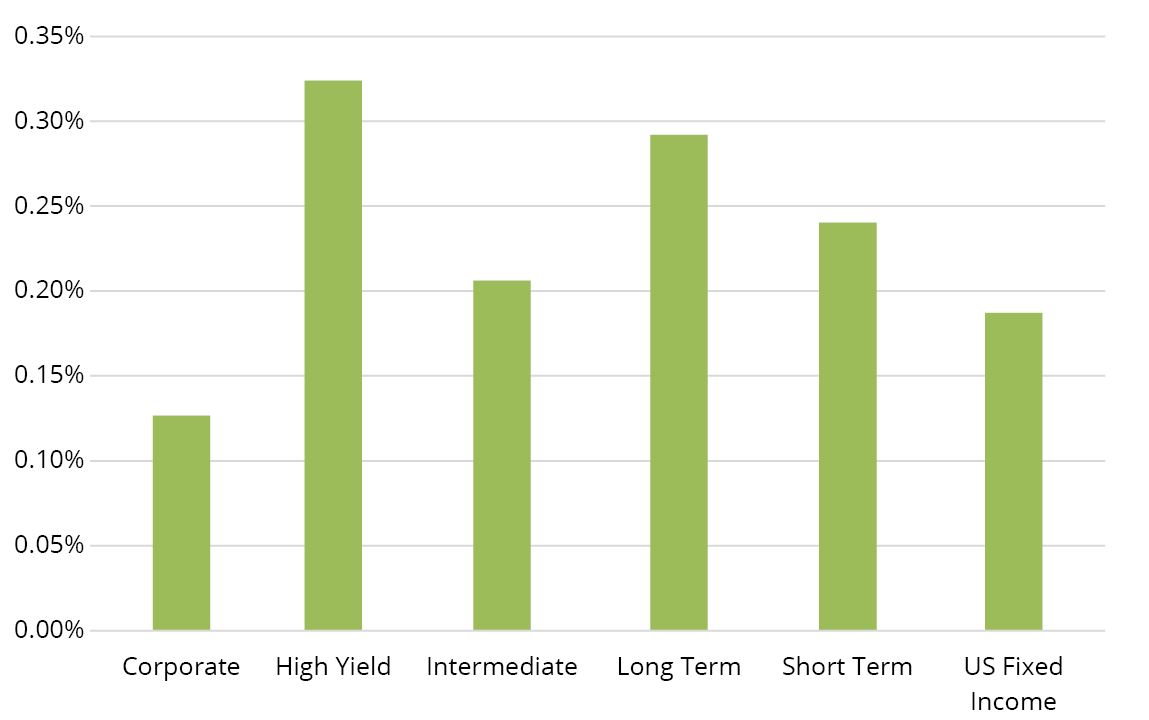
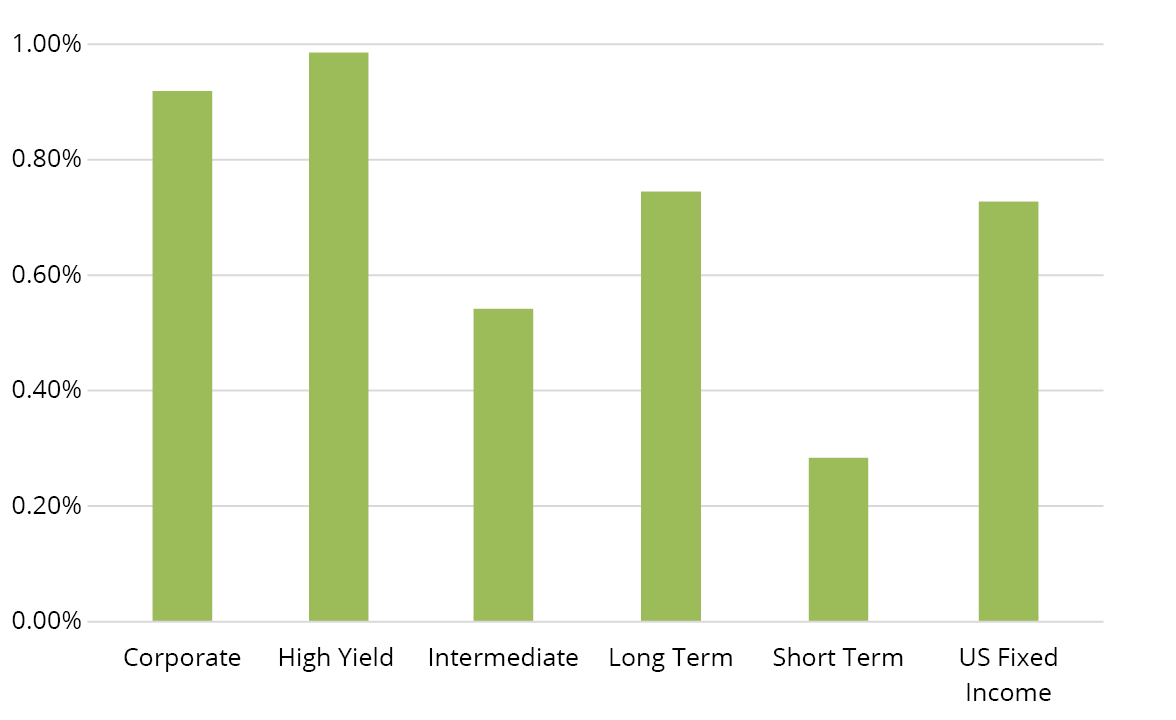
Corporates are represented by Bloomberg US Corporate Bond Index, which is a market-weighted index of investment-grade corporate fixed-rate debt issues with maturities of one year or more.

High yield is represented by Bloomberg US High Yield Corporate Bond Index, which is an unmanaged broad-based market-value weighted index that tracks the total return performance of non-investment grade, fixed-rate publicly placed, dollar-denominated and nonconvertible debt registered with the SEC.

Intermediate is represented by Bloomberg Intermediate US Treasury Index, dating back to 2/1/87, which tracks US Treasury securities with maturities between 1 and 10 years, providing a measure of intermediate-term government debt performance.

Long Term is represented by Bloomberg Long-Term US Treasury Index, dating back to 2/1/87, which measures the performance of US Treasury bonds with maturities of 10 years or longer, reflecting long-duration government debt exposure.

Short Term is represented by Bloomberg Short Treasury Index, dating back to 2/1/88, which represents short-term U.S. Treasury securities with maturities under one year, offering insight into near-term government debt returns.

US Fixed Income is represented by Bloomberg US Aggregate Bond Index, which is composed of securities that cover the US investment-grade fixed-rate bond market, with index components for government and corporate securities, mortgage pass-through securities, and asset-backed securities.

Important Risks: Investing involves risk, including the possible loss of principal. • Foreign investments may be more volatile and less liquid than U.S. investments and are subject to the risk of currency fluctuations and adverse political, economic and regulatory developments. These risks may be greater, and include additional risks, for investments in emerging markets or if focused in a particular geographic region or country. • Small- and mid-cap securities can have greater risks and volatility than large-cap securities. • Fixed income security risks include credit, liquidity, call, duration, and interest-rate risk. As interest rates rise, bond prices generally fall. • Investments in high-yield (“junk”) bonds involve greater risk of price volatility, illiquidity, and default than higher-rated debt securities. • Investments in the commodities market may increase liquidity risk, volatility and risk of loss if adverse developments occur. • Diversification does not ensure a profit or protect against a loss in a declining market.

This information should not be considered investment advice or a recommendation to buy/sell any security. In addition, it does not take into account the specific investment objectives, tax and financial condition of any specific person. This information has been prepared from sources believed reliable, but the accuracy and completeness of the information cannot be guaranteed. This material and/or its contents are current at the time of writing and are subject to change without notice.


WP871 4923616
Insight from Hartford Funds
Author Headshot