Pre-Sales Support
Mutual Funds and ETFs - 800-456-7526
Monday-Thursday: 8:00 a.m. – 6:00 p.m. ET
Friday: 8:00 a.m. – 5:00 p.m. ET
Post-Sales and Website Support
888-843-7824
Monday-Friday: 9:00 a.m. - 6:00 p.m. ET
In the 12 months after the US Federal Reserve (Fed) has started cutting interest rates, the average real return for US stocks (i.e., the average return for stocks after adjusting for inflation) has been 11%. US stocks outperformed government bonds by 6% and corporate bonds by 5%, on average.
Cash has been left further in their wake: On average, stocks have beaten cash by 9% in the 12 months after rate cuts start, while bonds have also outperformed cash (FIGURE 1).
FIGURE 1
Stocks Have Outperformed Bonds, and Bonds Have Outperformed Cash When the Fed Starts Cutting Rates
12-month real returns from the date of first cut
| Date of First Cut |
Cuts to Rates in Each Cycle (%) |
US Stock Market |
Government Bonds |
Corporate Bonds |
Cash |
| 9/30/29* | 5.9 | -33% | 15% | 16% | 8% |
| 12/31/31* | 3.1 | 2% | 30% | 24% | 13% |
| 3/31/33* | 1.0 | 82% | 0% | 10% | -5% |
| 11/30/53* | 1.6 | 46% | 9% | 7% | 1% |
| 10/31/57* | 2.9 | 27% | 0% | 5% | 0% |
| 5/31/60* | 2.7 | 22% | 8% | 7% | 1% |
| 11/30/66 | 2.0 | 17% | -10% | -7% | 2% |
| 2/28/70* | 5.3 | 7% | 4% | 8% | 1% |
| 9/30/71 | 2.3 | 12% | 2% | 6% | 1% |
| 9/30/73* | 1.8 | -45% | -16% | -21% | -3% |
| 7/31/74* | 8.3 | 7% | 3% | 7% | -3% |
| 4/30/80* | 8.6 | 19% | -17% | -18% | 1% |
| 1/31/81* | 4.4 | -10% | -4% | -9% | 6% |
| 7/31/81* | 6.7 | -19% | 14% | 11% | 6% |
| 4/30/82* | 6.4 | 43% | 30% | 39% | 5% |
| 8/31/84 | 5.8 | 14% | 25% | 26% | 5% |
| 5/31/89 | 6.9 | 12% | 3% | 3% | 4% |
| 6/30/95 | 0.8 | 23% | 0% | 2% | 3% |
| 9/30/98 | 0.9 | 25% | -11% | -8% | 2% |
| 12/31/00* | 5.4 | -13% | 2% | 9% | 2% |
| 7/31/07* | 5.2 | -16% | 3% | -5% | -3% |
| 7/31/19* | 2.4 | 11% | 24% | 21% | 0% |
| Average | 11% | 5% | 6% | 2% | |
| Average: No Recession | 17% | 2% | 4% | 3% | |
| Average: Recession | 8% | 7% | 7% | 2% | |
As of 12/23. Past performance does not guarantee future results. Indices are unmanaged and not available for direct investment. See below for representative index definitions. * Indicates that a recession occurred within 12 months. Return Data Sources: CFA Institute, SBBI database, and Schroders. Fed Funds Data Sources (1928-1954): New York Tribune and The Wall Street Journal via FRED in which a 7-day average has been taken to remove daily volatility, an approach consistent with the methodology of the St. Louis Fed. Fed Funds Data Source (1955-2023): FRED.
Stocks Prefer if a Recession Can Be Avoided
These returns are even more impressive considering that in 16 of the 22 cycles, the US economy was either already in a recession when cuts commenced or entered one within 12 months (FIGURE 2). Stock returns were better if a recession was avoided but, even if it wasn’t, they were still positive on average.
FIGURE 2
The 22 Main Rate Cutting Cycles since 1928
Fed funds rate (1928-2023)
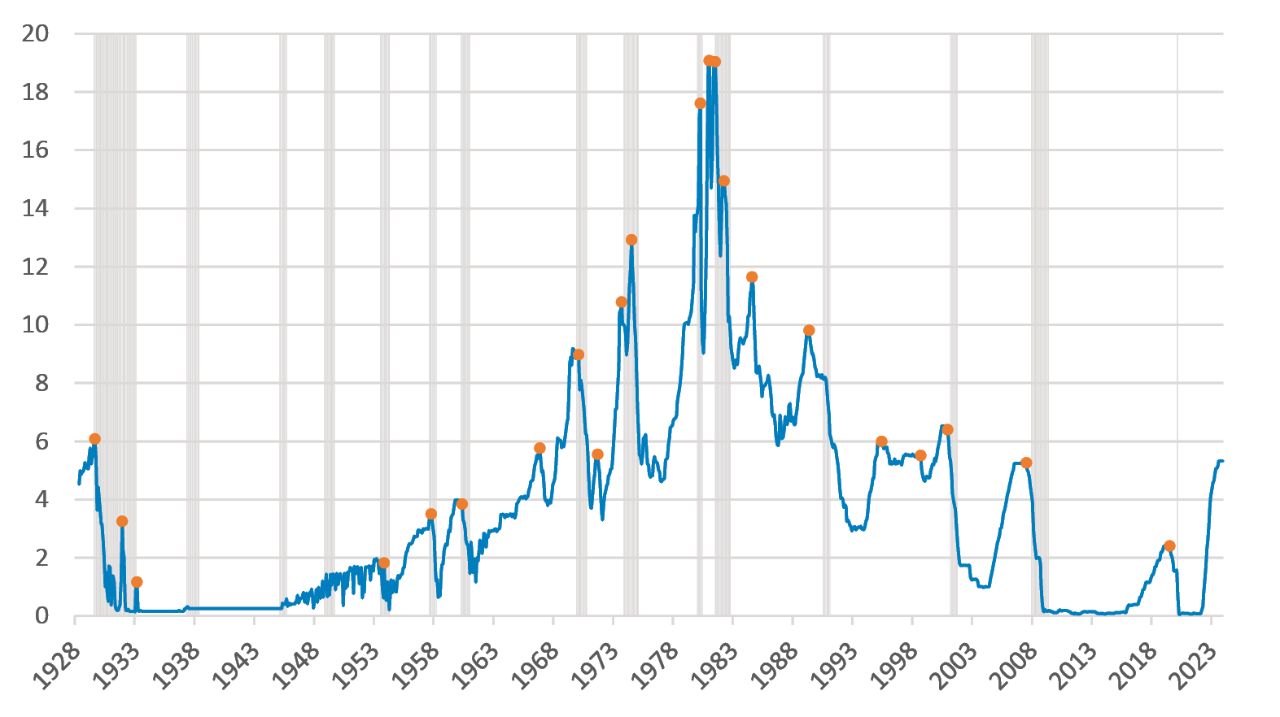
As of 12/23. Dots represent the beginning of a rate-hiking cycle; shaded areas represent recessions. Fed Funds Data Sources (1928-1954): New York Tribune and The Wall Street Journal via FRED in which a 7-day average has been taken to remove daily volatility, an approach consistent with the methodology of the St. Louis Fed. Fed Funds Data Source (1955-2023): FRED.
While recessions aren’t desirable, they haven’t always been something for investors to fear.
There are big exceptions, though. And while recessions aren’t desirable, they haven’t always been something for stock investors to fear.
By contrast, bond investors tend to do better if a recession occurs. They have historically benefited from safe-haven buying (especially government bonds), which drives yields lower and bond prices higher. But they’ve also done ok if a recession was avoided. In this scenario, corporate bonds have, on average, outperformed government bonds.
The range of historical returns is wide for stocks and bonds, but both have tended to do well when the Fed has started cutting rates.
What About Today?
Unlike most historical episodes, the Fed isn’t considering cutting rates because the economy is too weak. Instead, it’s doing so because inflation is heading in the right direction, and policy no longer needs to be so restrictive. If the Fed is right and able to engineer a soft landing, then 2024 could be a good year for both stock and bond investors alike.
Talk to your financial professional to learn more about positioning your portfolio for a changing investment landscape.
Cash is represented by Ibbotson SBBI US Treasury Bills, which analyzes the performance of a single issue of outstanding US Treasury bills with a maturity term of around 30 days.
Corporate Bonds are represented by the Ibbotson SBBI US Long-term Corporate Bonds Total Return, which analyzes the performance of a single issue with a maturity term of around 20 years.
The federal funds rate is the target interest rate set by the Federal Open Market Committee. This target is the rate at which commercial banks borrow and lend their excess reserves to each other overnight.
Government Bonds are respresented by the Ibbotson SBBI US Long-term Government Bonds Total Return, which analyzes the performance of a single issue of outstanding US Treasury bonds with a maturity term of around 20 years.
Real returns are the annual percentage of profit earned on an investment, adjusted for inflation.
US Stock Market is represented by the S&P 500 Index, which is is a market capitalization-weighted price index composed of 500 widely held common stocks.
Important Risks: Investing involves risk, including the possible loss of principal. Fixed-income security risks include credit, liquidity, call, duration, and interest-rate risk. As interest rates rise, bond prices generally fall. • US Treasury securities are backed by the full faith and credit of the US government as to the timely payment of principal and interest.
The views expressed herein are those of Schroders Investment Management (Schroders), are for informational purposes only, and are subject to change based on prevailing market, economic, and other conditions. The views expressed may not reflect the opinions of Hartford Funds or any other sub-adviser to our funds. The views and information discussed should not be construed as research, a recommendation, or investment advice, nor should they be considered an offer or solicitation to buy or sell any security. This information is current at the time of writing and may not be reproduced or distributed in whole or in part, for any purpose, without the express written consent of Schroders or Hartford Funds.