• Products
  • Insights
  • Practice Management
  • Resources
  • About Us

Historically, the case for an investment opportunity often appears most compelling near its peak, when strong growth, high profitability, and stellar past performance attract a widening pool of investors eager to buy into what seems like unstoppable momentum at any price.

Secular investment opportunities can be especially pernicious, as they frequently present themselves as a “new paradigm,” driven by innovation or structural change. And the longer leadership persists, the more the theme appears to be validated by its long-term performance. To gain perspective on today’s cycle, we revisit the defining secular growth stories of the past 75 years to explore whether familiar patterns are reemerging, or whether this time is truly different.


Late 1960s: The Rise of the “Nifty 50” as One-Decision Stocks

The Narrative: During the late 1960s, the 50 leading US large-cap stocks—including companies such as GE, Coca-Cola, and IBM—were experiencing rapid growth. By leveraging their scale and brand power, they expanded into new regions and business lines, consistently outpacing their competitors. Valuations climbed accordingly, with price-to-earnings1 multiples exceeding 30–40x in some cases. These levels were widely viewed as justified, supported by long track records of superior growth and profitability.

These dominant industry leaders were household names, characterized by wide competitive moats, strong balance sheets, and years of sustained stock-market outperformance. They came to be known as “one-decision stocks:” investments you bought once and never had to think about selling.

What Happened Next: As US earnings growth and market share came under pressure from the high interest rates and inflation of the early 1970s, the Nifty 50 stocks began to unravel. What followed was a two-decade period of underperformance for the US market relative to international stocks, exacerbated by rising foreign competition, the collapse of the savings and loan industry, and the 1987 stock-market crash.


Late 1980s: Japan’s Rise to Market Dominance

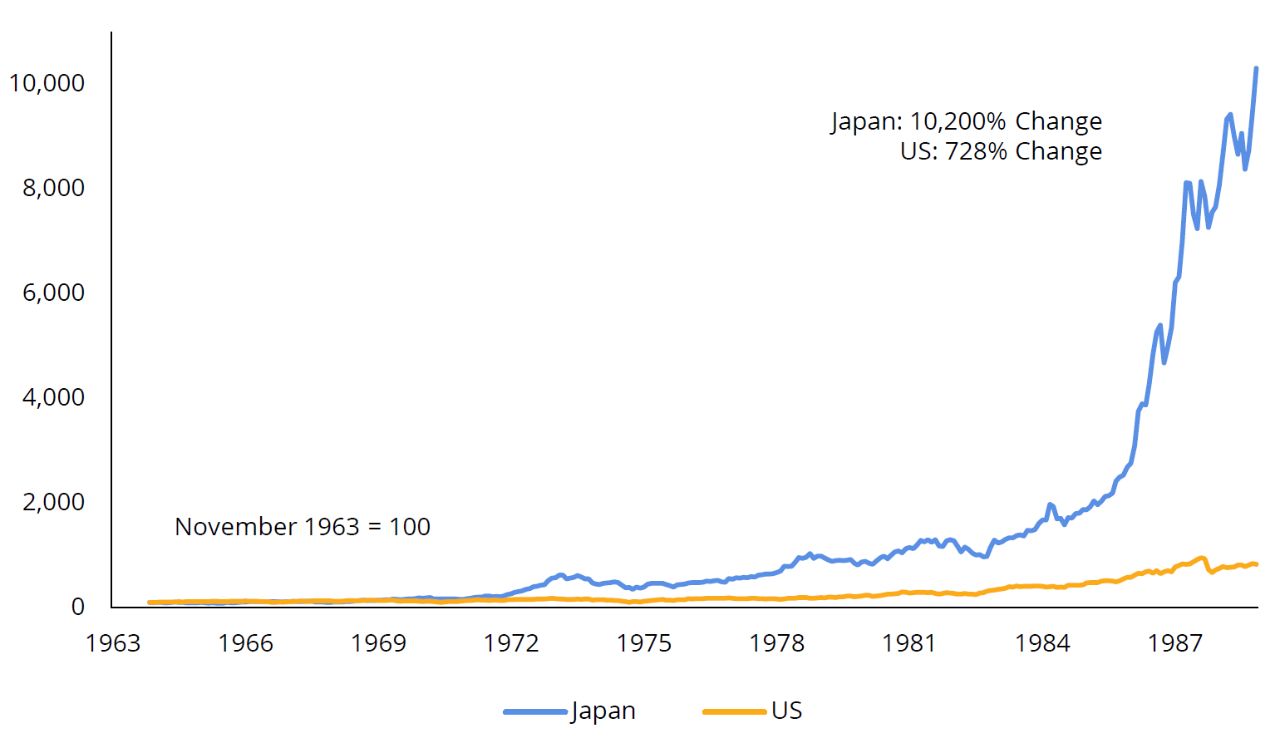
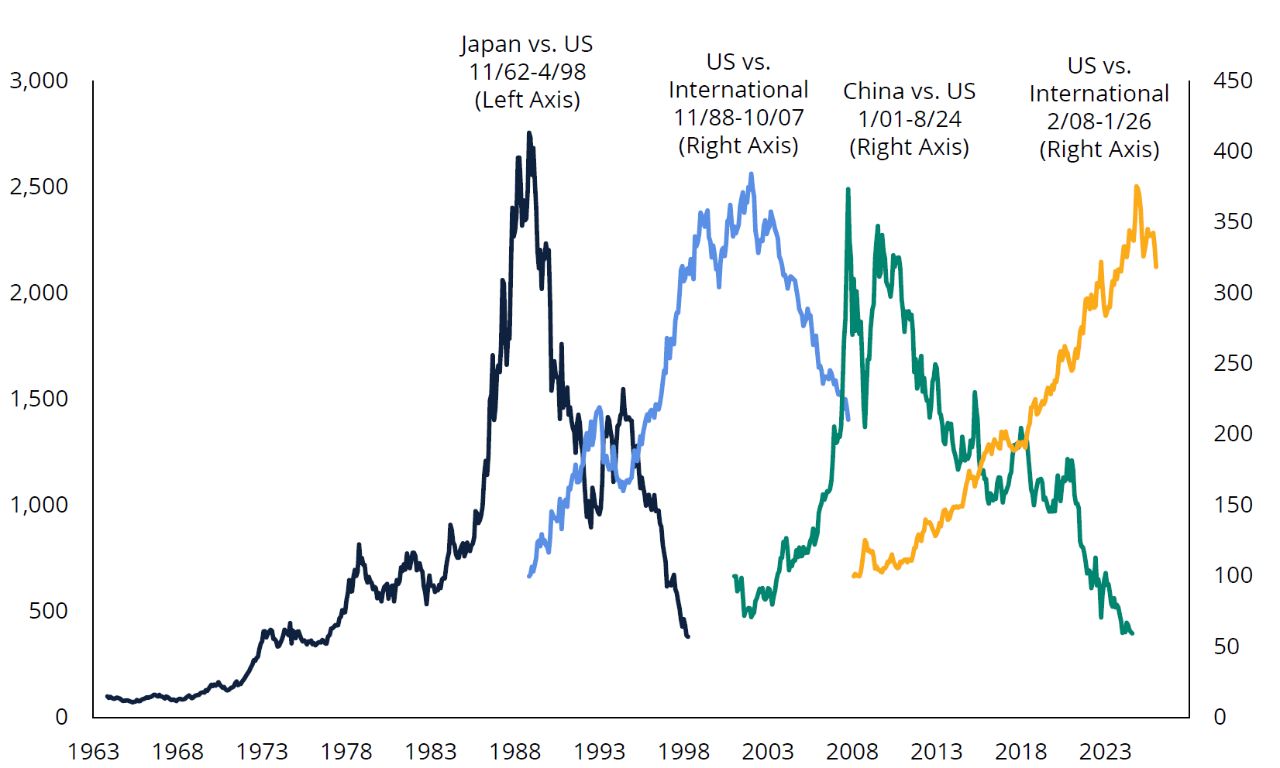
The Narrative: During the late 1980s, Japan came to dominate technological innovation and manufacturing efficiency, capturing significant market share in critical industries such as automobiles (Toyota, Honda) and consumer electronics (Sony, Panasonic, Nintendo). Japan also became home to the world’s largest stock market, accounting for roughly 45% of the global stock market, as investors were drawn to its strong profit growth, technological advantages, and impressive returns (FIGURE 1).

At the peak of the boom, enthusiasm for all things Japanese ran so high that the land beneath Tokyo’s Imperial Palace was said to be worth more than all the real estate in the state of California.

FIGURE 1

Japan’s Market Dominance Seemed So Obvious in the 1980s
Japan vs. US Equity Markets: Indexed Growth and Cumulative Percent Change (1963–1988)

Placeholder

Past performance does not guarantee future results. Investors cannot directly invest in indices. Returns prior to 1970 reflect TOPIX Index and S&P 500 Index local price returns. From 1970 forward, returns are based on MSCI Japan Index net returns in US dollars (USD) and S&P 500 Index total returns. Please see below for index definitions. For illustrative purposes only. Data Sources: Schroders, S&P, MSCI, and Bloomberg.


What Happened Next: The resulting liquidity crunch, driven by a stronger currency, higher interest rates, and tighter bank lending standards, triggered a sharp and prolonged decline in Japanese stock and real-estate prices (FIGURE 2). It ultimately took more than 34 years for the Japanese stock market to reclaim its 1989 peak.


FIGURE 2

Japan Suffered Greatly When Liquidity Dried Up and the Banking System Crumbled
Japan vs. US Equity Markets: Indexed Growth and Cumulative Percent Change (1988-1998)

Placeholder

Past performance does not guarantee future results. Investors cannot directly invest in indices. Japanese returns are based on the MSCI Japan Net Total Return Index in USD, while US returns are based on the S&P 500 Index Total Return. Please see below for index definitions. For illustrative purposes only. Data Sources: Schroders, S&P, MSCI, and Bloomberg.


Late 1990s: The US at the Center of the Internet Revolution

The Narrative: In the 1990s, conditions once again began looking up for the US. Globalization enabled US multinational corporations to expand abroad while also lowering input costs, helping to keep overall inflation in check.

By the late 1990s, the US had come to dominate the burgeoning internet sector, and the federal government recorded a budget surplus for the first time in more than 25 years (FIGURE 3). Rapid internet adoption was reshaping how people communicated, collaborated, shopped, and transacted. This shift appeared to create an opportunity to invest in the winners of the new economy. These included producers of PCs, servers, routers, chips, and software, as well as internet businesses such as service providers and online retailers. They also included infrastructure companies, such as telecom firms and fiber‑optic cable producers, that supported technology companies well ahead of the widespread adoption of internet commerce.


FIGURE 3

US Technology Dominance Seemed So Obvious During the Dot-Com Euphoria
International vs. US Equity Markets: Indexed Performance and Cumulative Percent Change (1988–2002)

Past performance does not guarantee future results. Investors cannot directly invest in indices. International returns prior to December 1998 reflect the MSCI EAFE Net Total Return Index in USD; returns thereafter reflect the MSCI ACWI Net Total Return Index in USD. US returns are based on the S&P 500 Index Total Return. Please see below for index definitions. For illustrative purposes only. Data Sources: Schroders, S&P, MSCI, and Bloomberg.


What Happened Next: Even as internet adoption continued to accelerate, internet stocks collapsed as underlying fundamentals failed to keep pace with ever-rising expectations. The tech-heavy NASDAQ Index2 fell by more than 80% and took more than 15 years to return to its peak reached in 2000 (FIGURE 4).

With the first decade of the new millennium bookended by the collapse of the tech bubble and the Global Financial Crisis (GFC), US stocks were among the only major markets to post negative returns for the decade. By contrast, international stocks benefited from a roughly 40% depreciation of the USD between 2001 and 2008, boosting their relative performance.


FIGURE 4

US Stocks Suffered When Fundamentals Couldn’t Keep Up with Expectations
International vs. US Equity Markets: Indexed Performance and Cumulative Percent Change (2002-2007)

Past performance does not guarantee future results. Investors cannot directly invest in indices. International returns are based on the MSCI ACWI Net Total Return Index (USD). US returns are based on the S&P 500 Index Total Return. For illustrative purposes only. Data Sources: Schroders, S&P, MSCI, and Bloomberg.


2007: China’s Manufacturing Boom Captures Global Markets

The Narrative: Even before the GFC pushed the US financial system to the brink of collapse, the US was already beginning to lose ground as the long‑anticipated rise of emerging markets (EMs) finally took hold. Following China’s entry into the World Trade Organization in 2001, its economy averaged double‑digit GDP growth for the next six years, roughly four times the pace of US growth over the same period (FIGURE 5).

Investors were drawn to EMs by their rapid economic and profit growth and the increasing purchasing power of their consumers that would accompany their expansion of wealth.


FIGURE 5

China’s Emerging Economic Leadership Seemed So Obvious in the Aughts
China vs. US Equity Markets: Indexed Performance and Cumulative Percent Change (2001-2007)

Past performance does not guarantee future results. Investors cannot directly invest in indices. China returns are based on the MSCI China Net Total Return Index (USD). US returns are based on the S&P 500 Index Total Return. Please see below for index definitions. For illustrative purposes only. Data Sources: Schroders, S&P, MSCI, and Bloomberg.


What Happened Next: Like past supercycles, the story of China’s rise blended genuine structural change with speculative overreach. Today, more than 18 years after its 2007 peak, China’s stock market remains below those peak levels, even though the economy has grown more than fivefold over the same period (FIGURE 6).

Much of China’s economic expansion proved to be heavily reliant on unsustainable borrowing by local governments and through shadow banking markets,3 prompting authorities to rein in excesses in the name of financial stability. At the same time, increased regulation and the market’s heavy exposure to state-owned enterprises have continued to weigh on China’s stock market, leaving it among the worst-performing major stock markets in the post-GFC era.


FIGURE 6

China Suffered Once It Became Clear the Drivers of Its Dominance Were Unsustainable
China vs. US Equity Markets: Indexed Performance and Cumulative Percent Change (2007-2024)

Past performance does not guarantee future results. Investors cannot directly invest in indices. China returns are based on the MSCI China Net Total Return Index (USD). US returns are based on the S&P 500 Index Total Return. For illustrative purposes only. Data Sources: Schroders, S&P, MSCI, and Bloomberg.


2025: A New Era of US Technology Dominance

The Narrative: Most investors are well aware of the dynamics shaping the current cycle. Since the GFC, US corporate profits have surged, supported by inexpensive financing, low input costs, and the outsized growth of the technology sector (FIGURE 7).

By contrast, much of the rest of the world has had less exposure to booming technology profits and has faced recurring headwinds at various points in the cycle, including European austerity, a Chinese property crisis, and, until recently, persistent deflation in Japan. As a result, US stock-market returns have outpaced the rest of the world, a gap further widened by the more than 50% reversal of the USD’s weakness from the prior cycle. For many investors, this reinforced the view that the US may be the only thing worth owning.


FIGURE 7

The US’s AI-Driven Technological Leadership Seems So Obvious and Permanent
International vs. US Equity Markets: Indexed Performance and Cumulative Percent Change (2008-2024)

Past performance does not guarantee future results. Investors cannot directly invest in indices. International returns are based on the MSCI ACWI ex USA Net Total Return Index (USD). US returns are based on the S&P 500 Index Total Return. For illustrative purposes only. Data Sources: Schroders, S&P, MSCI, and Bloomberg.


What Happened Next: This remains the defining debate of the decade. Already, there are signs that US-led dominance may have run its course. After underperforming international peers in 2025, US stocks were again trailing in early 2026.

This weakness could prove short-lived, particularly if continued innovation and investment in AI propel US equities, and the technology sector in particular, back into leadership. Alternatively, the pattern that emerged in 2025 and continued into early 2026 may signal the early stages of a new global leadership cycle.

Bulls argue that the world is still in the early phases of a technology-driven productivity boom that could reshape the global economy. Skeptics counter that today’s elevated valuations and unattainable growth expectations leave little room for disappointment. History suggests that both perspectives can be right, but on very different timelines.

Past market cycles have often peaked amid a sense of inevitability, fueled by innovation, sector dominance, or sweeping economic change. As growth accelerates, even cautious investors begin to chase upside, frequently through leverage or novel investment structures, while diversification and core risk management fall by the wayside. The challenge is that investors pursue hindsight, piling into assets with exceptional past performance precisely when risks are greatest (FIGURE 8).


FIGURE 8

It’s Really True: Past Performance Doesn’t Guarantee Future Results
Cumulative Performance of Leading Markets Before and After Peak Dominance

Past performance does not guarantee future results. Investors cannot directly invest in indices. All values are indexed to 100 at the start of each series. Prior to 1970, returns are based on TOPIX and S&P 500 Index local price returns. From 1970 onward, returns are based on MSCI Japan Net Return Index (USD) and S&P 500 Index Total Return. International returns are based on the MSCI EAFE Index through November 1998 and the MSCI ACWI ex USA Net Total Return Index (USD) thereafter. China returns are based on the MSCI China Net Total Return Index (USD). For illustrative purposes only. Data Sources: Schroders, S&P, MSCI, and Bloomberg.


Every Market Boom Has its Bust

History shows that after each era of secular dominance, performance has inevitably faltered, with sharp drawdowns followed by years (and in some cases decades) of underperformance. What once felt like a revolutionary new paradigm for markets and society ultimately revealed itself as just another market cycle, regardless of the strength of the underlying companies or the degree of disruption involved.

These periods often rewarded early pioneers handsomely while inflicting significant losses on latecomers who rushed in near the peak. The takeaway is straightforward. When an investment theme becomes “so obvious,” it may be worth pausing to consider the risks that may be underpriced in market expectations. More often than not, some combination of disappointing growth, overinvestment, or rising competition begins to expose cracks in the story.

Rather than waiting for those cracks to emerge, proactive investors may choose to adjust course sooner, looking beyond the crowd’s favored trades and reembracing diversification as a way to build resilience for whatever comes next.


To learn more about the role of diversification in your portfolio, please talk to your financial professional. 


* Diversification does not ensure a profit or protect against a loss in a declining market.

1 The price-to-earnings ratio measures a company’s share price relative to its earnings-per-share and helps assess the relative value of a company’s stock.

2 NASDAQ Composite Index is a market-value weighted index of all common stocks listed on the National Association of Securities Dealers automatic quotation market.

3 Shadow banking markets refer to lending and financing that occur outside the traditional banking system, often through lightly regulated investment products or intermediaries rather than standard bank loans.

MSCI ACWI Index is a free float-adjusted market capitalization index that measures equity market performance in the global developed and emerging markets, consisting of developed and emerging market country indices. MSCI index performance is shown net of dividend withholding tax.

MSCI China Index is a free-float adjusted market-capitalization index that is designed to measure equity market performance in China.

MSCI EAFE Index is a free float-adjusted capitalization index that is designed to measure developed market equity performance, and excludes the US and Canada.

MSCI Japan Index is a free-float adjusted market-capitalization index designed to measure large- and mid-cap Japanese equity market performance.

S&P 500 Index is a market capitalization-weighted price index composed of 500 widely held common stocks.

TOPIX Index (Tokyo Stock Price Index) is a market‑capitalization‑weighted index that tracks the performance of all domestic companies listed on the Tokyo Stock Exchange’s Prime Market, providing a broad snapshot of the Japanese stock market.

Important Risks: Investing involves risk, including the possible loss of principal. • Foreign investments may be more volatile and less liquid than US investments and are subject to the risk of currency fluctuations and adverse political, economic and regulatory developments. These risks may be greater, and include additional risks, for investments in emerging markets or in a particular geographic region or country.

The views expressed herein are those of Schroders Investment Management, are for informational purposes only, and are subject to change based on prevailing market, economic, and other conditions. The views expressed may not reflect the opinions of Hartford Funds or any other sub-adviser to our funds. They should not be construed as research or investment advice nor should they be considered an offer or solicitation to buy or sell any security. This information is current at the time of writing and may not be reproduced or distributed in whole or in part, for any purpose, without the express written consent of Schroders Investment Management or Hartford Funds.


WP890 5369090
Insight from sub-adviser Schroders Investment Management
Author Headshot
Investment Strategist
Author Headshot
Matt Ko, CFA
Investment Strategist
Author Headshot
Head of Investment Strategists
Author Headshot
Investment Strategist