• Products
  • Insights
  • Practice Management
  • Resources
  • About Us

Overview
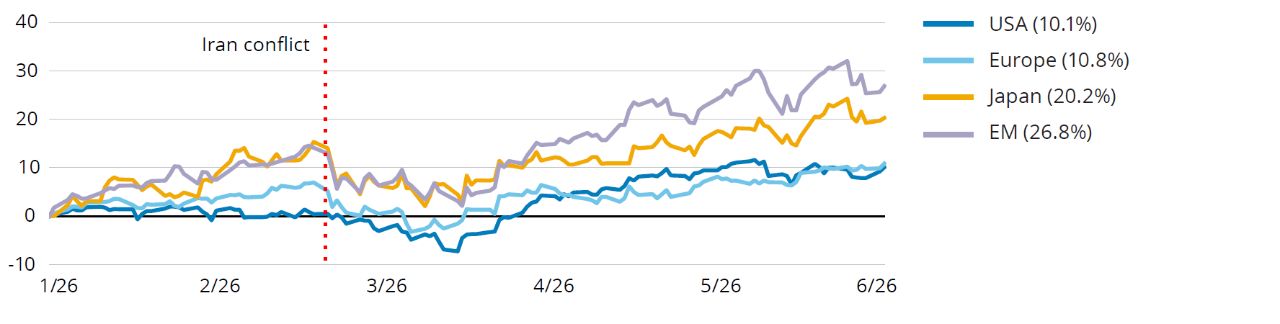
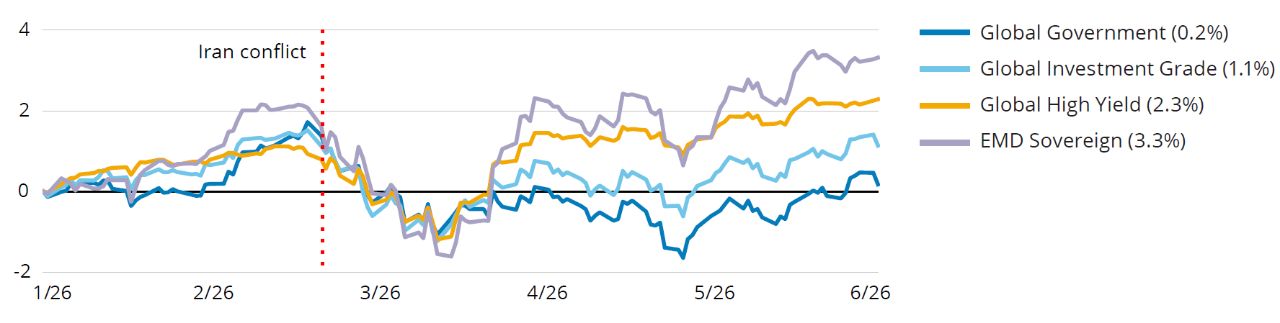
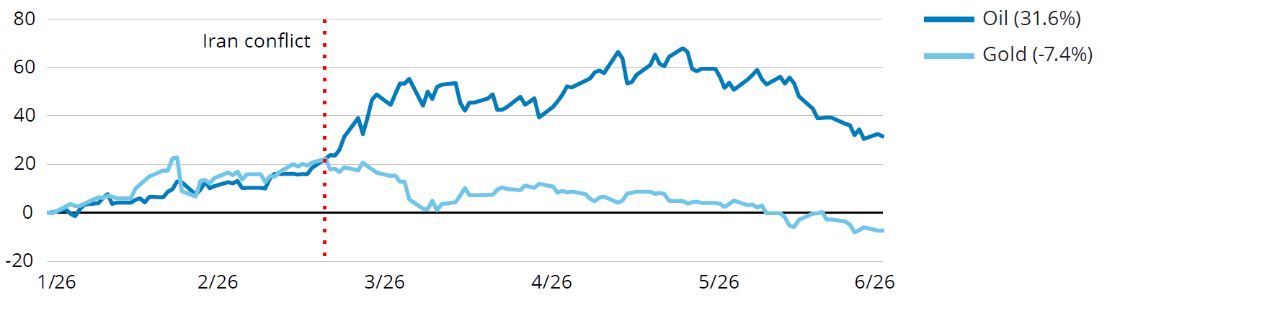
The macro and market backdrop has surprised us on the upside despite the tug of war with geopolitical risk (FIGURE 1). There’s been an incremental pickup in maritime traffic through the Strait of Hormuz, but energy supplies remain heavily disrupted, and inflation risks are higher than before the war, with stagflationary pressures elevated in some regions, including Europe.

What explains the economic and market resilience? The AI-driven earnings boom has enabled the market to absorb the geopolitical disruption. In a testament to their adaptability, companies have beaten expectations in the face of extreme uncertainty, and the upshot of strong expectations is that equities have become significantly cheaper. Continued robust AI demand combined with supply constraints (in compute, memory, and power) is expected to extend the AI spending cycle into 2027–2028 and create attractive opportunities as AI bottlenecks drive pricing power.

On the policy front, most central banks have moved quickly to establish credibility on inflation, signaling a degree of willingness to look past any signs of faltering growth in favor of a hawkish stance to address inflation. The European Central Bank was a notable first mover, hiking rates in June, and other central banks may be poised for similar inflation-minded moves.

One factor that kept oil-price shocks from reaching worst-case levels was the extensive use of national reserves; stockpiling by China and other countries also helped alleviate the pressure. However, a slow normalization of traffic in the Strait of Hormuz would raise upside risks for oil prices given lower inventory levels.

Our expectation of strong earnings growth amid more moderate valuations has led us to increase our equity view to overweight and to express a preference for EM over Europe. We’ve turned neutral on credit amid a significant tightening in spreads4 while keeping our moderately overweight view on global duration.5 Breakeven inflation rates have compressed significantly but we think real yields— particularly in the front end of the yield curve6—are too high in many regions.

FIGURE 1

Shake It Off? Markets Have Largely Seen Further Gains Despite Ongoing Conflict
Cumulative Returns (%)

Equities

line chart

Fixed income

line chart

Commodities

line chart

Chart Data: 1/1/26-6/30/26. Past performance does not guarantee future results. Select data provided and copyrighted by Refinitiv. Republication or redistribution of Refinitiv content, including by framing or similar means, is prohibited without the prior written consent of Refinitiv. Refinitiv is not liable for any errors or delays in Refinitiv content, or for any actions taken in reliance on such content. Refinitiv’s logo is a trademark of Refinitiv and its affiliated companies. See below for representative index definitions. Sources: Wellington Management and Refinitiv.

Given that returns have been tied to earnings, valuations have de-rated, and we don’t expect them to be a headwind.

Equities

Despite the effects of the Middle East conflict, we think conditions for equities have remained supportive, driven by strong earnings revisions and a resilient manufacturing cycle. The durability of the global earnings and macro cycle is a sign of the profound impact of the technological shift we’re witnessing and the capex wave it’s fueling.

In nearly every market except Japan, virtually all the year-to-date gains in equities have been driven by EPS growth. Given that returns have been tied to earnings, valuations have de-rated, and we don’t expect them to be a headwind.

Looking ahead, we think the market’s performance will come down to earnings expectations, which we estimate will be in the low- to mid-double digits for global equities over the coming 12 months, with some room for modest valuation expansion. In our view, high expectations for EPS growth over the short- and mid-term are justified. Beyond earnings, balance sheets are strong, with relatively low debt-to-equity and high operating-cash-flows-to-debt ratios.

Our Multi-Asset Views

Asset Class View Change
Global Equities Overweight uparrow
DM Government Bonds Moderately OW
Credit Spreads Neutral downarrow
Commodities Moderately OW
Cash Underweight uparrow
Within Asset Classes  
Global Equities  
US Neutral downarrow
Europe Moderately UW
United Kingdom Moderately UW uparrow
Asian DMs Neutral
EMs Overweight
DM Government Bonds
US Government Neutral downarrow
Eurozone Government Neutral uparrow
UK Government Neutral
Japan Government Neutral uparrow
Credit Spreads
Global Investment-Grade Credit Neutral
Global High Yield Neutral
EM Debt Neutral

OW = overweight, UW = underweight

Source: Wellington Management. Views expressed have a 12-month horizon and are those of the authors and Wellington Solutions. Views are as of June 2026, are based on available information, and are subject to change without notice. Individual portfolio management teams may hold different views and may make different investment decisions for different clients. This is not to be construed as investment advice or a recommendation to buy or sell any specific security.

There are incipient signs of equity-market broadening. This includes a growing awareness of the layers beneath the big AI names, including the companies supporting the AI-driven build out of infrastructure, chips, energy, and other parts of the economy. Recent outperformance by US small caps over large caps, along with hyperscalers lagging sectors such as industrials and financials, also points to some rotation underway. Amid this rotation, volatility has picked up, and any technical correction driven by these dynamics would, in our view, present a tactical opportunity to add exposure, given solid fundamentals.

We’ve moved to a neutral view on US equities. Earnings growth remains robust and valuations appear reasonable. We think the spate of Initial Public Offerings (IPOs) will likely drive positive-to-neutral net issuance this year. While we expect the market to absorb this new issuance, we think the growth in net issuance and larger deal sizes could make equity supply something of a headwind for the market over the coming 12 months. We don’t see evidence of stretched positioning, in aggregate, across a range of investor groups, but there are signs of exuberance in some areas, such as leveraged ETFs.

In Europe ex-UK and the UK, we think earnings expectations remain too high, and stagflationary concerns are more relevant. France and Germany have been hurt by competition from China, and risks related to political instability in France ahead of the 2027 presidential election could weigh on sentiment. We would stress, however, that we aren’t negative on Europe, and there’s potential for positive surprises, such as progress on financial-markets reform in the European Union (EU) or quicker-than-expected deployment of fiscal stimulus in Germany.

Relative to Europe, we have a higher-conviction view on EM equities. EM in Asia, in particular, are critical to the AI supply chain. In addition, China’s resilience during the Middle East conflict stands out.

We’re neutral on Japan. The market continues to benefit from buybacks, high/improving return on equity (ROE),7 and corporate reforms, but we’re concerned about the potential for blowback from rate and currency volatility at a time when valuations are more stretched, based on some metrics, than they have been for some time.


Fixed Income

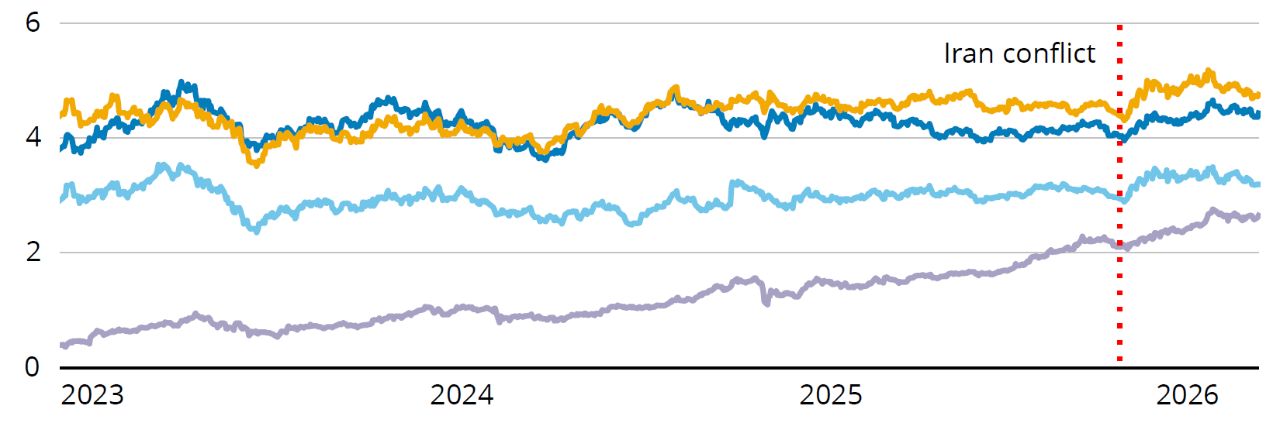
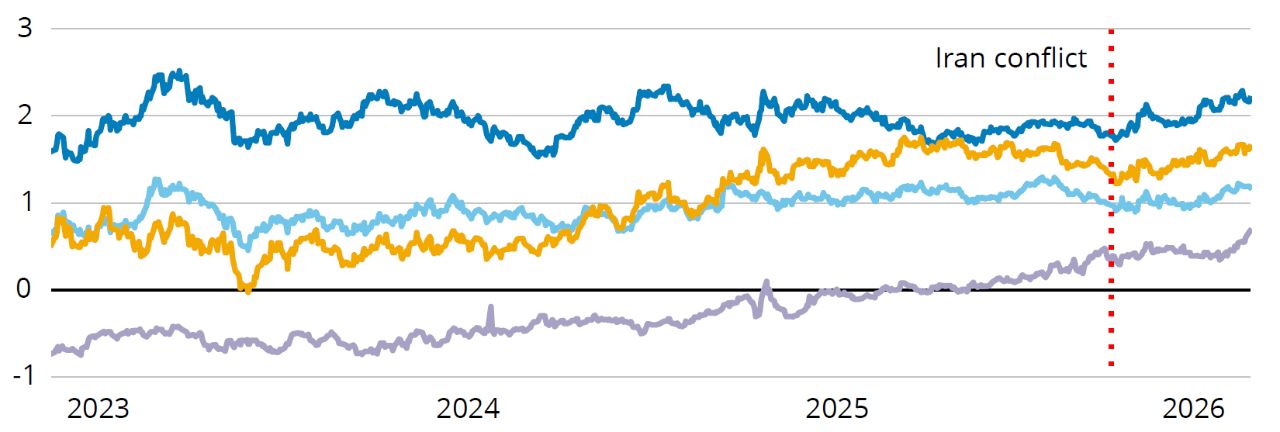
While yields moved modestly lower after the US and Iran began discussing a peace deal, they remain elevated given continued inflation risks and hawkish central-bank positioning. Global growth has remained largely resilient throughout the crisis, particularly in the US, offering some central banks breathing room to focus on inflation via rate hikes. However, markets may be overestimating future policy tightening. A lasting resolution to the conflict would likely ease energy-driven inflation pressures. In addition, evolving policy frameworks that emphasize any evidence of limited secondary inflation effects or real-economy softening could test central-bank willingness to follow through on hawkish rhetoric.

Against this backdrop, government bonds look more compelling to us as both nominal and real yields have reset higher (FIGURE 2). Entry yields are a key driver of long-term total returns, and we think today’s elevated levels offer improved carry8 and return potential. They could also help restore government bonds’ role as a potential downside diversifier to equities in a steady inflation/weaker-growth scenario.


Our Multi-Asset Views

Asset Class View Change
Global Equities Overweight uparrow
DM Government Bonds Moderately OW
Credit Spreads Neutral downarrow
Commodities Moderately OW
Cash Underweight uparrow
Within Asset Classes  
Global Equities  
US Neutral downarrow
Europe Moderately UW
United Kingdom Moderately UW uparrow
Asian DMs Neutral
EMs Overweight
DM Government Bonds
US Government Neutral downarrow
Eurozone Government Neutral uparrow
UK Government Neutral
Japan Government Neutral uparrow
Credit Spreads
Global Investment-Grade Credit Neutral
Global High Yield Neutral
EM Debt Neutral

OW = overweight, UW = underweight

Source: Wellington Management. Views expressed have a 12-month horizon and are those of the authors and Wellington Solutions. Views are as of June 2026, are based on available information, and are subject to change without notice. Individual portfolio management teams may hold different views and may make different investment decisions for different clients. This is not to be construed as investment advice or a recommendation to buy or sell any specific security.

FIGURE 2

Are Rising Yields a Warning Sign or an Opportunity?

Nominal 10-Year Yields (%) 

line chart

Real 10-Year Yields (%)

line chart
chart legend

Chart Data: 6/30/23-6/30/26. Past performance does not guarantee future results. Select data provided and copyrighted by Refinitiv. Republication or redistribution of Refinitiv content, including by framing or similar means, is prohibited without the prior written consent of Refinitiv. Refinitiv is not liable for any errors or delays in Refinitiv content, or for any actions taken in reliance on such content. Refinitiv’s logo is a trademark of Refinitiv and its affiliated companies. Sources: Wellington Management and Refinitiv.

We’ve moved from a moderate underweight view on Japanese government bonds (JGBs) to a neutral view. Inflation risks have risen, partly because the Bank of Japan remains behind the curve in tightening rates. However, this has been priced in to a great extent, making a separate position in the 10-year JGB—where paying carry is the most expensive among regions—less attractive, in our view.

Globally, differentials in how fiscal risks are priced can lead to interesting relative-value opportunities. We’re watching France, in particular, where domestic political uncertainty is growing against a backdrop of fiscal slippage vs. EU targets. In other countries, additional defense spending could reinforce the fiscal-activism narrative, weakening confidence in long-term demand even as this spending fuels more supply.

In credit, we’ve moved to a neutral stance. While we think all-in yields are attractive, spreads have once again tightened significantly and offer limited compensation for downside risks. We’ve downgraded our overweight view on credit as a result, although we continue to prefer European credit due to stronger fundamentals. Increased issuance, including AI-related capex and financing activity, could weigh on technicals, though it may also create greater dispersion across sectors and issuers, supporting more selective opportunities. Overall, we think the risk/reward profile appears balanced, warranting a neutral view.

In credit, tight spreads offer limited compensation for downside risks.

Commodities

We’ve moved to a small overweight view on oil given the sharp decline in prices. The market is transitioning from a short-term deficit to a medium-term surplus. However, the market is already pricing in much of that future surplus today despite lingering uncertainties about the resumption of exports from the Middle East, demand growth, and the supply response (e.g., the development of new pipelines to bypass the Strait of Hormuz).

On the cyclical demand side, many countries, including the US, will need to replenish their reserves given the large drawdowns during the conflict. However, structural demand also carries uncertainties, particularly from China given its focus on renewables.

On the supply side, the urge by OPEC member nations to flout OPEC agreements or even consider exiting the organization, as the United Arab Emirates did in May, could be limited by breakeven oil prices, which are much higher than the cost of production in many Middle Eastern countries.

The near-term setup for oil is, therefore, finely balanced, and we think our modest overweight view is warranted based on fundamental upside. While there could be an additional relief rally, the outlook appears asymmetric from here, in our view, particularly as prospects for an enduring resolution to the Middle East conflict and a fuller resumption of flows in the Strait of Hormuz remain in flux.

On gold, we’ve moved from our small overweight view to a neutral view. Our conviction has fallen materially, as the thesis has weakened from a two-engine demand story (central-bank and ETF demand) to a single propeller (central-bank demand). To reiterate a point we’ve made previously, we don’t view gold as an inflation hedge, as correlations9 are weak or nonexistent. The primary long-term relationships are negative correlations to the US dollar and real yields. We don’t see significant upside emerging in either, but a fundamental reengagement with a bull case in the dollar is a risk.

Investment Implications

  • Look for opportunities to diversify — Returns may diverge across regions and sectors based on energy vulnerabilities, creating the opportunity for active positioning to add value over passive beta.10  (Diversification doesn’t ensure a profit or protect against a loss in declining market.)

  • Don’t give up on the AI boom as a driver of the macro and earnings cycles — We still see a positive trajectory for US and EM earnings—the US because the AI innovation theme is intact, and EM because EM Asia is a lifeline for AI infrastructure. The theme can evolve and efficiencies in model usage will likely drive higher AI adoption.  

  • Consider capturing the spike in government bond yields — Rising oil prices have shifted central-bank rate expectations from easing to tightening. We think the move puts global yields at attractive valuations, with the repricing overdone, in our view, particularly given the potential for high oil prices to derail growth. Look for opportunities created by regional divergences in yields. 

  • Opportunities may be limited in credit, which should be well-supported but has tightened — Spreads have narrowed significantly, and we find little value at current levels. We think European credit has better fundamentals than the US in terms of debt service and leverage, and it’s more insulated from US private credit issues. EM debt has tightened to pre-war levels; investors may want to consider adding there opportunistically.

Talk to your financial professional about how to position your portfolio amid a changing economic landscape. 


Indices used in FIGURE 1
MSCI USA Index is a free float-adjusted market capitalization index that is designed to measure the performance of the large and mid cap segments of the US market.
MSCI Europe Index is a free-float adjusted market-capitalization-weighted index designed to measure the equity market performance of the developed markets in Europe. 
MSCI Japan Index is a free-float adjusted market-capitalization index designed to measure large- and mid-cap Japanese equity market performance.
MSCI Emerging Markets Index a free float-adjusted market capitalization-weighted index that is designed to measure equity market performance in the global emerging markets. MSCI index performance is shown net of dividend withholding tax.
ICE BofA Global Government Index is a market value-weighted benchmark designed to track the performance of investment-grade sovereign debt publicly issued and denominated in the issuer’s domestic market. 
ICE BofA US Corporate Index tracks the performance of U.S. dollar-denominated, investment-grade-rated corporate debt publicly issued in the U.S. domestic market.
ICE BofA Global High Yield Index tracks the performance of below-investment-grade corporate bonds denominated in US dollars, euros, British pounds, and Canadian dollars and issued in major global markets.
JPMorgan Emerging Markets Sovereign Index (EMBI Global Core) tracks total returns for traded external debt instruments in the emerging markets. It limits the weights of those index countries with larger debt stocks by only including specified portions of these countries’ eligible current face amounts of debt outstanding.
Dow Jones Commodity Index – Crude Oil tracks the performance of the crude oil commodities market by measuring the returns of WTI (West Texas Intermediate) crude oil futures contracts.
Dow Jones Commodity Index – Gold tracks the performance of the gold market using futures contracts.

Indices used in FIGURE 2:
Nominal: US generic 10-year Treasury yield, Eurozone 10-year yield (Wellington composite of Germany [bund], France [OAT], and Italy [BTP]), UK generic 10-year government bond (gilt) yield, Japan generic 10-year government bond (JGB) yield; Real: US 10-year inflation-linked Treasury (TIPS) real yield (constant maturity), Eurozone 10-year real yield (Wellington composite of inflation-linked bonds from Germany, France, and Italy), UK 10-year inflation-linked gilt real yield, Japan 10-year inflation linked government bond real yield. 

1 Earnings per share measures how much profit a company makes per share of common stock. 

2 Stagflation is an economic cycle characterized by slow growth, inflation, and signs of labor market weakness. 

3 Capital expenditures are funds used by a company to acquire, upgrade, and maintain physical assets such as property, plants, buildings, technology, or equipment. They are often used to undertake new projects or investments by a company.  

4 Spreads are the difference in yields between two fixed-income securities with the same maturity but originating from different investment sectors. 

5 Duration is a measure of the sensitivity of an investment’s price to nominal interest-rate movement. 

6 The yield curve is a line that plots interest rates of bonds having equal credit quality but differing maturity dates; its slope is used to forecast the state of the economy and interest-rate changes. 

7 Return on Equity is the average amount of net income returned as a percentage of shareholder’s equity over the past five years.  

8 Carry is the difference between the yield on a longer-maturity bond and the cost of borrowing. 

9 Correlation is a statistical measure of how two investments move in relation to each other. A correlation of 1.0 indicates the investments have historically moved in the same direction; a correlation of -1.0 means the investments have historically moved in opposite directions; and a correlation of 0 indicates no historical relationship in the movement of the investments.

10 Beta is a measure of risk that indicates the price sensitivity of a security or a portfolio relative to a specified market index.

Important Risks: Investing involves risk, including the possible loss of principal. • Foreign investments may be more volatile and less liquid than U.S. investments and are subject to the risk of currency fluctuations and adverse political, economic and regulatory developments. These risks may be greater, and include additional risks, for investments in emerging markets or if focused in a particular geographic region or country. • Fixed income security risks include credit, liquidity, call, duration, and interest-rate risk. As interest rates rise, bond prices generally fall. • Investments in high-yield (“junk”) bonds involve greater risk of price volatility, illiquidity, and default than higher-rated debt securities. • Investments in the commodities market may increase liquidity risk, volatility and risk of loss if adverse developments occur. • Investments in the technology sectors may go in and out of favor, which may cause underperformance.

The views expressed here are those of the authors and are based on available information and are subject to change without notice. This information should not be considered as investment advice or a recommendation to buy/sell any security. In addition, it does not take into account the specific investment objectives, tax and financial condition of any specific person. Portfolio positioning is at the discretion of the individual portfolio management teams; individual portfolio management teams and different fund sub-advisers may hold different views and may make different investment decisions for different clients or portfolios. This material and/or its contents are current as of the time of writing and may not be reproduced or distributed in whole or in part, for any purpose, without the express written consent of Wellington Management or Hartford Funds.



WP907 5729064
Insight from sub-adviser Wellington Management
Supriya Menon
Multi-Asset Portfolio Manager
Author Headshot
Product Reporting Lead

ADVISOR WEBCAST

Midyear Outlook: The Rally and the Reality

The material on this site is for informational and educational purposes only. The material should not be considered tax or legal advice and is not to be relied on as a forecast. The material is also not a recommendation or advice regarding any particular security, strategy or product. Hartford Funds does not represent that any products or strategies discussed are appropriate for any particular investor so investors should seek their own professional advice before investing. Hartford Funds does not serve as a fiduciary. Content is current as of the publication date or date indicated, and may be superseded by subsequent market and economic conditions.

Investing involves risk, including the possible loss of principal. Investors should carefully consider a fund's investment objectives, risks, charges and expenses. This and other important information is contained in the mutual fund, or ETF summary prospectus and/or prospectus, which can be obtained from a financial professional and should be read carefully before investing.

Mutual funds are distributed by Hartford Funds Distributors, LLC (HFD), Member FINRA|SIPC. ETFs are distributed by ALPS Distributors, Inc. (ALPS). Advisory services may be provided by Hartford Funds Management Company, LLC (HFMC) or its wholly owned subsidiary, Lattice Strategies LLC (Lattice). Certain funds are sub-advised by Wellington Management Company LLP and/or Schroder Investment Management North America Inc (SIMNA). Schroder Investment Management North America Ltd. (SIMNA Ltd) serves as a secondary sub-adviser to certain funds. HFMC, Lattice, Wellington Management, SIMNA, and SIMNA Ltd. are all SEC registered investment advisers. The funds and other products referred to on this Site may be offered and sold only to persons in the United States and its territories.

Hartford Funds refers to HFD, Lattice, and HFMC, which are currently not affiliated with any sub-adviser or ALPS.

On June 3, 2026, The Hartford Insurance Group, Inc. (“The Hartford”) and Wellington announced that they had reached a definitive agreement under which Wellington Investment Advisors Holdings, LLP, Wellington’s corporate parent, will acquire Hartford Funds. Upon closing Hartford Funds will be integrated into Wellington’s U.S. Wealth business. The deal is expected to close in the first quarter of 2027, subject to regulatory and fund approvals. Upon closing, Hartford Funds would become an affiliate of Wellington. For more information, click here.

© Copyright 2026 Hartford Funds Management Group, Inc. All Rights Reserved. Not FDIC Insured | No Bank Guarantee | May Lose Value