• Products
  • Insights
  • Practice Management
  • Resources
  • About Us

Cash with a roughly 5% yield is a beautiful thing. It’s been a boon to savers and acted as an offset to higher borrowing costs in mortgages, auto loans, and credit cards. It’s also cushioned consumption, which accounts for two-thirds of the US economy. According to the Commerce Department, US households are earning an additional $121 billion increase in income on investments annually versus a year ago through June.

While it’s easy to get attached to high-yielding cash, especially when it yields more than some bonds, it’s also important to understand why it may be time to consider moving into bonds. The bottom line is that holding cash while waiting until there’s more certainty in the economic outlook, the Federal Reserve’s (Fed) path, or the geopolitical environment could cost total return relative to bonds based on the past six interest-rate hiking cycles.

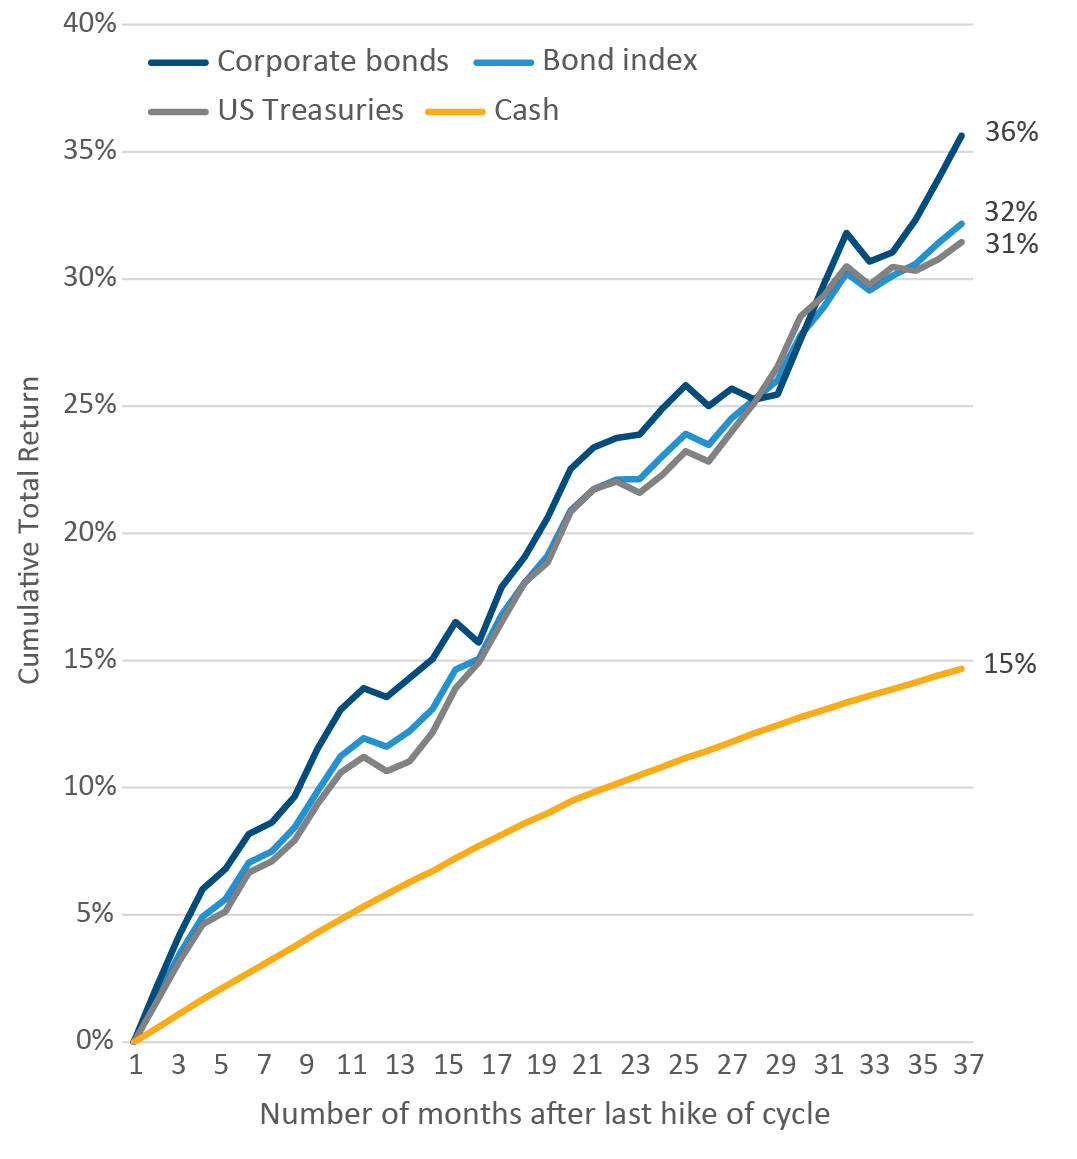
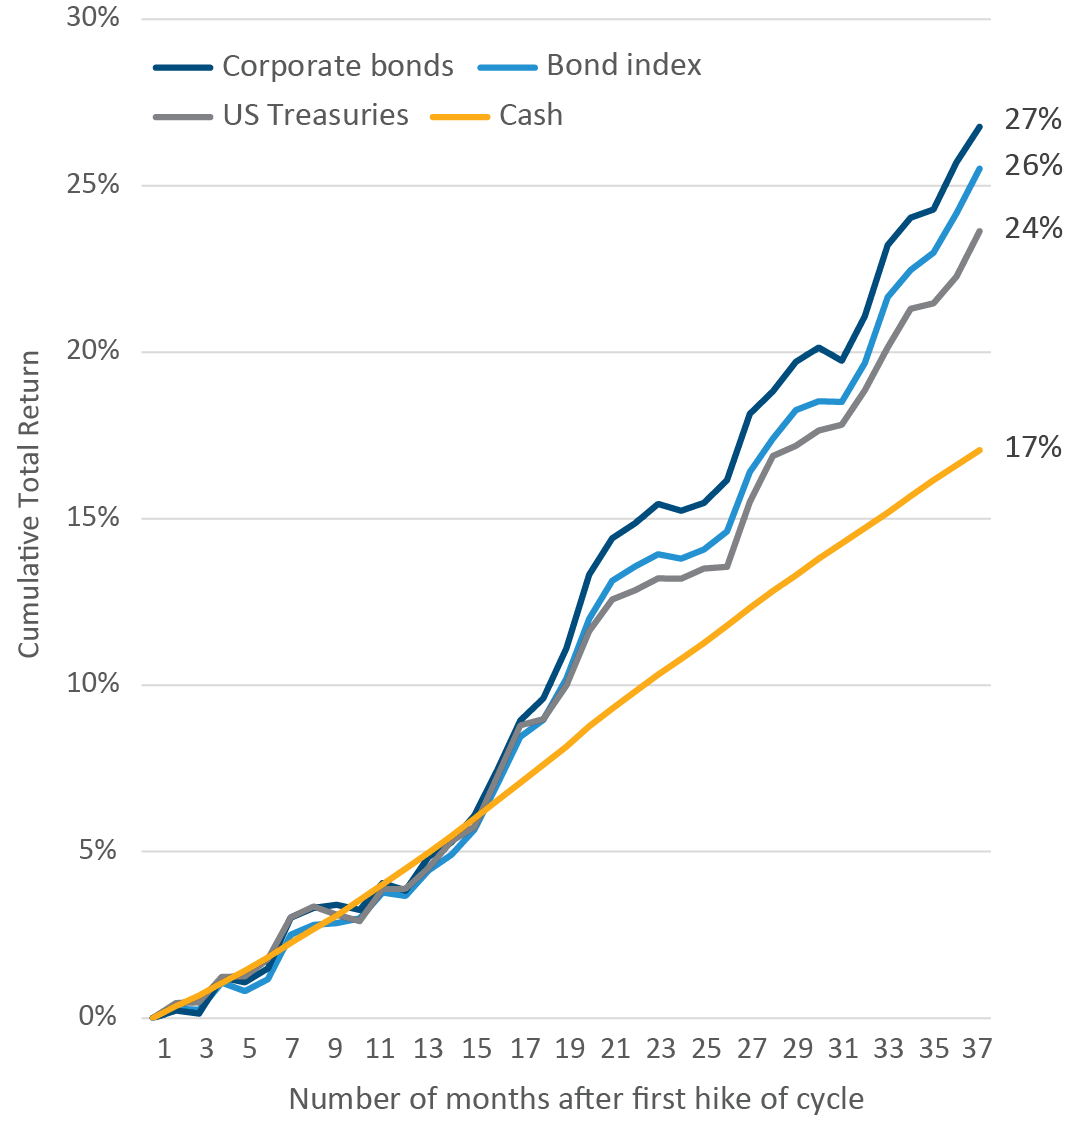
Our analysis looks at two timeframes. The first one starts at the last interest-rate hike in each Fed tightening cycle since 1983 (FIGURE 1). The second one starts at the first hike of each Fed-tightening cycle since 1983 (FIGURE 2). 

Why has the experience in bonds been superior to cash? There are three key reasons: 

1. Whether or not the investment horizon begins with the first hike or the last hike of each Fed-tightening cycle, it incorporates the next Fed easing cycle when the yield curve1 steepens with short-term rates falling.

2. The market anticipated rate cuts in each tightening cycle three to 13 months before the next rate cut, adding positive return in this period. Thus, an investor wanting to time the entry into bonds needs to be early. While bonds may not fare as well as cash if you’re early, we show that bond returns are comparable to cash in the short term, and the ensuing easing cycle more than compensates.

3. Cash also tends to suffer during easing cycles as its yield drops along with Fed interest-rate cuts.

We analyzed the three-year total returns of cash, Treasuries, bonds (as represented by the Bloomberg US Aggregate Bond Index),2 and corporate bonds (as represented by the Bloomberg US Corporate Bond Index)3 starting from the last hike of each of the past six full US Fed interest-rate tightening cycles since 1980. We also ran the same analysis giving cash an “advantage.” To do this, we began our total return analysis from the first hike instead of the last hike.

We did this because it’s less clear what a “pause” in this cycle means. It could mean a “skip” where the Fed skips a meeting before hiking again if inflation persists above target. Or it could be a longer period of policy inaction followed by the start of a new easing cycle. Thus, we wanted to see if bonds could outperform cash even after suffering drawdowns when the Fed was hiking interest rates. From the first hike, we can see that bonds may suffer relative to cash in the short term, but the ensuing easing cycle more than compensates for this and bond returns end up stronger on average during the six cycles we analyze.

FIGURE 1 illustrates that returns for all the bond strategies we observed were around double the returns of cash. FIGURE 2 shows that returns for the bond strategies were seven to 10 percentage points better than cash. In both analyses, corporate bonds outperformed Treasuries and the Bloomberg US Aggregate Bond Index due to their higher yield and periods of spread4 compression, which added net positive return.


FIGURE 1

Bond Returns Have Exceeded Cash Returns When the Starting Point Was the Last Interest-Rate Hike
Three-year cumulative return after last hike for bond, corporate, Treasury, and cash indices

Note: Each data series represents the cumulative monthly return for three years since the last hike of each tightening cycle.

FIGURE 2

Bond Returns Exceeded Cash Returns About a Year After the First Interest-Rate Hike

Three-year cumulative return after first hike for bond, corporate, Treasury, and cash indices

Note: Each data series represents the cumulative monthly return for three years since the first hike of each tightening cycle.

Past performance does not guarantee future results. Investors cannot invest directly in indices. Tightening cycles shown: March 1983-Aug 1984; March 1988-May 1989; Feb 1994-Feb 1995; June 1999-May 2000, June 2004-June 2006; and Dec 2015-Dec 2018. Please see representative index definitions below. Source: Bloomberg, 7/27/23.


What are the risks? This cycle could be different. The Fed’s inflation fight today is tougher than it has been in past economic cycles, so the Fed may keep hiking rates or may need to stay on hold for longer at these higher rate levels. Recent concerns about federal debt could also weigh on US Treasuries and increase term premia5 in long bonds. FIGURE 2 is a conservative analysis that considers the first risk. Given the speed and magnitude of this hiking cycle, which began in March 2022, and the unprecedented -13% return for the Bloomberg US Aggregate Bond Index in 2022, I have higher conviction that the Fed’s current hiking campaign is approaching the end. That being said, the potential distribution of returns in bonds is wider than cash.

As with any investment, there are relative risks to be considered. Cash or cash equivalents, such as money-market funds or CDs, generally involve the least amount of risk but also offer the least potential return. Short-term bonds are likely to offer higher potential yield than cash equivalents and are also typically less sensitive to interest-rate movements than other securities.

Bonds tend to carry greater risk than cash equivalents, including the risk that a bond’s lender may be unable to make interest or principal payments on time. Bonds with longer maturities (e.g., 10 or more years) can offer higher returns but can lose value when interest rates rise. Bonds are also subject to the risk that the lender may choose to pay off the bond early, which could deprive investors of potential interest income. When rates are falling, lenders sometimes choose to pay off bonds ahead of maturity in order to reissue bonds at lower prevailing rates.


Investment Implications

  • Investors may want to consider moving out of cash into longer maturities sooner rather than later. Even though some bonds have lower yields than cash, they've benefited materially more than cash in the past six Fed rate-hiking cycles on average. Since the market anticipates the next easing cycle, much of the positive returns accrue around the time of the last hike.
  • Corporate bonds have a better historical average return profile than Treasuries and the bond index. Because corporate bonds have higher yield and spread-tightening potential, they've tended to outperform other fixed-income sectors.
  • An incremental step out of cash into bonds isn’t as big a risk as one might expect. Even if the Fed keeps hiking, our analysis indicates that bond returns could be comparable to cash in the short term, and bonds may outperform longer term based on past cycles.

Your financial professional can help you decide the appropriate amount to hold in bonds and cash. 


1 Yield curve is a line that plots interest rates of bonds having equal credit quality but differing maturity dates; its slope is used to forecast the state of the economy and interest-rate changes.

2 Bloomberg US Aggregate Bond Index is composed of securities from the Bloomberg Government/Credit Bond Index, Mortgage-Backed Securities Index, Asset-Backed Securities Index, and Commercial Mortgage-Backed Securities Index.

3 Bloomberg US Corporate Index measures the investment-grade, fixed-rate, taxable corporate-bond market.

4 Spreads are the difference in yields between two fixed-income securities with the same maturity but originating from different investment sectors.

5 Term premia is the compensation that investors require for bearing the risk of longer maturities, which are more sensitive to changes in interest rates.

Bond index is represented by the Bloomberg US Aggregate Bond Index.
Corporate bonds are represented by the Bloomberg US Corporate Index.
Treasuries are represented by the Bloomberg US Treasury Total Return Index, which is an unmanaged index of prices of US Treasury bonds with maturities of one to 30 years.
Cash is represented by ICE BofA US 3-month Treasury Bill Index, which is comprised of a single issue purchased at the beginning of the month and held for a full month. At the end of the month that issue is sold and rolled into a newly selected issue.

Important Risks: Investing involves risk, including the possible loss of principal.  • Fixed-income security risks include credit, liquidity, call, duration, and interest-rate risk. As interest rates rise, bond prices generally fall.

The views expressed here are those of the authors and Wellington Management’s Investment Strategy Team. They should not be construed as investment advice. They are based on available information and are subject to change without notice. Portfolio positioning is at the discretion of the individual portfolio management teams; individual portfolio management teams and different fund sub-advisers may hold different views, and may make different investment decisions for different clients or portfolios. This material and/or its contents are current as of the time of writing and may not be reproduced or distributed in whole or in part, for any purpose, without the express written consent of Wellington Management or Hartford Funds.

MFGS_051823 2904301

About The Authors
Nanette Abuhoff Jacobson Headshot
Managing Director and Multi-Asset Strategist at Wellington Management Company and Global Investment Strategist for Hartford Funds

Nanette Abuhoff Jacobson consults with clients on strategic asset allocation issues and works with investment teams throughout Wellington to develop relevant investment solutions across asset classes.

Investment Strategy Analyst

The material on this site is for informational and educational purposes only. The material should not be considered tax or legal advice and is not to be relied on as a forecast. The material is also not a recommendation or advice regarding any particular security, strategy or product. Hartford Funds does not represent that any products or strategies discussed are appropriate for any particular investor so investors should seek their own professional advice before investing. Hartford Funds does not serve as a fiduciary. Content is current as of the publication date or date indicated, and may be superseded by subsequent market and economic conditions.

Investing involves risk, including the possible loss of principal. Investors should carefully consider a fund's investment objectives, risks, charges and expenses. This and other important information is contained in the mutual fund, or ETF summary prospectus and/or prospectus, which can be obtained from a financial professional and should be read carefully before investing.

Mutual funds are distributed by Hartford Funds Distributors, LLC (HFD), Member FINRA|SIPC. ETFs are distributed by ALPS Distributors, Inc. (ALPS). Advisory services may be provided by Hartford Funds Management Company, LLC (HFMC) or its wholly owned subsidiary, Lattice Strategies LLC (Lattice). Certain funds are sub-advised by Wellington Management Company LLP and/or Schroder Investment Management North America Inc (SIMNA). Schroder Investment Management North America Ltd. (SIMNA Ltd) serves as a secondary sub-adviser to certain funds. HFMC, Lattice, Wellington Management, SIMNA, and SIMNA Ltd. are all SEC registered investment advisers. Hartford Funds refers to HFD, Lattice, and HFMC, which are not affiliated with any sub-adviser or ALPS. The funds and other products referred to on this Site may be offered and sold only to persons in the United States and its territories.

© Copyright 2024 Hartford Funds Management Group, Inc. All Rights Reserved. Not FDIC Insured | No Bank Guarantee | May Lose Value