• Products
  • Insights
  • Practice Management
  • Resources
  • About Us

Our View

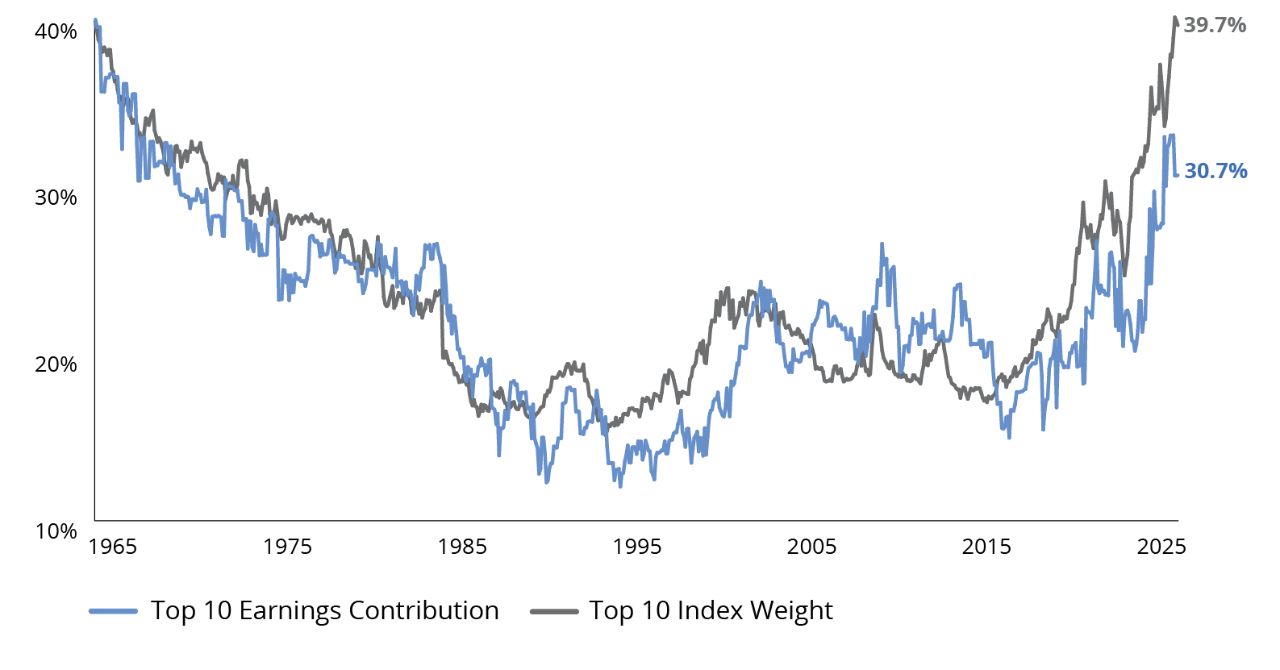
The US stock market has reached its highest concentration level in 60 years, with the top 10 stocks comprising a weighting of 39.7%.1 While there’s always an urge to proclaim “this time is different,” market history tells us that while the plot may change, the story often ends the same. 


Observations

1. The weights of the top 10 stocks have been rising much faster than their earnings, creating a widening gap between the two (FIGURE 1).

  • The last time a gap of this magnitude appeared was at the height of the dot-com bubble and, before that, the Nifty Fifty bubble of the late 1960s.
  • A stock’s placement in the top 10 tends to be short-lived and can be volatile (FIGURE 2).

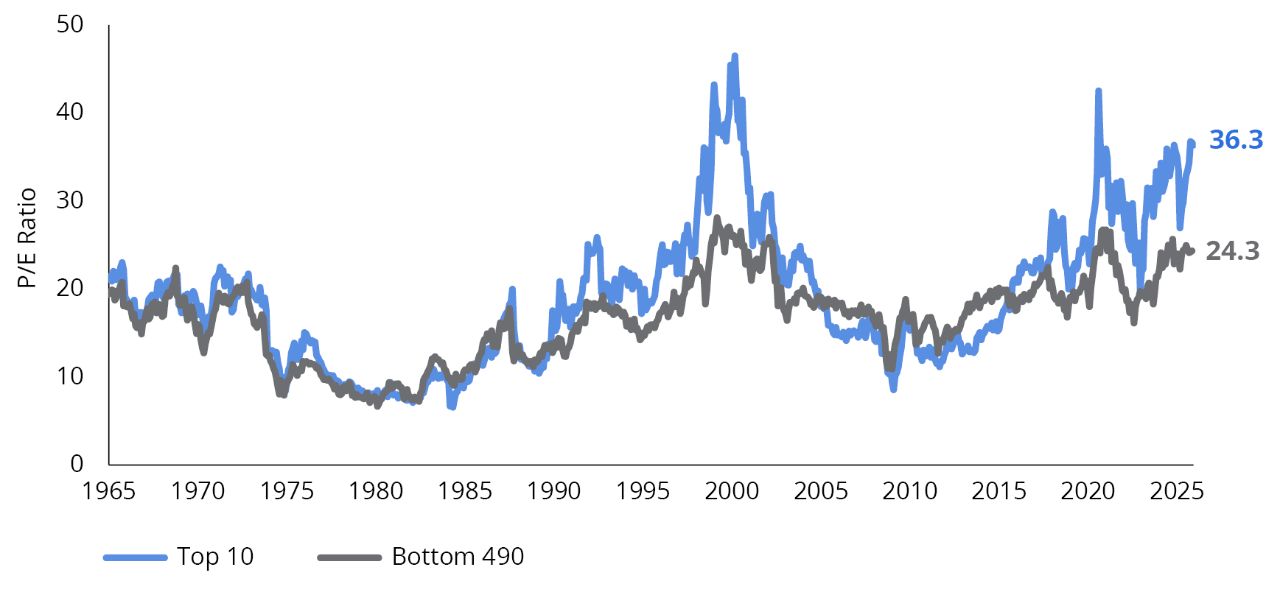
2. The price-to-earnings ratio (P/E ratio)2 of the top 10 stocks compared to the bottom 490 stocks is at an extreme not seen since the peak of the dot-com bubble (excluding the COVID-19 period, which affected earnings figures) (FIGURE 3). 

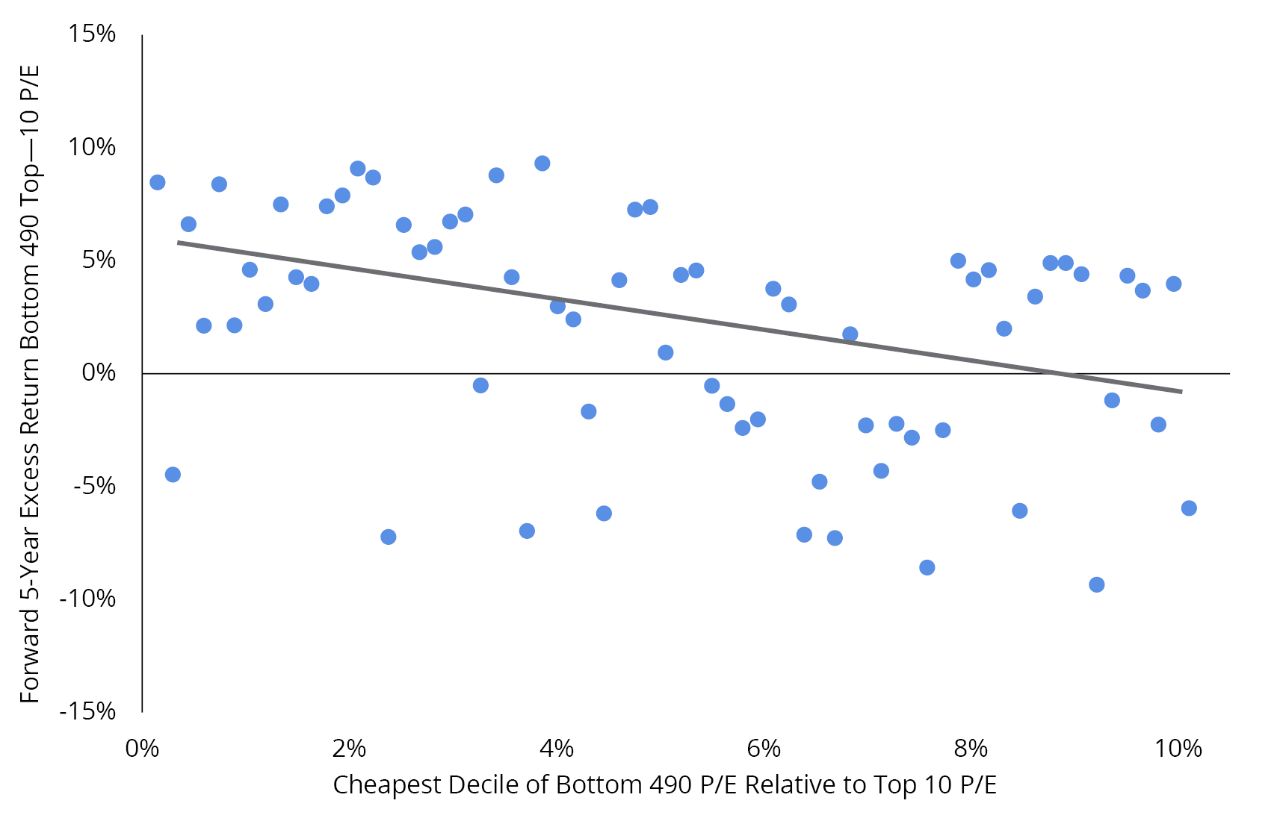
  • Historically, when the P/E ratio of the bottom 490 has been this inexpensive relative to the P/E ratio of the top 10, the bottom 490 have outperformed by 2% on average over the next five years (FIGURE 4).

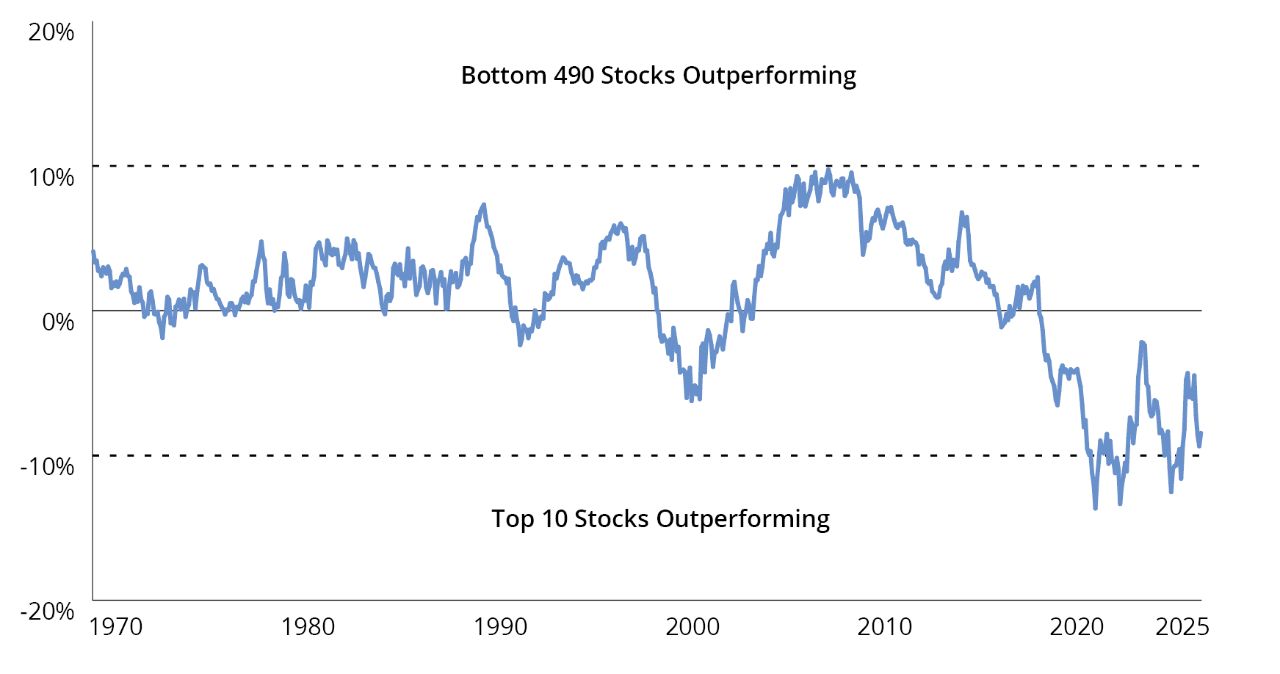
3. Even after taking into account the outperformance of the top 10 in recent years, the bottom 490 have outperformed the top 10 in 70% of 5-year rolling time periods since 1970 (FIGURE 5).

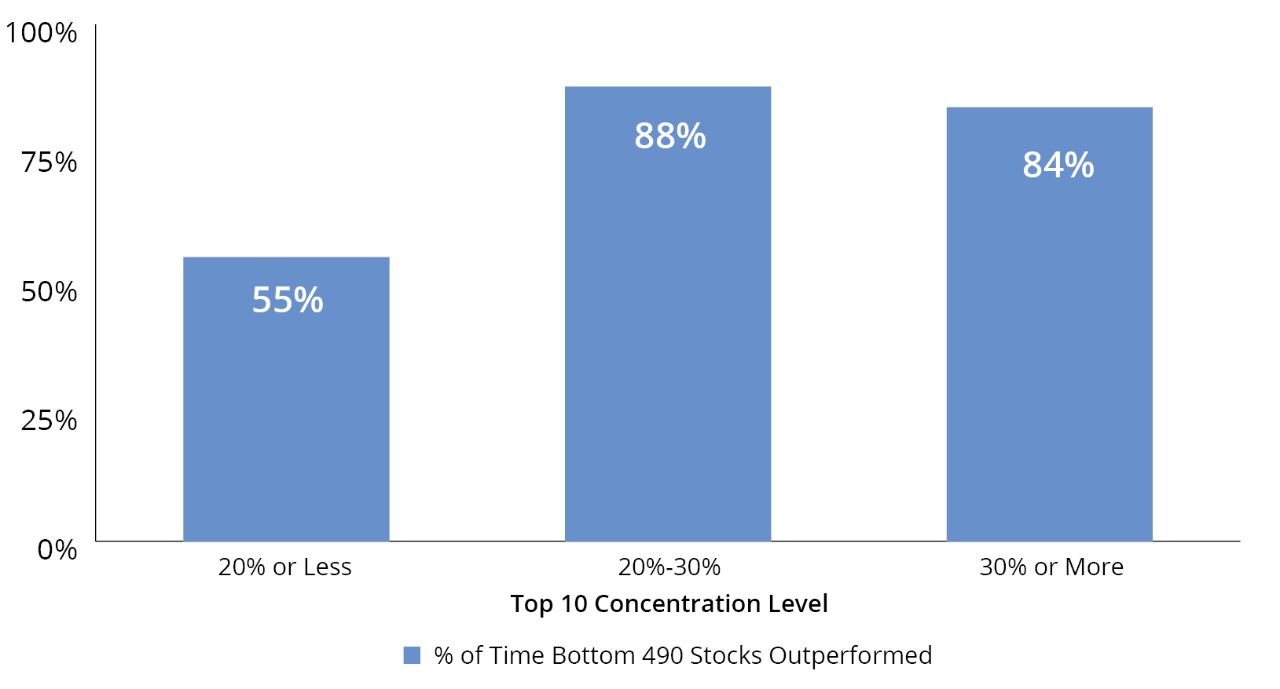
4. When concentration in the top 10 is 30% or more, the bottom 490 have historically outperformed 84% of the time over the next five years (FIGURE 6).

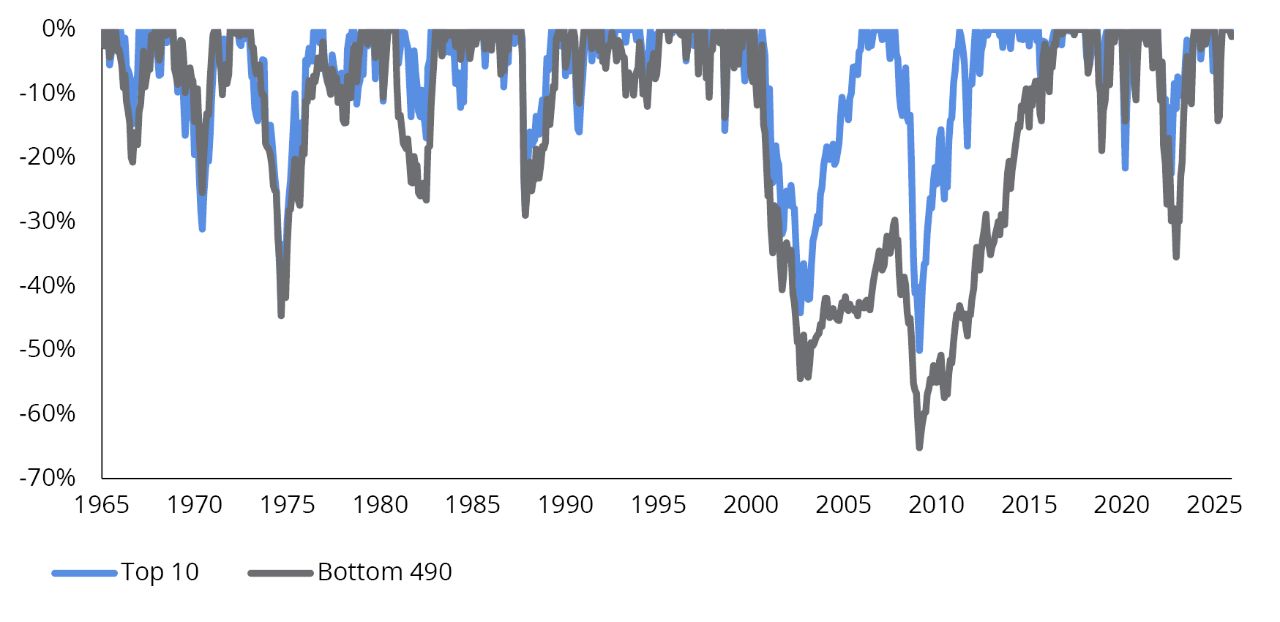
5. A rise in concentration and valuation levels often precedes a period of heightened volatility and larger drawdowns for the largest stocks (FIGURE 7).


FIGURE 1

The Gap Between the Earnings and Weights of the Top 10 Stocks Has Widened Significantly
Largest US Stocks Earnings vs. Weight (1965-2025) 

As of 12/31/25. Represents the top 10 stocks from a market cap-weighted portfolio of the largest 500 US stocks. Capitalization weighting is a method for constructing a portfolio according to the relative total market value of the stocks it’s covering. The components with higher market caps carry greater weight, while those with smaller market caps have a lower weight. Data Sources: Hartford Equity Modeling Platform and Compustat.

FIGURE 2

The 10 Largest Stocks Change Frequently From Decade To Decade 
10 Largest US Companies (Select Years From 1969-2025)

 
1969 1979 1989 1999 2009 2019 2025
International Business Machines Corp International Business Machines Corp Exxon Mobil Corp Microsoft Corp Exxon Mobil Corp Apple Inc NVIDIA Corporation
AT&T Corp AT&T Corp GE Aerospace GE Aerospace Microsoft Corp Microsoft Corp Apple Inc
General Motors Co Exxon Mobil Corp International Business Machines Corp Cisco Systems Inc Apple Inc Alphabet Inc Microsoft Corp
Exxon Mobil Corp General Motors Co AT&T Corp Walmart Inc Johnson & Johnson Amazon.com Inc Alphabet Inc
Eastman Kodak Company SLB Ltd Navient Corporation Intel Corp Procter & Gamble Co Meta Platforms Inc Amazon.com Inc
Sears Roebuck & Co Mobil Corp Altria Group Inc Lucent Technologies Inc International Business Machines Corp JPMorgan Chase & Co Broadcom Inc
Texaco Inc GE Aerospace Merck & Co Inc Exxon Mobil Corp AT&T Inc
Johnson & Johnson Meta Platforms Inc
GE Aerospace Amoco Corp E. I. du Pont de Nemours and Co International Business Machines Corp JPMorgan Chase & Co Visa Inc Tesla Inc
Xerox Holdings Corp Standard Oil Co Amoco Corp Citigroup Inc GE Aerospace Procter & Gamble Co JPMorgan Chase & Co
3M Co Chevron Corp BellSouth Corp American International Group Chevron Corp Bank of America Corp Eli Lilly and Co

As of 12/31/25. Represents the top 10 stocks from a market cap-weighted portfolio of the 500 largest US stocks. Data Sources: Hartford Equity Modeling Platform and Compustat.

FIGURE 3

The P/E Ratio of the Top 10 Stocks Is Significantly Higher Than the Bottom 490
P/E Ratio Comparison (1965-2025)

As of 12/31/25. Based on the 500 largest US stocks by market cap. Top 10 and bottom 490 portfolios are market cap-weighted and rebalanced monthly. Data Sources: Hartford Equity Modeling Platform and FactSet.

FIGURE 4

At Peak Valuation Gaps, the Bottom 490 Stocks Have Outperformed the Top 10 by an Average of 2%  
Five-Year Excess Returns: Bottom 490 Stocks Minus the Top 10 Stocks (1965-2025)

Past performance does not guarantee future results. Performance following periods of top-decile valuations based on observations from 12/31/64–12/31/25. Top 10 and bottom 490 portfolios are market cap-weighted and rebalanced monthly. Excess returns are investment returns from a security or portfolio that exceed a benchmark or index with a similar level of risk. Data Sources: Hartford Equity Modeling Platform and Compustat. 

FIGURE 5

The Bottom 490 Stocks Have Outperformed the Top 10 in 70% of Rolling 5-Year Periods
Five-Year Excess Returns: Bottom 490 Stocks Minus the Top 10 Stocks (1965-2025)

As of 12/31/25. Past performance does not guarantee future results. Based on the 500 largest US stocks by market cap. Top 10 and bottom 490 portfolios are market cap-weighted and rebalanced monthly. When the line is above 0, the bottom 490 stocks outperformed the top 10 stocks. Data Sources: Hartford Equity Modeling Platform and Compustat.  

FIGURE 6

When Top 10 Concentration Is 30% or More, the Bottom 490 Have Outperformed 84% of the Time Over the Next Five Years
Bottom 490 Stocks Five-Year Outperformance at Different Concentration Levels (1965-2025)

As of 12/31/25. Past performance does not guarantee future results. Based on the 500 largest US stocks. Top 10 and bottom 490 portfolios are market cap-weighted and rebalanced monthly. Data Sources: Hartford Equity Modeling Platform and Compustat. 

FIGURE 7

Most Drawdowns for the Top 10 Stocks Have Been Larger Than for the Bottom 490 
Top 10 vs. Bottom 490 Drawdowns (1965-2025)

As of 12/31/25. Past performance does not guarantee future results. Based on the 500 largest US stocks. Top 10 and bottom 490 portfolios are market cap-weighted and rebalanced monthly. Data Sources: Hartford Equity Modeling Platform and Compustat.

To learn more about managing concentration risk, please talk to your financial professional.


1 As of 12/31/25. Represents the top 10 stocks from a market cap-weighted portfolio of the largest 500 US stocks. Data Sources: Hartford Equity Modeling Platform and Compustat. 

2 The price-to-earnings ratio measures a company’s share price relative to its earnings-per-share and helps assess the relative value of a company’s stock.

Important Risks: Investing involves risk, including the possible loss of principal.

All information provided is for informational and educational purposes only and is not intended to provide investment, tax, accounting, or legal advice. As with all matters of an investment, tax, or legal nature, you and your clients should consult with a qualified tax or legal professional regarding your or your client’s specific legal or tax situation, as applicable. The preceding is not intended to be a recommendation or advice. Tax laws and regulations are complex and subject to change.

The views expressed here are those of the authors and should not be construed as investment advice. They are based on available information and are subject to change without notice. Portfolio positioning is at the discretion of the individual portfolio management teams; individual portfolio management teams, and different fund sub-advisers, may hold different views and may make different investment decisions for different clients or portfolios. This material and/or its contents are current as of the time of writing and may not be reproduced or distributed in whole or in part, for any purpose, without the express written consent of Hartford Funds.

ETFWP033 5150791

Insight from Hartford Funds
Author Headshot
Head of Client Portfolio Management Systematic ETFs
Author Headshot
Adam Schreiber, CFA, CAIA
Client Portfolio Manager Systematic ETFs
Author Headshot
Client Portfolio Manager Systematic ETFs