• Products
  • Insights
  • Practice Management
  • Resources
  • About Us

Taxable Bond etf

Hartford Total Return Bond ETF   

TICKER
HTRB

Actions

Taxable Bond etf

Hartford Total Return Bond ETF   
Ticker - HTRB

Diversified Sources of Return Across Multiple Perspectives

Hartford Total Return Bond ETF blends top-down strategic planning with bottom-up analysis from skilled portfolio managers―a combination designed to deliver total return and income to fixed-income investors.

HARTFORD TOTAL RETURN BOND ETF INVESTMENT PROCESS
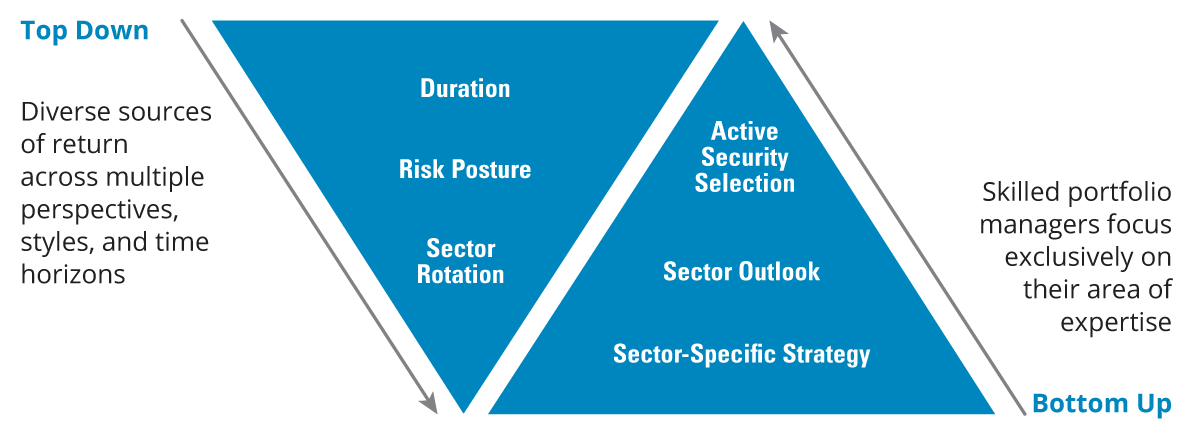
Investment Process Graph
Portfolio Management
Senior Managing Director
Fixed-Income Portfolio Manager
6
YRS
MANAGING THIS FUND
21
YRS
AT WELLINGTON MANAGEMENT
36
YRS
EXPERIENCE IN THIS INDUSTRY
Senior Managing Director
Fixed-Income Portfolio Manager
6
YRS
MANAGING THIS FUND
24
YRS
AT WELLINGTON MANAGEMENT
27
YRS
EXPERIENCE IN THIS INDUSTRY
Senior Managing Director
Fixed-Income Portfolio Manager
6
YRS
MANAGING THIS FUND
17
YRS
AT WELLINGTON MANAGEMENT
26
YRS
EXPERIENCE IN THIS INDUSTRY
Managing Director
Fixed-Income Portfolio Manager
0
YRS
MANAGING THIS FUND
13
YRS
AT WELLINGTON MANAGEMENT
20
YRS
EXPERIENCE IN THIS INDUSTRY

The portfolio managers are supported by the full resources of Wellington.

Performance

PERFORMANCE %
 
CUMULATIVE %
(as of 3/31/2024)
AVERAGE ANNUAL TOTAL RETURNS %
(as of 3/31/2024)
YTD 1YR 3YR 5YR 10YR SI 1
Hartford Total Return Bond ETF(HTRB, NAV) 0.07 3.67 -2.02 1.10 --- 1.39
Hartford Total Return Bond ETF(HTRB, Market Price) 0.15 3.54 -2.01 1.07 --- 1.40
Benchmark -0.78 1.70 -2.46 0.36 1.54 ---
Morningstar Intermediate Core-Plus Bond Category -0.20 2.91 -2.26 0.75 1.67 ---
 
CUMULATIVE %
(as of 3/31/2024)
AVERAGE ANNUAL TOTAL RETURNS %
(as of 3/31/2024)
YTD 1YR 3YR 5YR 10YR SI1
Hartford Total Return Bond ETF(HTRB, NAV) 0.07 3.67 -2.02 1.10 --- 1.39
Hartford Total Return Bond ETF(HTRB, Market Price) 0.15 3.54 -2.01 1.07 --- 1.40
Benchmark -0.78 1.70 -2.46 0.36 1.54 ---
Morningstar Intermediate Core-Plus Bond Category -0.20 2.91 -2.26 0.75 1.67 ---

SI = Since Inception. Fund Inception: 09/27/2017

Performance data quoted represents past performance and does not guarantee future results. The investment return and principal value of an investment will fluctuate so that an investor's shares, when redeemed, may be worth more or less than their original cost. Current performance may be lower or higher than the performance data quoted.

ETF shares are bought and sold at market price, not net asset value (NAV). Total returns are calculated using the daily 4:00 p.m. Eastern Time NAV. Market price returns reflect the midpoint of the bid/ask spread as of the close of trading on the exchange where Fund shares are listed. Market price returns do not represent the returns an investor would receive if they traded shares at other times. Brokerage commissions apply and will reduce returns.

Hartford Total Return Bond ETF Morningstar Ratings
Morningstar Medalist RatingTM
1/4/2024

Characteristics

Fund Essentials (as of 4/24/2024)
Ticker HTRB
Inception Date 09/27/2017
Net Assets $1,494,521,042
Total Operating Expenses 0.29%
Shares Outstanding 45,500,000
Distributor ALPS Distributors, Inc.
CUSIP 41653L305
Morningstar Category Intermediate Core-Plus Bond
Lipper Classification Core Bond Funds
FUND STATS
Turnover
69%
Dividend Frequency
Monthly
Holdings Characteristics
Yield to Worst (%)
5.43%
Turnover
69%
# of Holdings
1437
Effective Duration
6.57 yrs
Yields (%) (as of 3/31/24)
Distribution Yield at NAV
4.11
30-Day SEC Yield
4.67
Unsubsidized 30-Day SEC Yield
4.67
Credit Exposure (%)
Aaa/AAA 12
Aa/AA 72
A 10
Baa/BBB 18
Ba/BB 6
B 1
Caa/CCC or lower 0
Not Rated 2
Cash & Cash Offsets -21
Credit exposure is the credit ratings for the underlying securities of the Fund as provided by Standard and Poor's (S&P), Moody's Investors Service, or Fitch and typically range from AAA/Aaa (highest) to C/D (lowest). If S&P, Moody's, and Fitch assign different ratings, the median rating is used. If only two agencies assign ratings, the lower rating is used. Securities that are not rated by any of the three agencies are listed as "Not Rated." Ratings do not apply to the Fund itself or to Fund shares. Ratings may change.
TRADING DETAILS (as of 4/24/2024)
Ticker HTRB
CUSIP 41653L305
IOPV TICKER HTRB.IV
Stock Exchange NYSE Arca
Close $32.91
Change $-0.08
Change % -0.25%
Net Asset Value(NAV)
NAV Change
NAV Change %
Premium/Discount 0.18%
30 Day Median Bid/Ask Spread
0.03%
Top Ten Holdings (%) (as of 4/25/2024)
FNMA TBA 30 YR 6 SINGLE FAMILY MORTGAGE 5.99
US DOLLAR 4.56
FNMA TBA 30 YR 4.5 SINGLE FAMILY MORTGAGE 4.32
FNMA TBA 30 YR 5.5 SINGLE FAMILY MORTGAGE 3.97
US TREASURY N/B 11/48 3.375 1.57
FNMA TBA 30 YR 2 SINGLE FAMILY MORTGAGE 1.52
US TREASURY N/B 08/42 3.375 1.40
FNMA TBA 30 YR 2.5 SINGLE FAMILY MORTGAGE 1.32
US TREASURY N/B 02/33 3.5 1.31
US TREASURY N/B 02/34 4 1.28
Total of Top Ten Holdings % 27.24
Asset Allocation Exposure (%)
Mortgage Backed Securities 51
Investment Grade Credit 25
United States Government 24
Asset Backed Securities 10
High Yield Credit 5
Commercial Mortgage Backed Securities 4
Emerging Market Debt 1
Developed Government and Related (Non-US $) 1
Other 0
Bank Loans 0
Cash, Cash Equivalents and Cash Offsets -21
distributions and capital gains
Ex-dividend date record date payable date ordinary income short term capital gains long term capital gains total distribution
3/27/2024 3/28/2024 4/2/2024 $0.1154 $0.0000 $0.0000 $0.1154
2/27/2024 2/28/2024 3/1/2024 $0.1097 $0.0000 $0.0000 $0.1097
1/29/2024 1/30/2024 2/1/2024 $0.1054 $0.0000 $0.0000 $0.1054
12/28/2023 12/29/2023 1/3/2024 $0.1632 $0.0000 $0.0000 $0.1632
12/15/2023 12/18/2023 12/20/2023 $0.0000 $0.0000 $0.0000 $0.0000
11/28/2023 11/29/2023 12/1/2023 $0.1220 $0.0000 $0.0000 $0.1220
10/27/2023 10/30/2023 11/1/2023 $0.1084 $0.0000 $0.0000 $0.1084
9/28/2023 9/29/2023 10/3/2023 $0.1053 $0.0000 $0.0000 $0.1053
8/30/2023 8/31/2023 9/5/2023 $0.1165 $0.0000 $0.0000 $0.1165
7/28/2023 7/31/2023 8/2/2023 $0.1001 $0.0000 $0.0000 $0.1001
6/29/2023 6/30/2023 7/5/2023 $0.1209 $0.0000 $0.0000 $0.1209
5/26/2023 5/30/2023 6/1/2023 $0.0982 $0.0000 $0.0000 $0.0982
4/27/2023 4/28/2023 5/2/2023 $0.0963 $0.0000 $0.0000 $0.0963
Past distributions are not indicative of future distributions.

Fund Literature


03/31/2024 - PDF (191 KB)
This Fact Sheet summarizes the ETFs investment approach, portfolio statistics, top holdings, and the current performance.
03/31/2024 - PDF (193 KB)
Exchange-traded funds (ETFs) designed by Hartford Funds - both strategic beta and actively managed - seek to provide investors with the tools to take greater control over the risks and opportunities in their portfolios.
12/31/2023 - PDF (426 KB)
Wellington's US Broad Markets Team combines top-down perspective with bottom-up expertise.
12/31/2023 - PDF (209 KB)
This flyer provides additional detail on the Hartford Total Return Bond ETF.
12/31/2023 - PDF (195 KB)
Current quarterly commentary from our sub-adviser, which includes a performance review, attribution, statistics, and positioning and outlook for the Fund.
12/31/2023 - PDF (349 KB)
Current quarterly commentary from our sub-adviser, Wellington Management, which includes a performance review, attribution, statistics, and positioning and outlook for the Fund.
A summary of a fund's full-length prospectus that provides key information potential investors should consider before making an investment decision.
12/31/2023 - PDF (389 KB)
This Pitchbook reviews the ETF's investment approach, investment team, investment process, and general portfolio parameters.
PDF (3 KB)
An unaudited financial report, which includes a fund's financial statements. These reports are intended for shareholders and others who have reviewed the fund's prospectus.
PDF (13 KB)
A legal document that discloses essential information about a fund, including investment objectives, risks, fees, expenses, fund manager background and other information.
PDF (3 KB)
An audited financial report, which includes a fund's financial statements. These reports are intended for shareholders and others who have reviewed the fund's prospectus.
PDF (13 KB)
A document that supplements the fund's prospectus with additional information about the fund including its operations and risks.
03/31/2024 - PDF (236 KB)
Current monthly commentary from our sub-adviser, Wellington Management, which includes a performance review, attribution, and positioning and outlook for the Fund.
03/31/2024 - PDF (297 KB)
Rising yields can set the stage for higher future total returns. This flyer highlights Hartford Funds array of actively managed core fixed-income ETFs.
Morningstar's take on the Hartford Total Return Bond ETF.
Important Risks: Investing involves risk, including the possible loss of principal. The net asset value (NAV) of the Fund's shares may fluctuate due to changes in the market value of the Fund's holdings which may in-turn fluctuate due to market and economic conditions. The Fund's share price may fluctuate due to changes in the relative supply of and demand for the shares on an exchange. The Fund is actively managed and does not seek to replicate the performance of a specified index. The Fund may allocate a portion of its assets to specialist portfolio managers, which may not work as intended. • Fixed income security risks include credit, liquidity, call, duration, event, and interest-rate risk. As interest rates rise, bond prices generally fall. • The risks associated with mortgage-related and asset-backed securities as well as collateralized loan obligations (CLOs) include credit, interest-rate, prepayment, liquidity, default and extension risk. • The purchase of securities in the To-Be-Announced (TBA) market can result in higher portfolio turnover and related expenses as well as price and counterparty risk. • Derivatives are generally more volatile and sensitive to changes in market or economic conditions than other securities; their risks include currency, leverage, liquidity, index, pricing, regulatory, and counterparty risk. • Foreign investments may be more volatile and less liquid than U.S. investments and are subject to the risk of currency fluctuations and adverse political, economic and regulatory developments. These risks may be greater for investments in emerging markets. • Investments in high-yield ("junk") bonds involve greater risk of price volatility, illiquidity, and default than higher-rated debt securities. • Obligations of U.S. Government agencies are supported by varying degrees of credit but are generally not backed by the full faith and credit of the U.S. Government. • Restricted securities may be more difficult to sell and price than other securities. • The Fund may have high portfolio turnover, which could increase its transaction costs and an investor's tax liability. • In certain instances, unlike other ETFs, the Fund may effect creations and redemptions partly or wholly for cash, rather than in-kind, which may make the Fund less tax-efficient and incur more fees than an ETF that primarily or wholly effects creations and redemptions in-kind.

BLOOMBERG® and any Bloomberg Index are service marks of Bloomberg Finance L.P. and its affiliates, including Bloomberg Index Services Limited ("BISL"), the administrator of the indices (collectively, "Bloomberg") and have been licensed for use for certain purposes by Hartford Funds. Bloomberg is not affiliated with Hartford Funds, and Bloomberg does not approve, endorse, review, or recommend any Hartford Funds product. Bloomberg does not guarantee the timeliness, accurateness, or completeness of any data or information relating to Hartford Fund products.

Transactions in ETF shares will result in brokerage commissions and will generate tax consequences. All regulated investment companies are obliged to distribute portfolio gains to shareholders.
IOPV, or Indicative Optimized Portfolio Value, is a calculation disseminated by the stock exchange that approximates the Fund's NAV every fifteen seconds throughout the trading day.
Premium/discount reflects the relationship between an ETF's market price and its net asset value (NAV). Because ETFs are traded on an exchange, their market prices are in part driven by supply and demand dynamics. The ETF's market price may be above its NAV (reflecting a premium) or below its NAV (reflecting a discount).
Sources for all data: Hartford Funds and Wellington Management.
3404599 HFA002324

The material on this site is for informational and educational purposes only. The material should not be considered tax or legal advice and is not to be relied on as a forecast. The material is also not a recommendation or advice regarding any particular security, strategy or product. Hartford Funds does not represent that any products or strategies discussed are appropriate for any particular investor so investors should seek their own professional advice before investing. Hartford Funds does not serve as a fiduciary. Content is current as of the publication date or date indicated, and may be superseded by subsequent market and economic conditions.

Investing involves risk, including the possible loss of principal. Investors should carefully consider a fund's investment objectives, risks, charges and expenses. This and other important information is contained in the mutual fund, or ETF summary prospectus and/or prospectus, which can be obtained from a financial professional and should be read carefully before investing.

Mutual funds are distributed by Hartford Funds Distributors, LLC (HFD), Member FINRA|SIPC. ETFs are distributed by ALPS Distributors, Inc. (ALPS). Advisory services may be provided by Hartford Funds Management Company, LLC (HFMC) or its wholly owned subsidiary, Lattice Strategies LLC (Lattice). Certain funds are sub-advised by Wellington Management Company LLP and/or Schroder Investment Management North America Inc (SIMNA). Schroder Investment Management North America Ltd. (SIMNA Ltd) serves as a secondary sub-adviser to certain funds. HFMC, Lattice, Wellington Management, SIMNA, and SIMNA Ltd. are all SEC registered investment advisers. Hartford Funds refers to HFD, Lattice, and HFMC, which are not affiliated with any sub-adviser or ALPS. The funds and other products referred to on this Site may be offered and sold only to persons in the United States and its territories.

© Copyright 2024 Hartford Funds Management Group, Inc. All Rights Reserved. Not FDIC Insured | No Bank Guarantee | May Lose Value