Pre-Sales Support
Mutual Funds and ETFs - 800-456-7526
Monday-Thursday: 8:00 a.m. – 6:00 p.m. ET
Friday: 8:00 a.m. – 5:00 p.m. ET
Post-Sales and Website Support
888-843-7824
Monday-Friday: 9:00 a.m. - 6:00 p.m. ET
In any crisis, “playing it safe” to avoid losing your money can seem like the only rational strategy. However, in the past 60 years, we’ve seen repeating patterns of crises. Despite these crises, the market has been resilient. The Dow Jones Industrial Average rose from 679 points in 1959 to over 50,000 in 2026.1 Regardless of the type of crisis, history shows that long-term investors who stayed the course through crises and didn’t lose sight of their financial goals have been rewarded.
There’s Always a Reason to Panic: 30%+ Drops in the S&P 500 Index 1960–20252
When the market is declining and the news is depressing, the urge to panic and “play it safe” can be intense. How an investor chooses to respond to this turmoil can dramatically affect his or her long-term performance. Investors are more likely to find the courage to re-enter the market after things quiet down. Unfortunately, by this time, they’ve already missed much of the recovery.
 -36% 11/29/68-5/26/70 Interest rates rose above 9% Vietnam War |
 -48% 1/11/73- Middle East oil embargo Watergate |
 -34% 8/25/87- Black Monday: the Dow Jones Industrial Average dropped 22% in a single day |
 -37% 3/24/00- Dot-com bubble Accounting scandals 9/11 |
 -34% 1/4/02- WorldCom collapse Tyco executives indicted Ford closes five plants |
 -57% 10/9/07- Housing bubble Financial crisis |
 -34% 2/19/20- Global pandemic |
|
-36% 11/29/68-5/26/70 Interest rates rose above 9% Vietnam War |
|
-48% 1/11/73-10/3/74 Middle East oil embargo Watergate |
|
-34% 12/4/87-10/19/87 Black Monday: the Dow Jones Industrial Average dropped 22% in a single day |
|
-37% 3/24/00-9/21/01 Dot-com bubble Accounting scandals 9/11 |
|
-34% 1/4/02-10/9/02 WorldCom collapse Tyco executives indicted Ford closes five plants |
|
-57% 10/9/07-3/9/09 Housing bubble Financial crisis |
|
-34% 2/19/20-3/23/20 Global pandemic |
*PAST PERFORMANCE DOES NOT GUARANTEE FUTURE RESULTS. Indices are unmanaged and not available for direct investment.
First, Stress, Anxiety, and Crises
When major tariff announcements hit, viewers flock to financial news. After the Trump administration’s early‑April tariff rollout, CNBC’s audience during market hours jumped 36%, while Fox Business also saw strong gains, up 15% to 22% compared with prior weeks.3
In addition to more news consumption, we’re searching CNBC more often to see how the market is performing. All this news watching and Googling can make us more anxious about the economy.
When we’re anxious, we’re more likely to allocate our attention to negative information. Given the choice between information that may offer an optimistic perspective or data that paints a bleak future, an anxiety-influenced investor may naturally focus on threatening information.
When the Market Drops, We Search, Especially for CNBC
2025 Tariff Announcements: CNBC Google Searches vs. S&P 500 Index
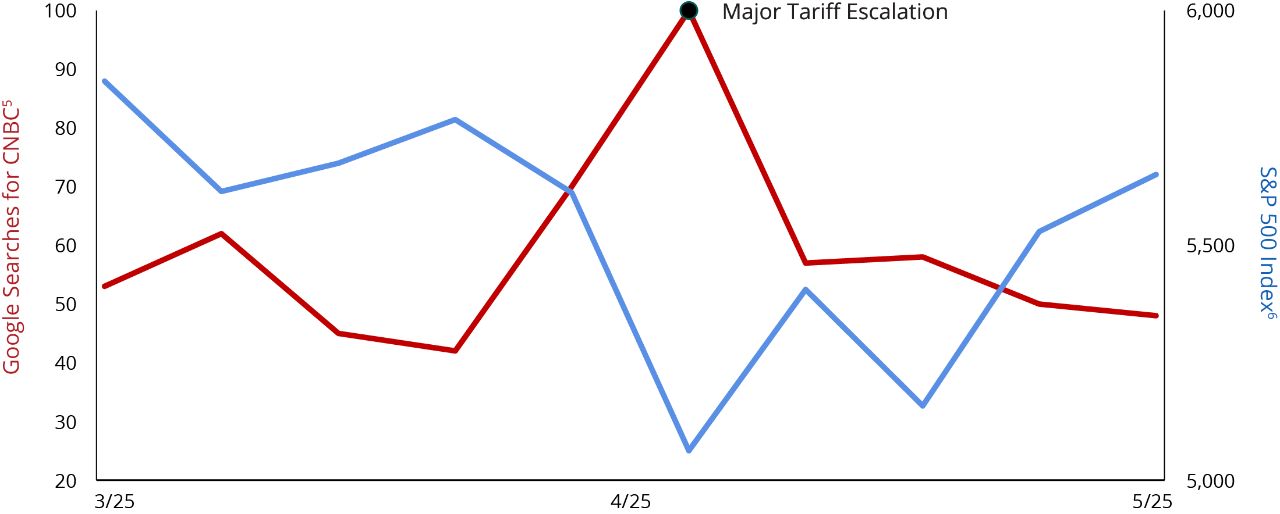
This is a time‑period snapshot of Google searches for “CNBC” compared with S&P 500 Index performance. The blue line represents the S&P 500 Index and the red line represents Google searches. Do you see a pattern? There’s a correlation between poor market performance and CNBC searches.
Past performance does not guarantee future results. See below for index descriptions. For illustrative purposes only. Indices are unmanaged and not available for direct investment.
Google Trends Methodology: Google Trends enables you to compare the world’s interest in various internet topics; it shows how frequently topics have been searched on Google over time. The numbers on the graph reflect how many searches have been done for a particular term, relative to the total number of searches done on Google over time. They don’t represent absolute search volume numbers, because the data is normalized and presented on a scale from 0-100. Each point is scaled relative to the highest point (100). A rising line for a search term indicates a growth in the term’s popularity.
Second, The Risk of Mistakes
Let’s face it, there are good reasons to be anxious about a crisis’ effect on our economy. When anxiety increases, many investors respond by trying to make their portfolios safer. In 2025, total assets in cash investments reached an astounding $19.9 trillion.4 Cash investments may provide a sense of security because of their perceived benefit of principal stability.
Making a portfolio safer seems perfectly rational during a crisis. Nobody likes losing money, especially when the market plunges. The pain of losing money is psychologically about twice as intense as the pleasure of gaining it.7 When the market drops 30% or more, that pain and temptation to make a portfolio safer can intensify. Since 1960, the market dropped more than 30% seven times.2
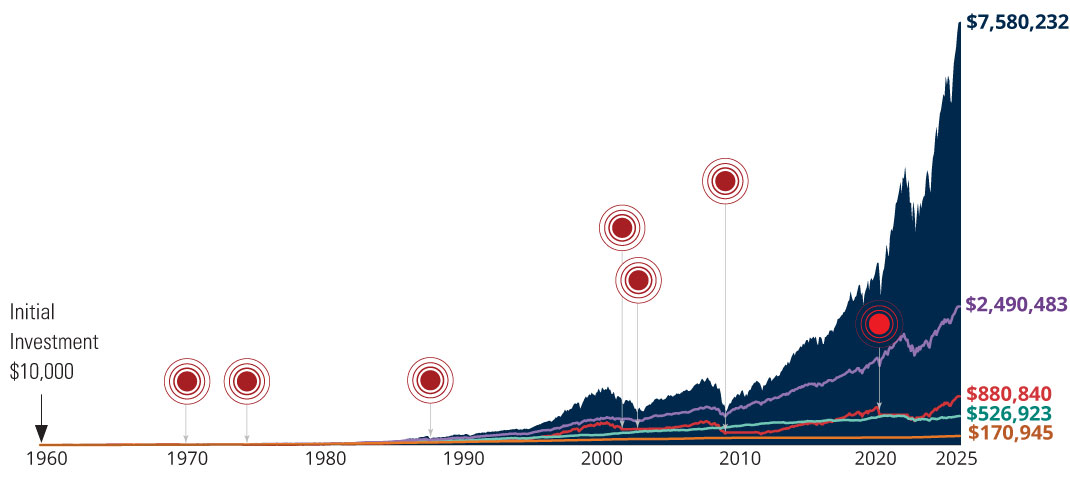
Although safer investments can calm our anxiety when the market’s tumbling, choosing safety can be a mistake for long-term investors. The graph below illustrates how a hypothetical “reactionary” investor, who made their portfolio safe when the market dropped 30%, missed gains time and time again during market recoveries. The reactionary investor traded long-term results for short-term comfort.
The Price Of Panic
Despite repeated, sometimes verbatim, predictions of dire global catastrophe or outrageous economic boom, the markets have been resilient to either hyped extreme.
$10,000 Investment (1960–2025)10
■
|
Equity Investor S&P 500 Index
|
■
|
Balanced Investor 50% Stocks 50% US Investment Grade Bonds
|
■
|
Bond Investor US Investment Grade Bonds
|
■
|
Reactionary Investor Invests in the S&P 500 Index, moves 100% into cash (noted by the red circles), then moves 100% back into the S&P 500 Index two years later
|
■
|
Cash Investor Treasury Bills
|
 |
Market Drops of more than 30%
|
Indexes represented for each asset class:
Equity: S&P 500 Index; Bonds: IA SBBI Long Term Government Index through 12/31/1975, Bloomberg US Agg thereafter; Cash: IA SBBI US 30 Day T-Bill Index until 11/30/91 and by the Bloomberg US Treasury Bill 1-3 Month Index thereafter
Past performance does not guarantee future results. See below for index descriptions. For illustrative purposes only. Indices are unmanaged and not available for direct investment. US Treasury securities are backed by the full faith and credit of the US Government. Equities and bonds are subject to risks and may not be suitable for all investors.
Third, Maintaining Perspective in Crises
Nobody likes to go through a crisis alone. Trying to manage your investments by yourself in a crisis, with extreme market volatility, can be mind-boggling. In March of 2020, the Dow swung several times between 6–12% a day in both directions. One day the Dow Jones Industrial Average was down almost 3,000 points and a few days later up over 2,000 points.8 It can be unnerving to hear “worst day ever” and then “best day ever” in terms of market point moves.
Many investors try to time the market’s ups and downs and change their portfolio investments accordingly. Research shows that this strategy hasn’t worked well for investors. Dalbar’s “Quantitative Analysis of Investor Behavior” has measured the effects of investor decisions to buy, sell, and switch into and out of mutual funds over short and long-term time frames. The results consistently show that the average investor returns are less—often much less—than market indices’ returns.9
Hopping in and out of investments to prevent losses or capture gains is a primary reason why investors have underperformed the market. Anxious investors tend to overestimate the risk of holding stock investments and underestimate the risk of not holding them.
Over the past 30 years, the average equity fund investor earned a 10.00% annualized return vs. a 10.92% annualized return of the S&P 500 Index.9 The average bond investor earned -0.05% vs. a 4.56% return of the Bloomberg US Aggregate Bond Index.9 The bottom line: investor behavior can undermine investment performance.
That’s why it’s important to have the support of a financial professional who can help you control impulsive reactions to market volatility and practice disciplined investing. In addition to helping you find appropriate investments for your financial goals, your financial professional plays a more crucial role by acting as a counter to the market’s mind games that can tempt even experienced investors.
“But It’s Different This Time”
Many feel that the current crisis is different than previous crises. It is. Every crisis is different. With all the news coverage, we can feel like today is bad and tomorrow will be worse. It’s easy to get overwhelmed with pessimism. But despite all the bad news, there’s amazing innovation taking place that won’t get media attention.
Neuralink has implanted brain‑computer interfaces in 21 people, helping those with severe paralysis control computers by thought alone, while preparing automated surgeries and mass‑production of its devices for 2026.11 Waymo now delivers over 1 million monthly robotaxi rides in California and plans expansions to San Diego, Dallas, Miami, and Orlando.12 Meta has completed much of the world’s longest undersea cable, now linking 33 countries across three continents.13 Agentic AI helpers will help adults 50+ manage bills, avoid scams, organize health info, plan simple trips, and streamline daily routines—practical support older adults want.14
The US has experienced 27 bear markets since 1929.2 Our recovery record? 27 for 27. While we can’t predict the future, as Warren Buffett has said, “It’s never paid to bet against America.”
To Summarize
First, crises influence us to focus on the negative. The flood of 24/7 crisis news coverage can contribute to our anxiety about the economy. Second, anxiety makes us more vulnerable to making investment mistakes that can damage our long-term results. Third, consider working with a financial professional to help you maintain a long-term perspective through the crisis.
Next Step
Talk to your financial professional to hear their perspective on this crisis. If you don’t have one, consider finding one.
| Financial Professionals: This article is based off of our popular Media Replay content. |
Investing involves risk, including the possible loss of principal. Fixed income security risks include credit, liquidity, call, duration, and interest-rate risk. As interest rates rise, bond prices generally fall.
This material is provided for educational purposes only.
Sources:
1Yahoo Finance, 2026
2Ned Davis Research, 2025
3Market Chaos Fuels Viewing Spike for Cable Business Channels, The Hollywood Reporter, 4/8/25
4Board of Governors of the Federal Reserve System (US), Q3 2025
5Google Trends, 12/25
6FactSet, 2025
7Kahneman, D., & Tversky, A. (1977). Prospect Theory: An Analysis of Decision Making Under Risk
8The Dow’s biggest single-day gains and losses in history, Fox Business, 11/9/20
9Quantitative Analysis of Investor Behavior, Dalbar, 2025
10Ned Davis Research and Morningstar, 2025
11Elon Musk has already tapped into the brains of 21 people, thousands more to follow in 2026 with mass production of Neuralink chip, 3DVF, 2/8/26
12Waymo says it reached 10 million robotaxi trips, doubling in five months, CNBC 5/20/25
13Announcing the Completion of the Core 2Africa System: Building the Future of Connectivity Together, Engineering at Meta, 11/17/25
14Older Adults Want AI to Show Up in Practical Ways, AARP, 1/13/26
Dalbar’s Quantitative Analysis of Investor Behavior Methodology - Dalbar’s Quantitative Analysis of Investor Behavior uses data from the Investment Company Institute (ICI), Standard & Poor’s, and Bloomberg Index Products to compare mutual fund investor returns to an appropriate set of benchmarks. Covering the period from January 1, 1995 to December 31, 2024, the study utilizes mutual fund sales, redemptions and exchanges each month as the measure of investor behavior. These behaviors reflect the “average investor.” Based on this behavior, the analysis calculates the “average investor return” for various periods. These results are then compared to the returns of respective indices.
Average equity investor and average bond investor performance results are calculated using data supplied by ICI. Investor returns are represented by the change in total mutual fund assets after excluding sales, redemptions, and exchanges. This method of calculation captures realized and unrealized capital gains, dividends, interest, trading costs, sales charges, fees, expenses, and any other costs. After calculating investor returns in dollar terms, two percentages are calculated for the period examined: total investor return rate and annualized investor return rate. Total investor return rate is determined by calculating the investor return dollars as a percentage of the net of the sales, redemptions, and exchanges for each period.
Hartford Mutual Funds may or may not be invested in the companies referenced herein; however, no particular endorsement of any product or service is being made. This material is provided for educational purposes only.
Index Descriptions
Indices are unmanaged, and unavailable for direct investment, and do not represent the performance of any Hartford Funds.
Dow Jones Industrial Average is a price-weighted average of 30 significant stocks traded on the New York Stock Exchange and the Nasdaq.
S&P 500 Index is a market capitalization-weighted price index composed of 500 widely held common stocks.
Bloomberg US Aggregate Bond Index is composed of securities that cover the US investment-grade fixed rate bond market, with index components for government and corporate securities, mortgage pass-through securities, and asset-backed securities.
Bloomberg US Treasury Bill 1–3 Month Index is designed to measure the performance of public obligations of the US Treasury that have a remaining maturity of greater than or equal to 1 month and less than 3 months.
IA SBBI US 30 Day T-Bill Indexmeasures the performance of a single issue of outstanding Treasury bill which matures closest to, buy not beyond, one month from the rebalancing date. The issue is purchased at the beginning of the month and held for a full month; at the end of the month that issue is sold and rolled into a newly selected issue.
IA SBBI LT Government Index measures the performance of a single issue of outstanding US Treasury note with a maturity term of around 5.5 years.
“Bloomberg®” and any Bloomberg Index are service marks of Bloomberg Finance L.P. and its affiliates, including Bloomberg Index Services Limited (“BISL”), the administrator of the indices (collectively, “Bloomberg”) and have been licensed for use for certain purposes by Hartford Funds. Bloomberg is not affiliated with Hartford Funds, and Bloomberg does not approve, endorse, review, or recommend any Hartford Funds product. Bloomberg does not guarantee the timeliness, accurateness, or completeness of any data or information relating to Hartford Fund products.