• Products
  • Insights
  • Practice Management
  • Resources
  • About Us

In today’s market environment, investors are increasingly seeking strategies that manage volatility while still offering growth potential. One such approach is dividend-paying stocks, which can help reduce turbulence during uncertain periods. Beyond this, dividends offer added appeal: They provide a tangible return on investment and may signal a company’s financial health and strategic discipline.

By potentially cushioning against market declines and offering exposure to historically resilient sectors, dividends can be a valuable investing strategy in challenging economic times.


1. Potential Sign of Corporate Strength

Though an obvious draw of dividend-paying stocks is income that contributes to total return, they may also hint at a company’s character and strategy. In times of market uncertainty, investors tend to seek out companies that display resilience and a history of long-term performance. Dividend-paying companies frequently fit this profile, as their ability to return capital to shareholders on an ongoing basis generally reflects a well-established business with a strong market footprint. These companies typically operate in well-understood industries with proven business models, making them less susceptible to the dramatic swings that can affect younger, growth-oriented companies.

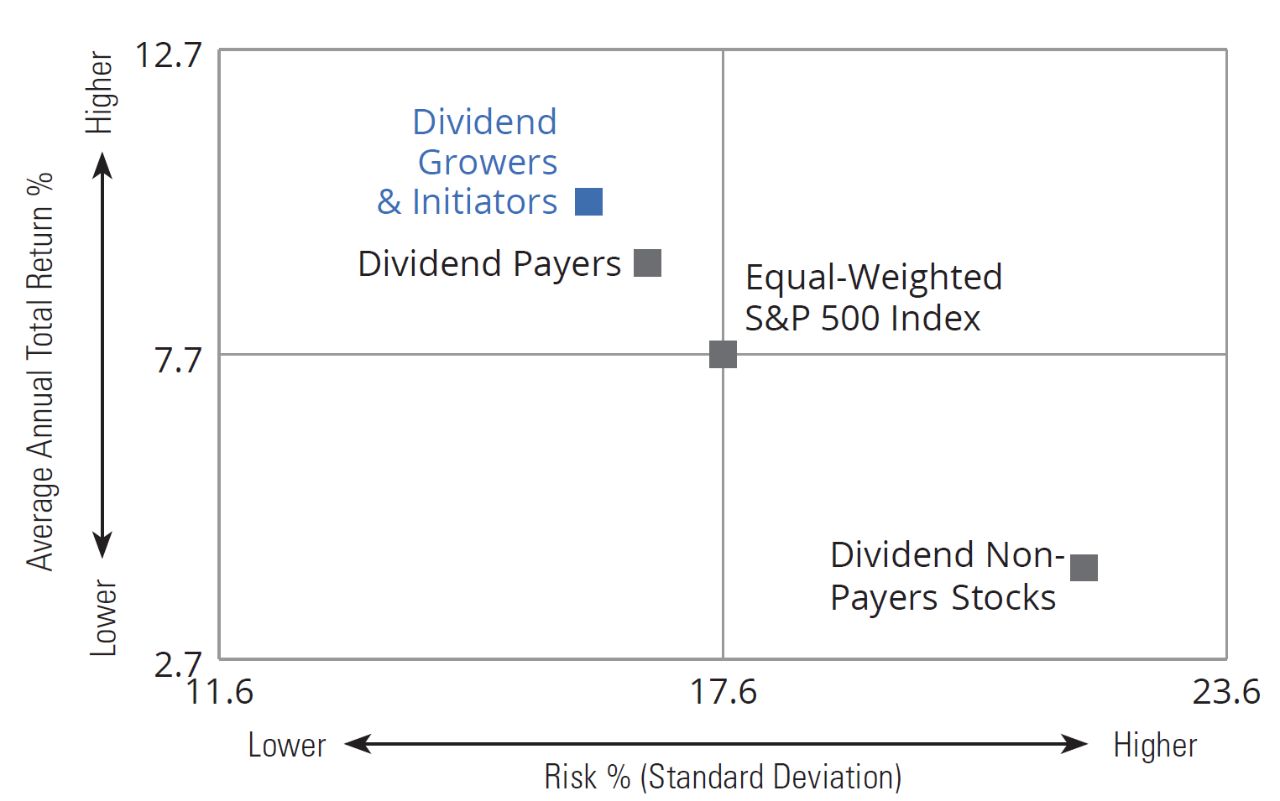
This link between dividend payments and stronger, less volatile performance shows up in the data, too: A study by Ned Davis Research makes it clear that non-dividend-paying companies and those that cut their dividends have historically underperformed their peers. Companies that opted not to pay dividends were not only more volatile (as measured by standard deviation1) but also underperformed compared to those that grew, initiated, or maintained a dividend (FIGURE 1).

FIGURE 1

Companies That Grew or Initiated a Dividend Had Higher Returns and Less Risk
Average Annual Returns and Volatility by Dividend Policy, S&P 500 Index

Chart data: 1/1/73–3/31/25. Past performance does not guarantee future results. Indices are unmanaged and not available for direct investment. Companies were categorized based on dividend activity over the prior 12 months: Dividend Payers, Growers/Initiators (companies that raised or began paying dividends), and Non-Payers. Classifications were maintained for 12 months unless dividend policy changed. Returns reflect geometric averages with monthly rebalancing. The equal-weighted S&P 500 Index is a price index composed of 500 widely held common stocks, with each constituent equally weighted, offering a more balanced alternative to market capitalization-weighted indices. For illustrative purposes only. Data Sources: Ned Davis Research and Hartford Funds, 4/25.


Consistent dividend payments generally require a track record of profitability and predictable cash flow, both of which are attractive qualities during bouts of volatility. While their generally reliable track record may reassure investors, their past resilience and dividend potential may help soften the effects of a downturn. Moreover, paying dividends takes careful planning and management, reflecting a commitment to strategic discipline and prudent capital allocation. This approach is often linked to strong governance and a long-term growth mindset.

Altogether, the qualities that typically define dividend-paying companies—financial strength, disciplined management, and a track record of performance—can be especially valuable when markets turn turbulent.


In decades in which stock returns were in the single digits, dividends accounted for a much larger share of total returns. 


2. Greater Historical Resilience in Market Downturns

This resilience has been evident during past market declines, as dividend-paying stocks have often acted as a cushion by providing income when overall returns were limited or negative. That role became even more pronounced during periods of muted market performance: In previous decades in which stock returns were in the single digits (noted by gold boxes), dividends accounted for a much larger share of total return (FIGURE 2).


FIGURE 2

When Markets Have Struggled, Dividends Delivered
S&P 500 Index Annualized Total Return by Decade (%)

■ Total Return    ■ Dividend Contribution of Total Return 

Chart Data: 1940-3/31/25. Past performance does not guarantee future results. Indices are unmanaged and not available for direct investment. * Total return for the S&P 500 Index was negative for the 2000s, but dividends provided a 1.8% annualized return over the decade. Total return is the actual rate of return of an investment over a given evaluation period, including interest, capital gains, dividends, and distributions realized during that time. For illustrative purposes only. Data Sources: Morningstar and Hartford Funds, 4/25.


Even more, dividend-paying companies have historically outperformed their non-dividend-paying counterparts during such periods. This trend speaks to the underlying fundamentals and maturity of these companies, which can help their stocks withstand more challenging market environments.


When the broader market has suffered a drawdown of 10% or more, dividend-paying stocks have held up better than those that don’t distribute dividends.


When the broader market (as represented by the S&P 500 Index) has suffered a drawdown of 10% or more, dividend-paying stocks have held up better than those that don’t distribute dividends. Since 1975, our analysis shows that dividend-paying stocks declined by 14.44% during major market drawdowns. By contrast, the equal-weighted S&P 500 Index fell by 19.89%, and non-dividend-paying stocks dropped even more sharply, with an average decline of 28.16%.2 In other words, while all segments experienced losses, dividend-paying stocks registered smaller declines—outperforming non-dividend payers by 13.72% and the equal-weighted S&P 500 Index by 5.45% (FIGURE 3).


FIGURE 3

Dividend-Paying Stocks Have Outperformed During Significant Declines
Relative Return Differential During 10%+ Annual Drawdowns of the S&P 500 Index

Chart data: 4/30/75-3/31/25. Past performance does not guarantee future results. Indices are unmanaged and not available for direct investment. The chart compares the performance of dividend-paying stocks within the S&P 500 Index to both dividend non-payers and the equal-weighted S&P 500 Index during market declines of 10% or more. While dividend-paying stocks still posted negative returns, they experienced smaller relative drawdowns. For illustrative purposes only. Data Sources: Ned Davis Research and Hartford Funds, 4/25..


3. Exposure to Less Economically Sensitive Sectors

Beyond performance metrics, it’s also important to consider the sector composition of dividend-paying stocks. These companies are often concentrated in industries that tend to be less sensitive to broader economic fluctuations.

While the profile of dividend-paying companies has evolved over time, many continue to operate in sectors that provide essential goods and services—areas where demand remains relatively stable regardless of economic conditions. This structural bias can significantly influence how dividend-paying stocks perform, particularly during periods of market volatility or economic uncertainty.

Because these sectors don’t carry as much weight in traditional cap-weighted indices3 such as the S&P 500 Index, dividend strategies offer exposure that can help round out portfolios that are heavily tilted toward the benchmark.

Traditional defensive sectors such as utilities, consumer staples, and healthcare have recently delivered dividend yields above the market average (FIGURE 4).4 Companies in these sectors, among others, typically benefit from stable earnings, lower volatility, and robust balance sheets. Their defensive characteristics can make them especially appealing to investors who are seeking strategies that may potentially mitigate risk while maintaining income exposure.


FIGURE 4

Traditional Defensive Sectors in the S&P 500 Index Have Offered Above-Market Dividend Yields
Sector Weightings, Dividend Yields, and Top-Yielding Companies

 
S&P 500 Index Sector Sector Weight (%) Sector Dividend
Yield (%)
Highest-Yielding 
Company in the Sector
Real Estate 2.3 3.3 Crown Castle Inc.
Energy 3.7 3.1 APA Corporation
Utilities 2.5 2.9 AES Corporation
Consumer Staples 6.1 2.4 Walgreens Boots Alliance, Inc.
Materials 2.0 2.0 Dow Inc.
Healthcare 11.2 1.7 Pfizer Inc.
Financials 14.7 1.5 Franklin Resources
Industrials 8.5 1.4 United Parcel Service, Inc.
Communication Services 9.2 1.0 Verizon Communications
Consumer Discretionary 10.3 0.7 Ford Motor Co.
Information Technology 29.6 0.7 Skywork Solutions, Inc.

As of 3/31/25. Past performance does not guarantee future results. Sector dividend yield is the weighted average dividend yield of all dividend-paying companies within a specific sector, expressed as a percentage of their share prices. Data Source: FactSet, 4/25.


Putting Dividends to Work

There are a variety of ways for investors to incorporate dividend-paying stocks into their portfolios. Some strategies focus exclusively on companies with higher-than-average yields and attractive valuations, often resulting in greater exposure to traditionally high-yielding sectors such as energy, utilities, and real estate. Others blend dividend payers with growth-oriented or cyclical companies, aiming to balance income with capital appreciation, including sectors such as technology that tend to offer lower yields and higher growth potential.

As investors navigate a landscape marked by volatility and shifting dynamics, the flexibility of dividend strategies becomes especially relevant. Dividend-paying stocks can offer a compelling blend of income, a potentially more tempered risk profile, and long-term performance potential. Their historical resilience, especially during market downturns, underscores their potential value as a strategic component in diversified portfolios. By focusing on companies with a history of stable or growing dividends, investors can potentially reduce portfolio volatility while maintaining exposure to essential, economically enduring sectors.

In addition, dividend-paying stocks can provide access to sectors that are underrepresented in traditional cap-weighted indices, offering another layer of diversification that may strengthen overall portfolio construction. This combination of income, historical performance, and diversification may make dividend strategies a useful tool for investors seeking to navigate uncertainty and build more resilient portfolios.


To learn more about the benefits of dividend-paying stocks, talk to your financial professional.


Morningstar Ratings (Mutual Fund I-Shares) for Select Hartford Funds That Invest in Dividend-Paying Stocks

OVERALL
(as of 5/31/2025)
Overall, 4 stars, 3-Year, 3 stars, 5-Year, 3 stars, and 10-Year, 4 stars, rated against 1089, 1089, 1027 and 815 products, respectively. Morningstar RatingTM is calculated for products with at least a 3-year history, based on a risk-adjusted return measure (excluding any applicable sale charges) and accounts for variations in a product's monthly performance. 5 stars are assigned to the top 10%; 4 stars to the next 22.5%, 3 stars to the next 35%, 2 stars to the next 22.5% and 1 star to the bottom 10%. ETFs and mutual funds are considered a single population. The Overall Rating is derived from a weighted average of the performance figures associated with its 3-, 5-, and 10-year (if applicable) Morningstar Rating metrics. For more information about these ratings, including their methodology, please go to global.morningstar.com/managerdisclosures . Ratings for other share classes may vary and are subject to change monthly. Past performance is no guarantee of future performance.
©2025 Morningstar, Inc. All rights reserved. The information contained herein: (1) is proprietary to Morningstar and/ or its content providers; (2) may not be copied or distributed; and (3) is not warranted to be accurate, complete or timely. Neither Morningstar nor its content providers are responsible for any damages or losses arising from any use of this information.

1089 Products | Large Value Category
Based on Risk-Adjusted Returns
OVERALL
(as of 5/31/2025)
Overall, 4 stars, 3-Year, 3 stars, 5-Year, 3 stars, and 10-Year, 5 stars, rated against 1089, 1089, 1027 and 815 products, respectively. Morningstar RatingTM is calculated for products with at least a 3-year history, based on a risk-adjusted return measure (excluding any applicable sale charges) and accounts for variations in a product's monthly performance. 5 stars are assigned to the top 10%; 4 stars to the next 22.5%, 3 stars to the next 35%, 2 stars to the next 22.5% and 1 star to the bottom 10%. ETFs and mutual funds are considered a single population. The Overall Rating is derived from a weighted average of the performance figures associated with its 3-, 5-, and 10-year (if applicable) Morningstar Rating metrics. For more information about these ratings, including their methodology, please go to global.morningstar.com/managerdisclosures . Ratings for other share classes may vary and are subject to change monthly. Past performance is no guarantee of future performance.
©2025 Morningstar, Inc. All rights reserved. The information contained herein: (1) is proprietary to Morningstar and/ or its content providers; (2) may not be copied or distributed; and (3) is not warranted to be accurate, complete or timely. Neither Morningstar nor its content providers are responsible for any damages or losses arising from any use of this information.

1089 Products | Large Value Category
Based on Risk-Adjusted Returns
OVERALL
(as of 5/31/2025)
Overall, 4 stars, 3-Year, 2 stars, 5-Year, 3 stars, and 10-Year, 5 stars, rated against 216, 216, 201 and 148 products, respectively. Morningstar RatingTM is calculated for products with at least a 3-year history, based on a risk-adjusted return measure (excluding any applicable sale charges) and accounts for variations in a product's monthly performance. 5 stars are assigned to the top 10%; 4 stars to the next 22.5%, 3 stars to the next 35%, 2 stars to the next 22.5% and 1 star to the bottom 10%. ETFs and mutual funds are considered a single population. The Overall Rating is derived from a weighted average of the performance figures associated with its 3-, 5-, and 10-year (if applicable) Morningstar Rating metrics. For more information about these ratings, including their methodology, please go to global.morningstar.com/managerdisclosures . Ratings for other share classes may vary and are subject to change monthly. Past performance is no guarantee of future performance.
©2025 Morningstar, Inc. All rights reserved. The information contained herein: (1) is proprietary to Morningstar and/ or its content providers; (2) may not be copied or distributed; and (3) is not warranted to be accurate, complete or timely. Neither Morningstar nor its content providers are responsible for any damages or losses arising from any use of this information.

216 Products | Moderately Conservative Allocation Category
Based on Risk-Adjusted Returns


1 Standard deviation measures the portfolio’s total-return volatility. A higher standard deviation indicates greater historical volatility.

2 Data Sources: Ned Davis Research and Hartford Funds, 4/30/75-3/31/25.

3 A capitalization-weighted index, or cap-weighted index, is a stock market index in which each constituent is weighted according to its market capitalization, giving larger companies greater influence on index performance.

4 Average S&P 500 Index dividend yield: 1.46%. Source: FactSet, as of 3/31/25.

Important Risks: Investing involves risk, including the possible loss of principal. • For dividend-paying stocks, dividends are not guaranteed and may decrease without notice. • Different investment styles may go in and out of favor, which may cause a fund to underperform the broader stock market. 

Diversification does not ensure a profit or protect against a loss in a declining market.

Hartford Mutual Funds may or may not be invested in the companies referenced herein; however, no particular endorsement of any product or service is being made.

This information should not be considered investment advice or a recommendation to buy/sell any security. In addition, it does not take into account the specific investment objectives, tax and financial condition of any specific person. This information has been prepared from sources believed reliable, but the accuracy and completeness of the information cannot be guaranteed. This material and/or its contents are current at the time of writing and are subject to change without notice.


WP837 4605437