

- ACCOUNT ACCESS
-
CONTACT US
Pre-Sales Support
Mutual Funds and ETFs - 800-456-7526
Monday-Thursday: 8:00 a.m. – 6:00 p.m. ET
Friday: 8:00 a.m. – 5:00 p.m. ETPost-Sales and Website Support
888-843-7824
Monday-Friday: 9:00 a.m. - 6:00 p.m. ET- PHONE US MAIL US
- ADVISOR LOG IN






Fundamental Investing Throughout the Market Cycle
Hartford Dividend and Growth Fund seeks to generate a high level of current income consistent with growth of capital by identifying undervalued companies with increasing profitability.
A Foundational Approach
Invests in companies with four pillars: consistent cash flows, undervalued leaders, attractive valuations, and healthy dividends
Uncovering Opportunity
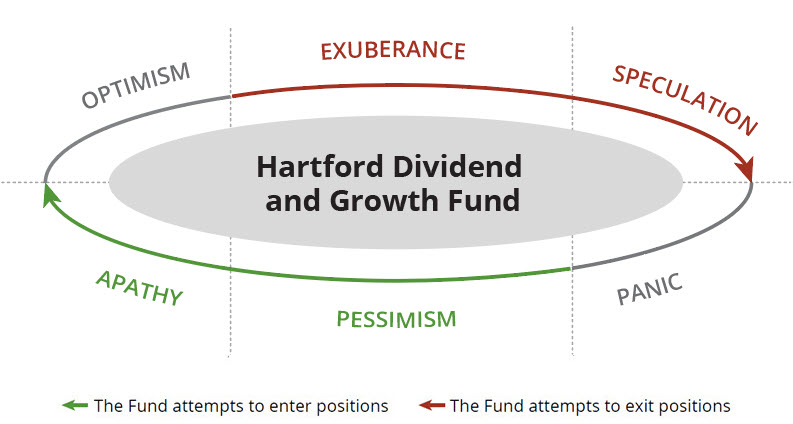
Uses capital-cycle analysis to help identify when to buy, sell, or hold companies
Sub-advised by Wellington
Wellington prioritizes independent thought and collaboration across all major asset classes
Objective: Seeks a high level of current income consistent with growth of capital.
Portfolio Management

16
YRS
MANAGING THIS FUND
22
YRS
AT WELLINGTON MANAGEMENT
31
YRS
EXPERIENCE IN THIS INDUSTRY

6
YRS
MANAGING THIS FUND
20
YRS
AT WELLINGTON MANAGEMENT
28
YRS
EXPERIENCE IN THIS INDUSTRY
The portfolio managers are supported by the full resources of Wellington.
Performance
PERFORMANCE %
Performance data quoted represents past performance and does not guarantee future results. The investment return and principal value of an investment will fluctuate so that an investor's shares, when redeemed, may be worth more or less than their original cost. Current performance may be lower or higher than the performance data quoted.
SI = Since Inception.
Fund Inception: 07/22/1996
Share Class Inception: 8/31/06.
Class I-share performance prior to its inception date reflects Class A-share performance (excluding sales charges) and operating expenses. SI performance is calculated from 7/22/96.
Hartford Dividend and Growth Fund I Share Morningstar Ratings
overall
(as of 9/30/2026)
Overall, 4 stars, 3-Year, 3 stars, 5-Year, 3 stars, and 10-Year, 5 stars, rated against 1055, 1055, 994 and 842 products, respectively. Morningstar RatingTM is calculated for products with at least a 3-year history, based on a risk-adjusted return measure (excluding any applicable sale charges) and accounts for variations in a product's monthly performance. 5 stars are assigned to the top 10%; 4 stars to the next 22.5%, 3 stars to the next 35%, 2 stars to the next 22.5% and 1 star to the bottom 10%. ETFs and mutual funds are considered a single population. The Overall Rating is derived from a weighted average of the performance figures associated with its 3-, 5-, and 10-year (if applicable) Morningstar Rating metrics. For more information about these ratings, including their methodology, please go to global.morningstar.com/managerdisclosures. Ratings for other share classes may vary and are subject to change monthly. Past performance is no guarantee of future performance.
©2026 Morningstar, Inc. All rights reserved. The information contained herein: (1) is proprietary to Morningstar and/ or its content providers; (2) may not be copied or distributed; and (3) is not warranted to be accurate, complete or timely. Neither Morningstar nor its content providers are responsible for any damages or losses arising from any use of this information.
©2026 Morningstar, Inc. All rights reserved. The information contained herein: (1) is proprietary to Morningstar and/ or its content providers; (2) may not be copied or distributed; and (3) is not warranted to be accurate, complete or timely. Neither Morningstar nor its content providers are responsible for any damages or losses arising from any use of this information.
1055 PRODUCTS
|
Large Value Category
Based on Risk-Adjusted Returns
3 YEAR
(as of 9/30/2026)
Overall, 4 stars, 3-Year, 3 stars, 5-Year, 3 stars, and 10-Year, 5 stars, rated against 1055, 1055, 994 and 842 products, respectively. Morningstar RatingTM is calculated for products with at least a 3-year history, based on a risk-adjusted return measure (excluding any applicable sale charges) and accounts for variations in a product's monthly performance. 5 stars are assigned to the top 10%; 4 stars to the next 22.5%, 3 stars to the next 35%, 2 stars to the next 22.5% and 1 star to the bottom 10%. ETFs and mutual funds are considered a single population. The Overall Rating is derived from a weighted average of the performance figures associated with its 3-, 5-, and 10-year (if applicable) Morningstar Rating metrics. For more information about these ratings, including their methodology, please go to global.morningstar.com/managerdisclosures. Ratings for other share classes may vary and are subject to change monthly. Past performance is no guarantee of future performance.
©2026 Morningstar, Inc. All rights reserved. The information contained herein: (1) is proprietary to Morningstar and/ or its content providers; (2) may not be copied or distributed; and (3) is not warranted to be accurate, complete or timely. Neither Morningstar nor its content providers are responsible for any damages or losses arising from any use of this information.
©2026 Morningstar, Inc. All rights reserved. The information contained herein: (1) is proprietary to Morningstar and/ or its content providers; (2) may not be copied or distributed; and (3) is not warranted to be accurate, complete or timely. Neither Morningstar nor its content providers are responsible for any damages or losses arising from any use of this information.
1055 PRODUCTS
|
Large Value Category
Based on Risk-Adjusted Returns
5 YEAR
(as of 9/30/2026)
Overall, 4 stars, 3-Year, 3 stars, 5-Year, 3 stars, and 10-Year, 5 stars, rated against 1055, 1055, 994 and 842 products, respectively. Morningstar RatingTM is calculated for products with at least a 3-year history, based on a risk-adjusted return measure (excluding any applicable sale charges) and accounts for variations in a product's monthly performance. 5 stars are assigned to the top 10%; 4 stars to the next 22.5%, 3 stars to the next 35%, 2 stars to the next 22.5% and 1 star to the bottom 10%. ETFs and mutual funds are considered a single population. The Overall Rating is derived from a weighted average of the performance figures associated with its 3-, 5-, and 10-year (if applicable) Morningstar Rating metrics. For more information about these ratings, including their methodology, please go to global.morningstar.com/managerdisclosures. Ratings for other share classes may vary and are subject to change monthly. Past performance is no guarantee of future performance.
©2026 Morningstar, Inc. All rights reserved. The information contained herein: (1) is proprietary to Morningstar and/ or its content providers; (2) may not be copied or distributed; and (3) is not warranted to be accurate, complete or timely. Neither Morningstar nor its content providers are responsible for any damages or losses arising from any use of this information.
©2026 Morningstar, Inc. All rights reserved. The information contained herein: (1) is proprietary to Morningstar and/ or its content providers; (2) may not be copied or distributed; and (3) is not warranted to be accurate, complete or timely. Neither Morningstar nor its content providers are responsible for any damages or losses arising from any use of this information.
994 PRODUCTS
|
Large Value Category
Based on Risk-Adjusted Returns
10 YEAR
(as of 9/30/2026)
Overall, 4 stars, 3-Year, 3 stars, 5-Year, 3 stars, and 10-Year, 5 stars, rated against 1055, 1055, 994 and 842 products, respectively. Morningstar RatingTM is calculated for products with at least a 3-year history, based on a risk-adjusted return measure (excluding any applicable sale charges) and accounts for variations in a product's monthly performance. 5 stars are assigned to the top 10%; 4 stars to the next 22.5%, 3 stars to the next 35%, 2 stars to the next 22.5% and 1 star to the bottom 10%. ETFs and mutual funds are considered a single population. The Overall Rating is derived from a weighted average of the performance figures associated with its 3-, 5-, and 10-year (if applicable) Morningstar Rating metrics. For more information about these ratings, including their methodology, please go to global.morningstar.com/managerdisclosures. Ratings for other share classes may vary and are subject to change monthly. Past performance is no guarantee of future performance.
©2026 Morningstar, Inc. All rights reserved. The information contained herein: (1) is proprietary to Morningstar and/ or its content providers; (2) may not be copied or distributed; and (3) is not warranted to be accurate, complete or timely. Neither Morningstar nor its content providers are responsible for any damages or losses arising from any use of this information.
©2026 Morningstar, Inc. All rights reserved. The information contained herein: (1) is proprietary to Morningstar and/ or its content providers; (2) may not be copied or distributed; and (3) is not warranted to be accurate, complete or timely. Neither Morningstar nor its content providers are responsible for any damages or losses arising from any use of this information.
842 PRODUCTS
|
Large Value Category
Based on Risk-Adjusted Returns
Characteristics
FUND STATS (as of 9/30/2026)
| # of Holdings | 70 |
|---|---|
| % in Equities | 100 |
| % in Foreign Equities | 9 |
| Beta (3 year) | 0.76 |
| R Squared (3 year) | 0.72 |
| Standard Deviation | 11.16% |
| Turnover | 69% |
| Active Share | 72% |
| Dividend Frequency | Quarterly |
Holdings Characteristics (as of 9/30/2026)
| FUND | S&P 500 Index | |
|---|---|---|
| Price/Earnings | 16.1x | 18.1x |
| Price/Book | 4.3x | 6.2x |
| EPS Growth Rate | 14.3% | 19.0% |
| Asset Weighted Market Cap (billions) | $959.2 | $1676.5 |
| Return on Equity | 24.5% | 29.3% |
| Median Market Cap (billions) | $110.5 | $44.1 |
Top Ten Holdings (%)
(as of 9/30/2026)
| Microsoft Corp. | 8.21 |
| Amazon.com, Inc. | 7.12 |
| Apple, Inc. | 4.71 |
| Merck & Co., Inc. | 2.62 |
| Philip Morris International, Inc. | 2.37 |
| Cisco Systems, Inc. | 2.13 |
| Johnson & Johnson | 2.12 |
| UnitedHealth Group, Inc. | 2.03 |
| Welltower, Inc. | 1.98 |
| Bank of America Corp. | 1.98 |
| Total Portfolio % | 35.27 |
Yields (%)
(as of 9/30/2026)
| 30-Day SEC Yield | 0.98 |
|
Unsubsidized 30-Day SEC Yield
|
0.99 |
Market Cap Distribution (%) (as of 9/30/2026)
| Less than $2 billion | 0 | |
| $2 billion - $5 billion | 0 | |
| $5 billion - $10 billion | 0 | |
| Greater than $10 billion | 100 | |
| Not Classified | 0 | |
RETURN CHARACTERISTICS (as of 9/30/2026)
|
Alpha (5 Year)
|
-0.54 |
|
Down Capture (5 Year)
|
83.05 |
|
Information Ratio (5 Year)
|
-0.40 |
|
Sharpe Ratio (5 Year)
|
0.56 |
|
Up Capture (5 Year)
|
82.11 |
Sector Exposure (%)
FUND |
BENCHMARK | UNDERWEIGHT / OVERWEIGHT | |||||
|---|---|---|---|---|---|---|---|
| 6/30/26 | 9/30/26 | 9/30/26 | -15 0 15 | ||||
| Health Care | 14 | 15 | 9 | ||||
| Financials | 16 | 16 | 11 | ||||
| Energy | 6 | 6 | 3 | ||||
| Industrials | 12 | 10 | 8 | ||||
| Consumer Staples | 6 | 6 | 4 | ||||
| Utilities | 4 | 4 | 2 | ||||
| Consumer Discretionary | 10 | 10 | 9 | ||||
| Real Estate | 3 | 3 | 2 | ||||
| Materials | 3 | 2 | 2 | ||||
| Communication Services | 3 | 3 | 10 | ||||
| Information Technology | 23 | 25 | 40 | ||||
Based on Global Industry Classification Standard (GICS), which was developed by and is the exclusive property and a service mark of MSCI Inc. (MSCI) and Standard & Poor's, a division of The McGraw-Hill Companies, Inc. (S&P). Excludes cash. May not total to 100% due to rounding and/or pooled vehicle allocations.
distributions and capital gains
| Distribution Date | Distribution NAV | ordinary income | short term capital gains | long term capital gains | total distribution |
|---|---|---|---|---|---|
| 9/28/2026 | 38.25 | $0.0937 | $0.0000 | $0.0000 | $0.0937 |
| 6/26/2026 | 36.97 | $0.0992 | $0.0000 | $0.0000 | $0.0992 |
| 3/27/2026 | 32.53 | $0.1101 | $0.0000 | $0.0000 | $0.1101 |
| 12/29/2025 | 34.50 | $0.1451 | $0.0000 | $0.0000 | $0.1451 |
| 12/11/2025 | 34.53 | $0.0000 | $0.0000 | $3.9283 | $3.9283 |
Past distributions are not indicative of future distributions.
Insights
Resources
Literature
Important Risks: Investing involves risk, including the possible loss of principal. Security prices fluctuate in value depending on general market and economic conditions and the prospects of individual companies. • For dividend-paying stocks, dividends are not guaranteed and may decrease without notice. • The securities of large market capitalization companies may underperform other segments of the market. • To the extent the Fund focuses on one or more sectors, the Fund may be subject to increased volatility and risk of loss if adverse developments occur. • Value and growth investing styles may go in and out of favor, which may cause the Fund to underperform other equity funds. • Foreign investments may be more volatile and less liquid than U.S. investments and are subject to the risk of currency fluctuations and adverse political, economic and regulatory developments.
5225903