1 Value stocks are equities priced below their intrinsic worth compared to key financial metrics like dividends, earnings, or sales. They attract value investors who believe the market undervalues these stocks, offering long-term growth opportunities.
2 A value trap is an investment that looks cheap based on metrics, such as price to earnings (P/E), price to cash flow (P/CF), or price to book value (P/B) ratios, but remains undervalued for good reason, often due to underlying business or industry weaknesses. These persistently low valuations can persuade investors seeking bargains, only for the stock to fall further.
3 MSCI World Index is a free float-adjusted market capitalization weighted index designed to measure the equity market performance of developed markets.
4 MSCI USA Index is a free float-adjusted market capitalization index that is designed to measure the performance of the large and mid-cap segments of the US market.
5 S&P 500 Utilities Index measures the performance of those companies considered electric, gas or water utilities, or companies that operate as independent producers and/or distributors of power.
6 S&P 500 Index is a market capitalization-weighted price index composed of 500 widely held common stocks.
7 Dividend payout ratio is the proportion of earnings paid to shareholders as dividends. It’s expressed as a percentage.
8 A REIT (Real Estate Investment Trust) is a company that owns, operates, or finances income-producing real estate across various sectors, such as apartments, malls, offices, and warehouses. They allow individual investors to buy shares in commercial real estate portfolios, typically offering high dividends and liquidity, as they are traded on major stock exchanges.
9 Correlation shows the strength of a relationship between two variables and is expressed numerically by the correlation coefficient. The correlation coefficient’s values range between -1.0 and 1.0. A perfect positive correlation means that the correlation coefficient is exactly 1. A perfect negative correlation means that two assets move in opposite directions, while a zero correlation implies no linear relationship at all.
10 The MSCI Europe ex UK Index captures large and mid cap representation across 14 Developed Markets (DM) countries in Europe. With 331 constituents, the index covers approximately 85% of the free float-adjusted market capitalization across European Developed Markets excluding the UK.
11 The MSCI United Kingdom Index is designed to measure the performance of the large and mid cap segments of the UK market. With 72constituents, the index covers approximately 85% of the free float-adjusted market capitalization in the UK.
12 MSCI Japan Index is a free-float adjusted market-capitalization index designed to measure large- and mid-cap Japanese equity market performance.
13 MSCI Emerging Markets Index is a free float-adjusted market capitalization-weighted index that is designed to measure equity market performance in the global emerging markets. MSCI index performance is shown net of dividend withholding tax.
14 S&P 500 Pure Value Index is a style-concentrated index designed to track the performance of stocks that exhibit the strongest value characteristics by using a style-attractiveness-weighting scheme.
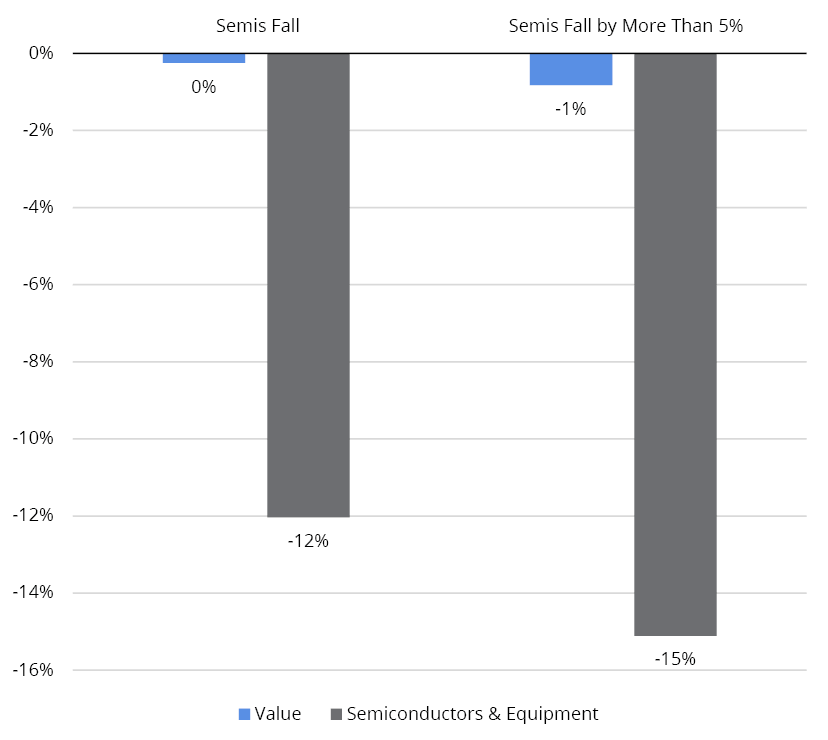
15 S&P 500 Semiconductors & Equipment Index measures the performance of companies within the S&P 500 that are classified under the semiconductor sub-industry, covering manufacturers, designers, and equipment suppliers.
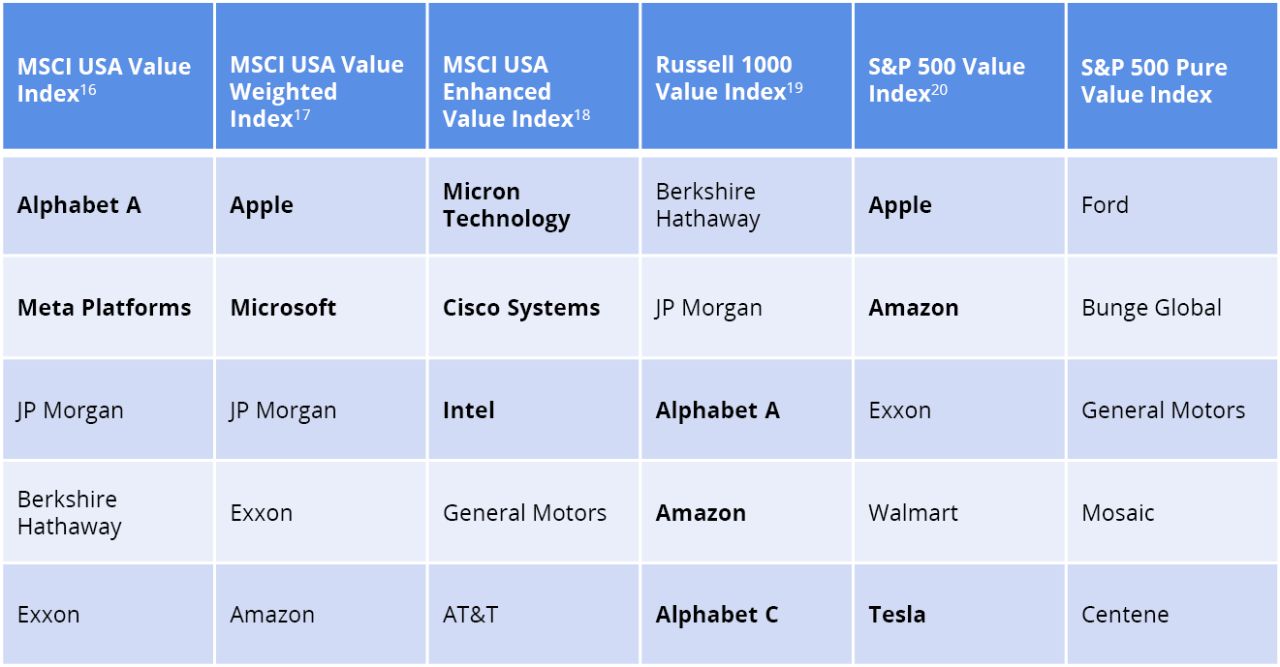
16 MSCI USA Value Index captures large- and mid-cap US securities exhibiting overall value style characteristics.
17 MSCI USA Value Weighted Index is based on a traditional market cap weighted parent index, the MSCI USA Index, which includes US large and mid cap stocks. The MSCI USA Value Weighted Index reweights each security of the parent index to emphasize stocks with lower valuations. Index weights are determined using fundamental accounting data—sales, book value, earnings and cash earnings—rather than market prices.
18 MSCI USA Enhanced Value Index captures large and mid-cap representation across the US equity markets exhibiting overall value style characteristics. The index is designed to represent the performance of securities that exhibit higher value characteristics relative to their peers within the corresponding GICS® sector.
19 Russell 1000 Value Index is an unmanaged index measuring the performance of those Russell 1000 Index companies with lower price-to-book ratios and lower forecasted growth values. Indices are unmanaged and not available for direct investment.
20 S&P 500 Value Index is a subset of the S&P 500 Index. It includes full market-capitalization weightings in the most value-oriented third of the S&P 500 Index, and a half market-cap stake in the stocks within the S&P 500 Index that have both value and growth characteristics.
Important Risks: Investing involves risk, including the possible loss of principal. • Value investing style may go in and out of favor, which may cause the Fund to underperform other equity funds using different investment styles. • Foreign investments may be more volatile and less liquid than U.S. investments and are subject to the risk of currency fluctuations and adverse political, economic and regulatory developments. These risks may be greater, and include additional risks, for investments in emerging markets or in a particular geographic region or country. • Small- and mid-cap securities can have greater risks and volatility than large-cap securities. Focusing on one or more sectors may increase volatility and risk of loss if adverse developments occur.
The views expressed herein are those of Schroders Investment Management, are for informational purposes only, and are subject to change based on prevailing market, economic, and other conditions. The views expressed may not reflect the opinions of Hartford Funds or any other sub-adviser to our funds. They should not be construed as research or investment advice nor should they be considered an offer or solicitation to buy or sell any security. This information is current at the time of writing and may not be reproduced or distributed in whole or in part, for any purpose, without the express written consent of Schroders Investment Management or Hartford Funds.