• Products
  • Insights
  • Practice Management
  • Resources
  • About Us

After an extended period of US stock exceptionalism, the guidebook for investors seemed clear: steer toward domestic equities. But the early 2025 stumble for US equities broadened the map and served as a reminder of why we diversify—because no market is invincible. As ongoing economic uncertainty leaves US equities open to a period of potentially extended volatility, now is an especially salient time to consider reevaluating portfolio diversification.

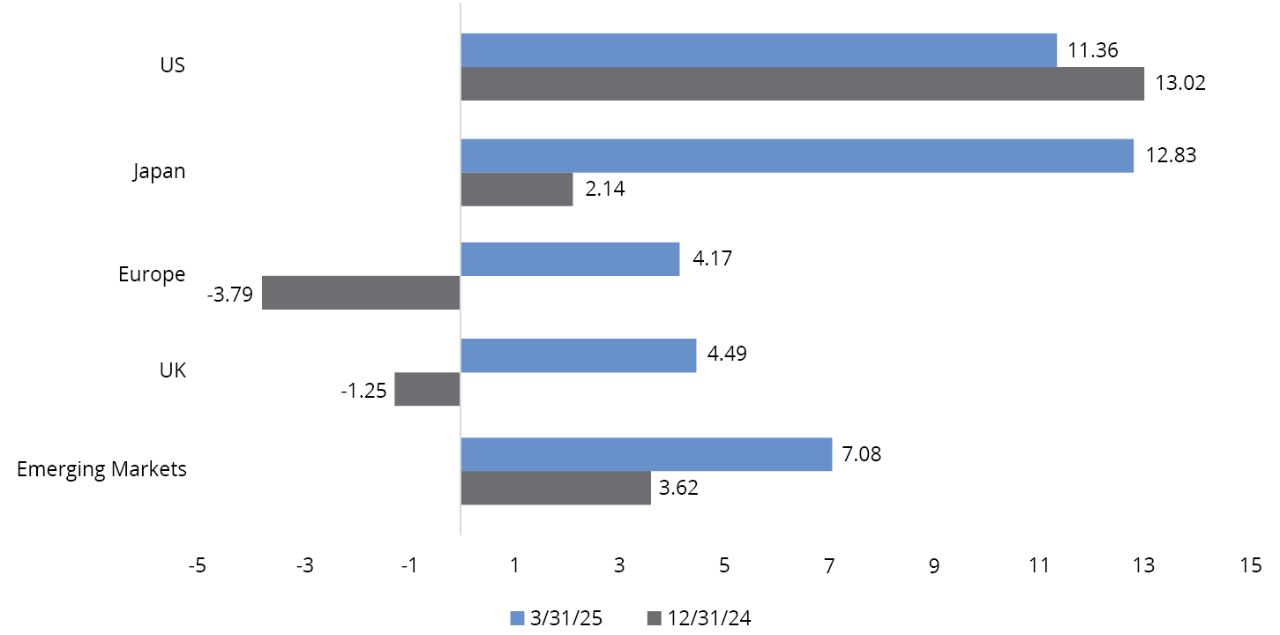
The same uncertainty that held US stocks back has also provided a momentum boost for international equities. This performance may have room to grow for a variety of reasons, placing international equities in their most favorable position in more than a decade.

Given the current environment, here are three reasons why international equities may remain an attractive source of diversification.


1. Access to a Variety of Economic Environments

As the US government seeks ways to cut the federal budget and rein in spending, other nations are embarking on plans to ramp up their fiscal spending. Germany, for example, passed major reforms to unlock its formerly strict spending limits, alloting billions toward ramping up its military and improving aging infrastructure.

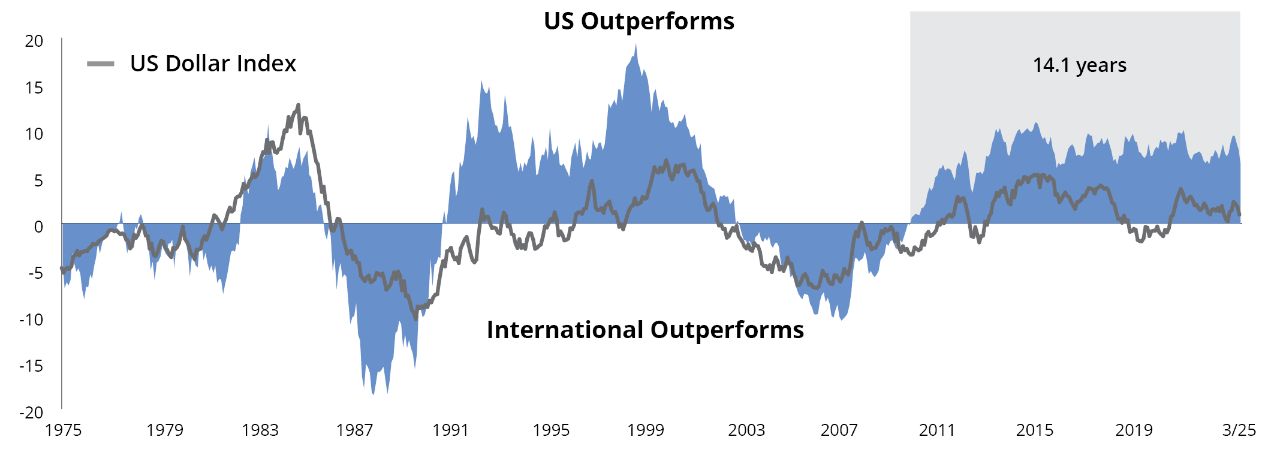
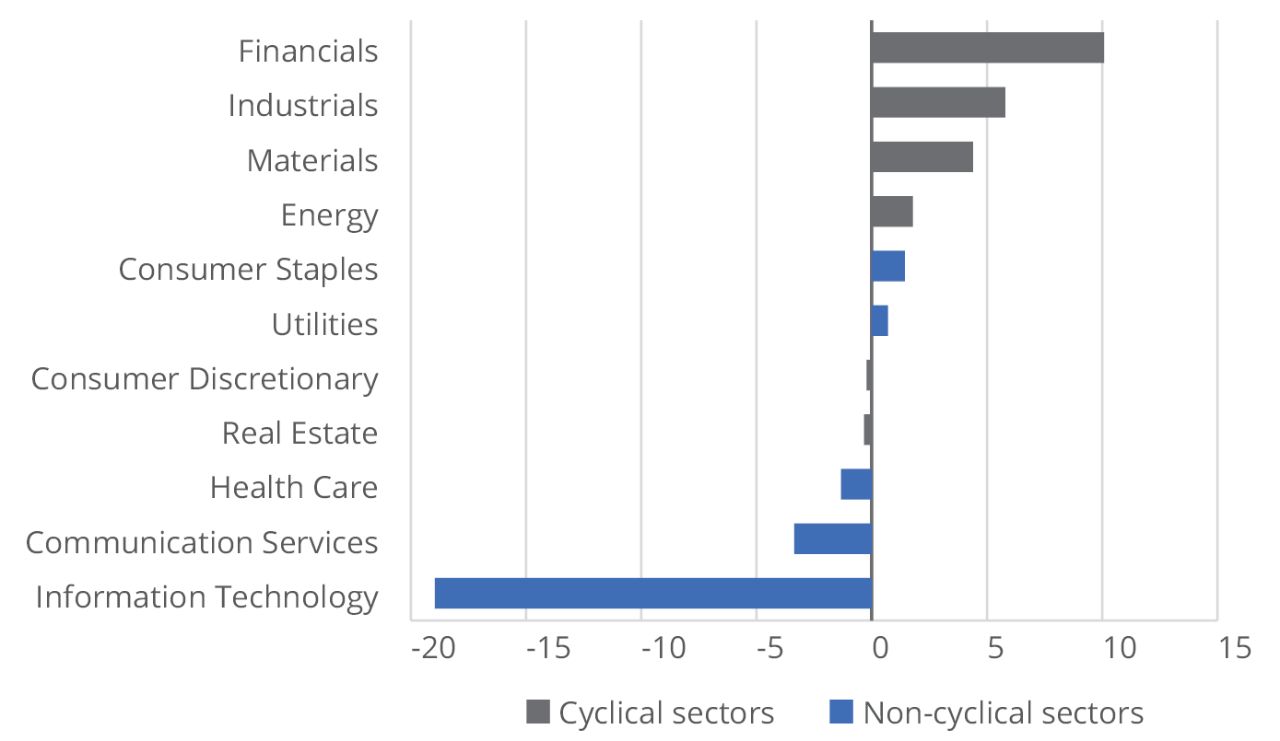
Additionally, changing tariff policies are widely considered more harmful to the US economy than foreign competition (FIGURE 1), and higher product costs directly impact US consumers. The on-again-off-again discussion around tariff policy is already impacting consumer spending and confidence: Retail sales slowed significantly in April,1 and consumer sentiment hit its fourth-lowest reading on record in May.2 With or without the threat of recession, uncertainty is damaging.


FIGURE 1

International Growth Forecasts Have Been Revised Upward
12-Month Forward Earnings-Per-Share Growth (%)

Chart data based on daily data as of 12/31/24 and 3/31/25. Earnings-per-share growth measures how much profit a company makes per share of common stock and includes the projected growth rate in earnings per share for the next five years. Representative indices used: MSCI USA Index, MSCI Japan Index, MSCI Europe Index, MSCI United Kingdom Index, and MSCI Emerging Markets Index. Please see below for index definitions. Indices are unmanaged and not available for direct investment. Data Sources: Wellington Management and Refinitiv, 4/25.

FIGURE 2

Could This Extended Era of US Exceptionalism Be Over?
US Equity vs. International Equity 5-Year Monthly Rolling Returns (%)

mountain chart

Chart Data: 1/31/75-3/31/25. Past performance does not guarantee future results. The chart shows the values of the S&P 500 Index’s returns minus the MSCI World ex USA Index’s returns. When the line is above 0, domestic stocks outperformed international stocks. When the line is below 0, international stocks outperformed domestic stocks. Indices are unmanaged and not available for direct investment. The performance shown above is index performance and is not representative of any Hartford Fund product’s performance. US equity is represented by the S&P 500 Index; international equity is represented by the MSCI World ex USA Index. Please see below for representative index definitions. For illustrative purposes only. Data Sources: Morningstar, Bloomberg, and Hartford Funds, 4/25.


Similarly, monetary policy provides insight into the perceived health of a nation’s economy. Cutting interest rates tends to offer a boost for equities, while rising rates can be a challenge for them. After a handful of rate cuts in late 2024, the US Federal Reserve is now taking a “wait and see” approach and has held rates steady until data becomes more clear. Central banks in other countries are already actively cutting their interest rates to stimulate growth.


FIGURE 3

While US Interest Rates Hold Steady, Other Economies Are Shifting Policy
Central-Bank Policies as of 12/31/24 and 3/31/25

chart

Data Source: Bloomberg, 5/25.

infographic


2. Exposure to Differentiated Markets

It’s no secret that the US market has been driven by innovation, especially in the tech sector, for the last decade. This has given US benchmarks a heavily growth-leaning bias and led to high concentration in both companies and styles. The top-10 stocks in the S&P 500 Index comprise one-third of the Index, compared to just 12.0% for the top-10 stocks in the MSCI World ex USA Index.3

In addition to being less concentrated, international markets also tend to have a more value-oriented construction and offer more varied sector exposure (FIGURE 4). Tilting toward international-value stocks can add diversification by reducing US exposure to both tech and growth investing, especially in recent years as the Magnificent Seven stocks (Apple, Microsoft, Amazon, Alphabet, Meta, Nvidia, and Tesla) grew increasingly dominant in the US market (FIGURE 5).


infographic

FIGURE 4

International Markets Offer More Value Exposure
International Sector Weights Minus US Sector Weights (%)

As of 12/31/24. International represented by the MSCI ACWI ex USA Index. US represented by the S&P 500 Index. Sources: FactSet and Hartford Funds, 1/25.

FIGURE 5

International Value Is Increasingly Uncoupling from US Performance
Rolling 3-Year Correlation vs. S&P 500 Index

chart

As of 3/31/25. Three-year correlation based on monthly data. Correlation is a statistical measure of how two investments move in relation to each other. A correlation of 1.0 indicates the investments have historically moved in the same direction; a correlation of -1.0 means the investments have historically moved in opposite directions; and a correlation of 0 indicates no historical relationship in the movement of the investments. Source: FactSet, 5/25.


3. Access to Far More Companies Than the US

In addition to being in a prime position for strong performance, the equity map simply offers more opportunities for investors abroad. US-listed companies make up only 14% of the global investment catalog, while Europe accounts for 22%; the bulk of listed companies (55%) are in Asia.4 And though US equities have outperformed as a whole, international companies have historically been strong performers on an individual level (FIGURE 6). 

The moat around some aspects of the innovation that drove strong US equity growth may also be shrinking. This is especially true for AI, which has driven much of the US outperformance in recent years. The success of China’s DeepSeek AI company, for example, forced investors to realize the threat of successful competition is much closer than previously thought. 


FIGURE 6

Most of the Best-Performing Companies Each Year Are Outside the US
Percentage of the World’s Top-50 Stocks That Are Non-US

chart

As of 3/31/25. Past performance does not guarantee future results. Based on the annual calendar-year returns of 50 highest-performing stocks of the MSCI ACWI Index. Data Sources: Factset and Hartford Funds, 4/25.


Allocation May Be Key
Each investor has unique goals and risk boundaries, which is why there’s no one-size-fits-all allocation for international equities. US investors tend to have a home bias, and strong domestic performance in recent years may have pushed international allocations even lower. In fact, the average US investor holds 21% international stocks in their portfolio while the MSCI ACWI Index allocates 33% to international stocks.5

Now is a good time for conversations between clients and financial professionals to make sure allocations haven’t strayed too far from intended goals, and to consider allocating or reallocating accordingly to take advantage of current and ongoing opportunities abroad.


FIGURE 7

Investors Can Find the Right Risk/Return Outcome for their International Allocations
Return and Standard Deviation by Equity Allocation Breakdown

chart

Chart Data: 1987-3/31/25. Past performance does not guarantee future results. Investors cannot directly invest in indices. International stocks are represented by the MSCI EAFE Index. US stocks are represented by the S&P 500 Index. Please see the below for index definitions. Standard deviation measures a portfolio’s total-return volatility. A higher standard deviation indicates higher historical volatility. Data Sources: Morningstar and Hartford Funds, 4/25.

Diminished expectations for the US have simultaneously provided a boost for international equities.

Takeaways
The stock market hates uncertainty—and in 2025, shifting US policies have been a key source of that uncertainty. This has led to diminished expectations for the US while simultaneously providing a boost for international equities. While international investing has traditionally provided access to a variety of economic cycles, interest-rate environments, and companies compared to the US, recent volatility offers a timely reminder of why we diversify in the first place.


Talk to your financial professional to help make sure you have appropriate exposure to international stocks.


1 Advance Monthly Sales for Retail and Food Services, US Census Bureau, 5/15/25.
2 University of Michigan, 5/30/25.
3 Data Sources: FactSet and Hartford Funds, 4/25.
4 Bloomberg as of 3/31/25.
5 As of 12/31/24. Data Sources: FactSet and Morningstar, 1/25.

Index definitions:

MSCI ACWI Index is a free float-adjusted market capitalization index that measures equity market performance in the global developed and emerging markets, consisting of developed and emerging market country indices. MSCI index performance is shown net of dividend withholding tax.

MSCI EAFE Index is a free float-adjusted capitalization index that is designed to measure developed market equity performance, and excludes the US and Canada.

MSCI EAFE Growth Index is a free float-adjusted market capitalization index that is designed to measure developed market equity performance (excluding the U.S. and Canada) of the growth securities within the MSCI EAFE Index.

MSCI EAFE Value Index is a free-float weighted index. The Index represents the securities classified as “value” securities by MSCI that are members of the MSCI EAFE Index. The MSCI EAFE region covers developed-market countries in Europe, Australasia, and the Far East.

MSCI Emerging Markets Index is a free float-adjusted market capitalization-weighted index that is designed to measure equity market performance in the global emerging markets.

MSCI Europe Index is a free-float adjusted market-capitalization-weighted index designed to measure the equity market performance of the developed markets in Europe.

MSCI Japan Index is a free-float adjusted market-capitalization index designed to measure large- and mid-cap Japanese equity market performance.

MSCI United Kingdom Index is designed to measure the performance of the large and mid cap segments of the UK market.

MSCI USA Index is a free float-adjusted market capitalization index that is designed to measure the performance of the large and mid cap segments of the US market.

MSCI World ex USA Index is a free float-adjusted market capitalization index that captures large and mid cap representation across developed markets countries excluding the United States.

S&P 500 Index is a market capitalization-weighted price index composed of 500 widely held common stocks.


Important Risks: Investing involves risk, including the possible loss of principal. • Foreign investments may be more volatile and less liquid than U.S. investments and are subject to the risk of currency fluctuations and adverse political, economic and regulatory developments. These risks may be greater, and include additional risks, for investments in emerging markets. • Different investment styles may go in and out of favor, which may cause underperformance versus the broader stock market. • Diversification does not ensure a profit or protect against a loss in declining market.

This information should not be considered investment advice or a recommendation to buy/sell any security. In addition, it does not take into account the specific investment objectives, tax and financial condition of any specific person. This information has been prepared from sources believed reliable, but the accuracy and completeness of the information cannot be guaranteed. This material and/or its contents are current at the time of writing and are subject to change without notice. 


WP834 4547135