• Products
  • Insights
  • Practice Management
  • Resources
  • About Us

What’s Driving Markets

1. Government Shutdown Strains Economic Activity
The prolonged US government shutdown placed significant strain on the economy: Roughly $27 billion in delayed payments to federal workers, coupled with the suspension of SNAP benefits—which impact 41 million Americans and account for nearly 10% of grocery sales—have weighed heavily on consumer spending and weakened demand.

Adding to those challenges, structural headwinds such as tariffs, a shrinking labor force, and cuts to government spending are compounding stagflationary pressures (stagnant growth, high unemployment, and high inflation). These forces are slowing job growth and weighing on key sectors such as housing and trade. While AI-driven investments offer a glimmer of optimism, near-term risks remain elevated. Treasury yields, which are highly sensitive to labor market trends, have become harder to interpret due to data interruptions during the shutdown. Even as the shutdown nears its end, lingering effects may continue to deepen fiscal drag and fuel volatility in fixed-income markets.

2. Fed Rate Cuts Highlight Policy Divisions
The Federal Reserve (Fed) delivered a 25-basis-point (bps)1 rate cut at its October meeting, lowering the federal funds2 target range to 3.75%–4.00%. Fed Chair Jerome Powell emphasized a cautious approach, noting that while markets anticipate further easing, a December cut is not guaranteed. Two members dissented—Miran again advocated for a larger 50-bps cut, while Schmid opposed any change—highlighting ongoing divisions within the Committee. Powell’s relatively hawkish tone triggered a sell-off in Treasury markets, pushing yields higher.

In his remarks, Powell also acknowledged signs of softening labor conditions and GDP growth hovering near 2%, even as inflation pressures persist. Structural challenges, including tariffs, supply-chain shifts, and evolving productivity trends driven by technology, continue to cloud the economic outlook. The shutdown’s impact on economic data has added uncertainty to recent policy decisions, with effects that may linger even as normal operations resume. Despite these headwinds, markets are still pricing in a soft landing, with futures suggesting roughly 65% odds of another rate cut in December.

The Fed also confirmed that quantitative tightening3 will conclude on December 1. Mortgage prepayments will be reinvested into Treasury bills, a move aimed at shortening the duration4 of the Fed’s balance sheet to better align with the broader Treasury market (FIGURE 1). This decision likely reflects emerging funding pressures, as seen in the secured overnight financing rate.5 The Fed reiterated its commitment to maintaining an “ample reserve” environment, signaling confidence that current reserve levels are sufficient to avoid disruptions in daily bank funding.


FIGURE 1

The Fed Adapts Its Balance Sheet as Quantitative Tightening Ends
Federal Reserve Balance Sheet (US$ millions)

Stacked area chart shows Fed balance sheet rising from $1T in 2008 to $9T peak in 2022, then declining to about $7T by mid-2025.

As of 10/31/25. Data Sources: Federal Reserve Bank of St. Louis and Board of Governors of the Federal Reserve System.


3. Data Disruptions Shift Focus to Private Indicators
With government data releases recently disrupted, markets have increasingly turned to private-sector indicators for insight. Despite this, the Bureau of Labor Statistics temporarily resumed operations to publish September’s Consumer Price Index6 (CPI) report, with the data showing headline and core inflation rising 3% year over year. Input cost pressures remain persistent, particularly in services, which may suggest that wage growth is approaching a near-term floor over the next 6 to 12 months.


Lingering effects from tariffs and immigration constraints could push core inflation closer to 4% in the coming year.


While core goods inflation stayed positive, a deceleration in owners’ equivalent rent7 contributed to a slightly softer overall reading than expected (FIGURE 2). Inflation risks remain two-sided. On the upside, lingering effects from tariffs and immigration constraints could push core inflation closer to 4% in the coming year. On the downside, a sharper economic slowdown or productivity gains could help ease labor market tightness and temper price pressures. Market-based inflation expectations, such as Treasury Inflation-Protected Securities8 (TIPS) breakevens, have held steady. However, consumer surveys, such as the University of Michigan survey, have recently shown an uptick in inflation expectations, underscoring the disconnect between market signals and public sentiment.


FIGURE 2

Inflation Signals Remain Mixed as Services Pressures Persist
Inflation Measures (%)

Line chart shows inflation measures (2018–2025): Core CPI rises sharply in 2021–22 then falls; breakeven and expectations stay relatively stable near 2–3%.

As of 10/31/25. Core CPI is defined as a measure of the average change over time in the prices paid by urban consumers for a market basket of consumer goods and services excluding food and energy prices. The 10-Year Breakeven Inflation Rate estimates the market’s inflation outlook over the next decade by comparing yields on regular TIPS. The University of Michigan 5-10 Year Expected Inflation Rate reflects how consumers think prices will change over the next 5 to 10 years. It’s a widely watched indicator because it helps gauge whether inflation expectations are becoming anchored or drifting, which can influence long-term interest rates and policy decisions. Data Sources: Bureau of Labor Statistics, Bloomberg, and the University of Michigan.


4. US-China Talks Ease Trade Tensions
The recent meeting between President Donald Trump and President Xi Jinping yielded a surprisingly constructive outcome, reversing much of the trade war escalation seen earlier in the year. China secured several concessions, including the suspension of the BIS 50% rule,9 delayed surcharges, and a loosening of AI chip export controls. In exchange, the US rolled back the fentanyl tariff by 10%, extended reciprocal deadlines, and received commitments on agricultural purchases and precursor chemical controls.

These developments mark a notable de-escalation in trade tensions and reduce incentives for supply-chain relocation—particularly for Chinese firms in sectors such as autos, technology, and manufacturing. The US also gained additional promises, including expanded soybean purchases, a pause on rare earth export restrictions, and the reopening of direct military-to-military communication channels, signaling a broader effort to stabilize bilateral relations.


5. US Treasury Steps In to Stabilize Argentina’s Currency
The US Treasury recently intervened in Argentina’s foreign-exchange market by purchasing Argentine pesos, marking its first such action since 2011 and only the fourth in nearly three decades. The move was executed through the Treasury’s Exchange Stabilization Fund,10 which is typically reserved for interventions in euro and yen markets.

This strategic support came just ahead of Argentina’s congressional and senate elections, aiming to stabilize the currency and reinforce President Javier Milei’s reform agenda. The swap line11 is widely interpreted as a signal of US backing for Milei’s economic program, which has diverged from International Monetary Fund conditions and faced domestic skepticism. The timing—aligned with a long weekend and ongoing dollar sales by Argentina’s treasury—helped avert a disorderly currency adjustment that could have jeopardized political stability.


The collapses of Tricolor Holdings and First Brands Group have highlighted the fragility of highly leveraged, privately held companies, raising red flags.


What’s Keeping Us Up at Night

1. Private Credit: Hidden Weaknesses Emerge
Concerns are mounting in private credit markets as recent bankruptcies and headline risks expose weaknesses in underwriting and transparency. The collapses of Tricolor Holdings and First Brands Group have highlighted the fragility of highly leveraged, privately held companies, raising red flags around loan quality and the opacity that can mask poor risk management.

Adding to the unease, several regional banks reported fraud-related write downs this month, underscoring vulnerabilities across the sector. While public credit markets remain relatively stable, the rapid growth of private credit—particularly in middle-market direct lending and business development companies (BDCs)12—has led to wider performance dispersion and increased scrutiny from both investors and regulators.

Liquidity mismatches are also becoming more pronounced, especially as retail investors gain exposure through interval funds13 and public BDCs. These structures can amplify redemption risks during periods of market stress. Moreover, as the Fed continues its rate-cutting cycle, the embedded floating-rate nature of this debt (if unhedged) may diminish potentially cooling demand from marginal buyers (FIGURE 3).

Regulators are calling for greater transparency and more robust reporting standards, but the sector’s complexity and interconnectedness remain largely untested through a full market cycle. We’re keeping a close eye on how these risks evolve, and where opportunities may emerge, in this increasingly dynamic corner of the credit market.


FIGURE 3

Volatility and Liquidity Risks Drive Divergence in Credit Markets
S&P BDC Index vs. US High Yield CDX

Line chart shows S&P BDC Index (blue) and US High-Yield CDX Spread (orange) diverging in 2025: BDC falls sharply, CDX rises then stabilizes.

As of 10/31/25. Past performance does not guarantee future results. Indices are unmanaged and not available for direct investment. The S&P BDC Index tracks the performance of publicly traded BDCs listed on major US exchanges, offering a benchmark for investors focused on middle-market lending and private credit exposure. The US High-Yield CDX Spread reflects the cost of insuring against default in a basket of below-investment-grade (IG) corporate bonds, serving as a market-based gauge of credit risk and investor sentiment in the high-yield sector. Data Source: Bloomberg.


2. Venezuela: Rising Geopolitical and Economic Risks
Tensions in this region escalated after Trump publicly confirmed CIA covert operations in Venezuela, following lethal US military strikes on alleged drug-smuggling vessels. Framed by the administration as a crackdown on “narco-terrorism,” the campaign has introduced the possibility of ground operations, significantly raising geopolitical risk in the region.

On the economic front, the picture remains mixed. GDP growth continues, buoyed by a resilient oil sector, but inflation has surged past 250%, and foreign currency inflows remain severely constrained. These conflicting signals underscore the fragility of Venezuela’s recovery and the mounting pressure it faces.

Markets are now navigating a volatile intersection of geopolitical brinkmanship and economic instability. With both risk and opportunity in flux, Venezuela remains a closely watched flashpoint for investors and policymakers alike.


Investment Implications for Consideration

While the below positions have been static for some time, it’s a reflection on how drawn out the current cycle has been due to the underlying strength of the economy.

  • Recession risks remain modest—but not negligible. At the same time, tariffs could reinforce inflationary pressures. In this environment, we continue to favor high-quality total return strategies14 with flexibility beyond traditional benchmarks. This may include:

-  Global sovereign and currency strategies that tend to shine in these environments by capitalizing on diverging growth and inflation dynamics, uncoordinated central-bank policies, and the ongoing trend toward deglobalization. Alternatives to US Treasuries, such as European, Australian, and Japanese government bonds, along with select currencies, may help strengthen portfolio resilience.

-  “Go anywhere”15 strategies may be well-positioned for late-cycle investing, with the flexibility to rotate across sectors and geographies as dislocations emerge. We currently favor adding duration to help offset credit risk and see opportunities in international markets (such as global convertible bonds and global high yield) to build a more balanced return profile.

  • Core Bond/Core Bond Plus/Intermediate bond16 positions remain compelling, with attractive all-in yields and a macro backdrop where recession and growth risks could outweigh inflation over the medium term. Intermediate government/credit or short-duration strategies can serve as a potentially more risk-balanced way to add high-quality ballast to portfolios. While recent economic data points to cooling conditions, we’re not yet ready to extend duration meaningfully given current valuations and the shape of the yield curve.

-  Agency MBS valuations look attractive relative to IG credit. Supportive supply-demand dynamics—driven in part by deregulatory tailwinds—continue to provide a favorable backdrop.

-  We remain cautious on the long end of the curve, holding off on re-entering until valuations and curve structure become more compelling.

  • Short-duration bonds remain attractive in an environment where inflation may be re-accelerating and the path for interest rates is uncertain. The economy is in transition, absorbing the effects of higher tariffs, shifting fiscal policy, and evolving labor market dynamics—factors that could produce mixed and volatile data through year-end. 

-  Short-term bonds still offer attractive yields with less sensitivity to interest-rate changes. Put simply, investors are getting paid to stay cautious in a volatile environment.

-  Even with a rate cut expected by year-end, front-end strategies remain appealing. Cuts to overnight rates can steepen the front end of the curve, creating a favorable setup for total return potential.

  • Higher-yielding credit remains potentially appealing, with US and global high yield offering close to 7% yield-to-worst17 despite tight spreads.18 We remain cautiously optimistic that higher yielding credit (including leveraged loans)19 will continue to perform well for the remainder of the year but emphasize the importance of selective positioning amid ongoing uncertainty around tariffs and fiscal policy.

-  Active management and careful issuer selection may be key in navigating this environment.

-  Cyclical sectors and subordinated structures20 offer limited compensation for their elevated risk, warranting a more cautious approach.

FIGURE 4

US Yields (%)

The chart shows US Treasury yields from 2013 to 2025, with 2-, 10-, and 30-year yields dropping near zero in 2020 and then climbing above 4% by 2023, while the 10-Year Breakeven Inflation Rate stays around 2%.

As of 10/31/25. Data Source: Bloomberg.

FIGURE 5

Fixed-Income Spreads (bps)

The chart shows fixed-income spreads from 2013 to 2025, with all sectors spiking sharply in 2020—emerging-market debt exceeding 1,000 bps—before declining and remaining volatile, while bank loans and MBS stay relatively stable at lower levels.

As of 10/31/25. Past performance does not guarantee future results. Indices are unmanaged and not available for direct investment. Please see below for representative index definitions. Data Sources: Bloomberg, JP Morgan, and Morningstar LSTA.

FIGURE 6

Monthly Fixed-Income Sector Total and Excess Returns

The chart shows monthly fixed-income sector returns as of October 2025, with UK Aggregate (2.65%) and Emerging-Market Debt (1.72%) posting the highest excess returns, while most other sectors show modest gains or slight losses.

Monthly data as 10/31/25. Past performance does not guarantee future results. Indices are unmanaged and not available for direct investment. Excess returns are defined as investment returns from a security or portfolio that exceeds a benchmark or index with a similar level of risk. Indices are unmanaged and not available for direct investment. Please see below for representative index definitions. Data Sources: Bloomberg and Wellington Management.

To learn more about opportunities in fixed income, please talk to your financial professional.


Representative indices from Figure 5:
US IG Corporates
are represented by the Bloomberg US Corporate Bond Index, which measures the performance of US dollar-denominated, IG corporate bonds issued by industrial, utility, and financial companies. US High-Yield Corporates are represented by the Bloomberg US Corporate High Yield Bond Index, which measures the performance of US dollar-denominated, below-IG corporate bonds issued by industrial, utility, and financial companies. Emerging-Market Debt is represented by the J.P. Morgan EMBI Global Diversified Index, a broad-based, unmanaged index which tracks liquid, US dollar emerging-market fixed- and floating-rate debt instruments issued by sovereign and quasi-sovereign entities. MBS is represented by the Bloomberg US MBS Index, which tracks fixed-rate agency mortgage backed passthrough securities guaranteed by Ginnie Mae (GNMA), Fannie Mae (FNMA), and Freddie Mac (FHLMC). Bank Loans are represented by the Morningstar/LSTA US Leveraged Loan Index, which is a market-value-weighted index that is designed to measure the performance of the US leveraged loan market based upon market weightings, spreads, and interest payments.

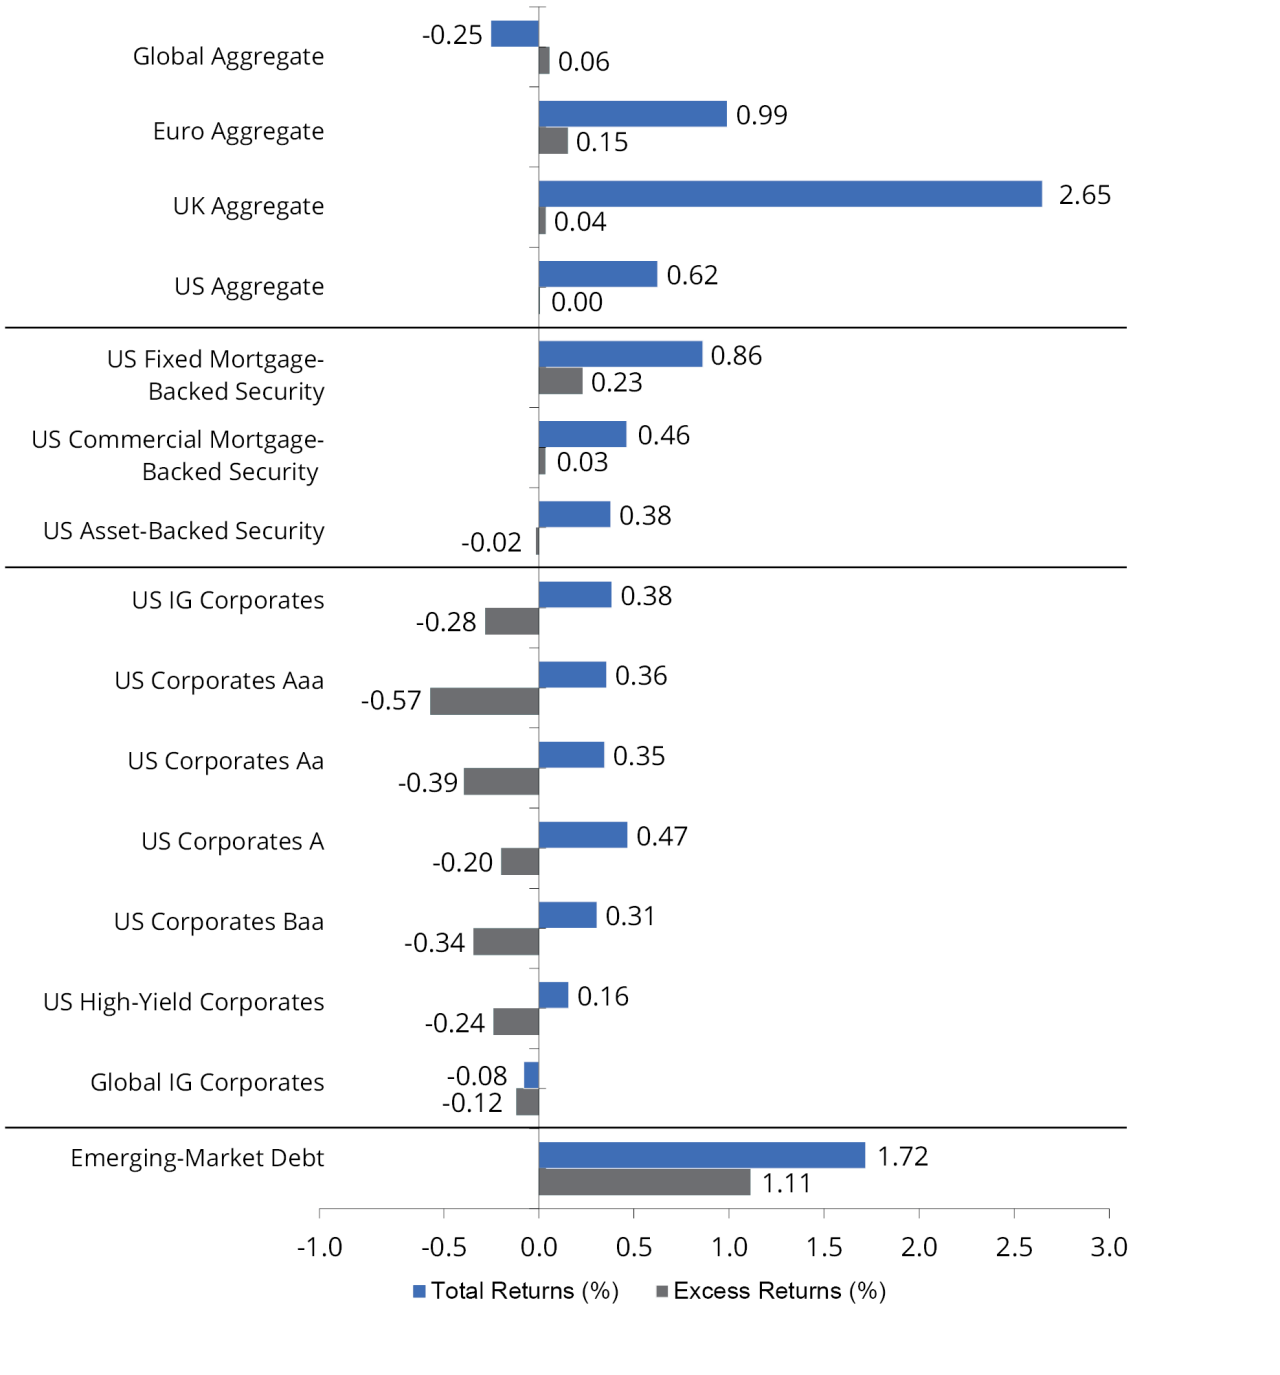
Representative indices from Figure 6:
Global Aggregate is represented by the Bloomberg Global Aggregate Bond Index, which is a broad-based measure of the global IG fixed-rate debt markets. Euro Aggregate is represented by the Bloomberg Global Aggregate Bond Index - European Euro, which includes fixed-rate, IG Euro denominated bonds. UK Aggregate is represented by the Bloomberg Global Aggregate Bond Index - United Kingdom, includes fixed-rate, IG sterling-denominated bonds. US Aggregate is represented by the Bloomberg US Aggregate Bond Index, which is composed of securities that cover the US IG fixed-rate bond market, with index components for government and corporate securities, mortgage pass-through securities, and asset-backed securities. US Fixed MBS is represented by the Bloomberg US MBS Index, which tracks fixed-rate agency mortgage backed passthrough securities guaranteed by Ginnie Mae (GNMA), Fannie Mae (FNMA), and Freddie Mac (FHLMC). US CMBS is represented by the Bloomberg CMBS ERISA Eligible Index, which measures the performance of IG commercial mortgage-backed securities, which are classes of securities that represent interests in pools of commercial mortgages. The index includes only CMBS that are Employee Retirement Income Security Act of 1974. US ABS is represented by the Bloomberg Asset-Backed Securities Index, which is the ABS component of the Bloomberg US Aggregate Index. It has three subsectors: credit and charge cards, autos, and utility. US IG Corporates is represented by the Bloomberg US Corporate Bond Index, which measures the performance of US dollar-denominated, IG corporate bonds issued by industrial, utility, and financial companies. US Corporates Aaa is represented by the Bloomberg Aaa Corporate Bond Index, which is designed to measure the performance of IG corporate bonds that have a credit rating of Aaa. US Corporates Aa is represented by the Bloomberg Aa Corporate Bond Index which is designed to measure the performance of IG corporate bonds that have a credit rating of Aa. US Corporates A is represented by the Bloomberg A Corporate Index, which is designed to measure the performance of IG corporate bonds that have a credit rating of A. US Corporates Baa is represented by the Bloomberg Baa Corporate Bond Index, which is designed to measure the performance of IG corporate bonds that have a credit rating of Baa. US High-Yield Corporates is represented by the Bloomberg US Corporate High Yield Bond Index, which measures the performance of US dollar-denominated, below-IG corporate bonds issued by industrial, utility, and financial companies. Global IG Corporates is represented by the Bloomberg Global Credit - Corporate Bond Index, which is an unmanaged index considered representative of fixed rate, non-IG debt of companies in the US, developed markets, and emerging markets. Emerging-Market Debt is represented by the Bloomberg Emerging Markets Hard Currency Bond Index, which includes USD-denominated debt from sovereign, quasi-sovereign, and corporate EM issuers.

1 A basis point is equal to 1/100th of 1% and is used to express small changes in interest rates, yields, and financial indices.

2 The federal funds rate is the target interest rate set by the Federal Open Market Committee. This target is the rate at which commercial banks borrow and lend their excess reserves to each other overnight.

3 Quantitative tightening is a monetary policy strategy where a central bank reduces the size of its balance sheet—typically by selling government bonds or letting them mature—thereby decreasing liquidity in the financial system.

4 Duration is a measure of the sensitivity of an investment’s price to nominal interest-rate movement.

5 The Secured Overnight Financing Rate (SOFR) reflects the cost of overnight borrowing using U.S. Treasury bonds as collateral. It's a risk-free rate based on actual market transactions.

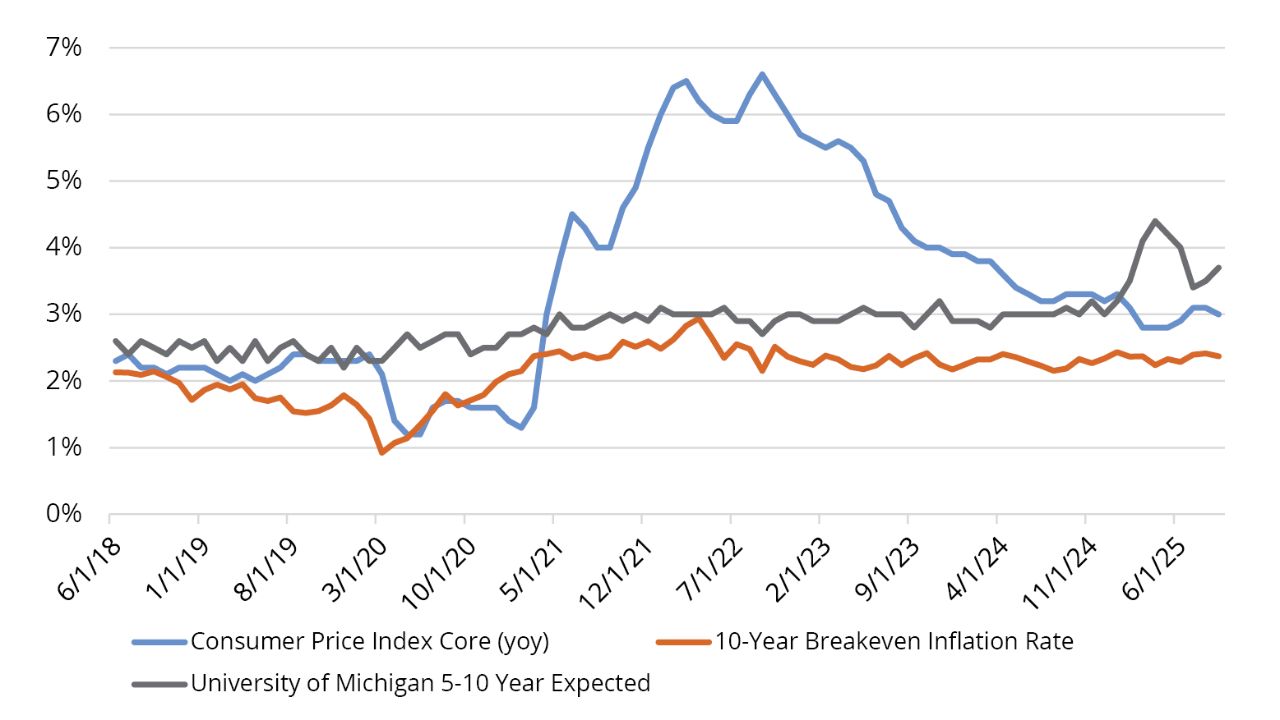
6 The Consumer Price Index is a measure of change in consumer prices as determined by the US Bureau of Labor Statistics.

7 Owners’ equivalent rent is the amount of rent that would have to be paid in order to substitute a currently owned house as a rental property.

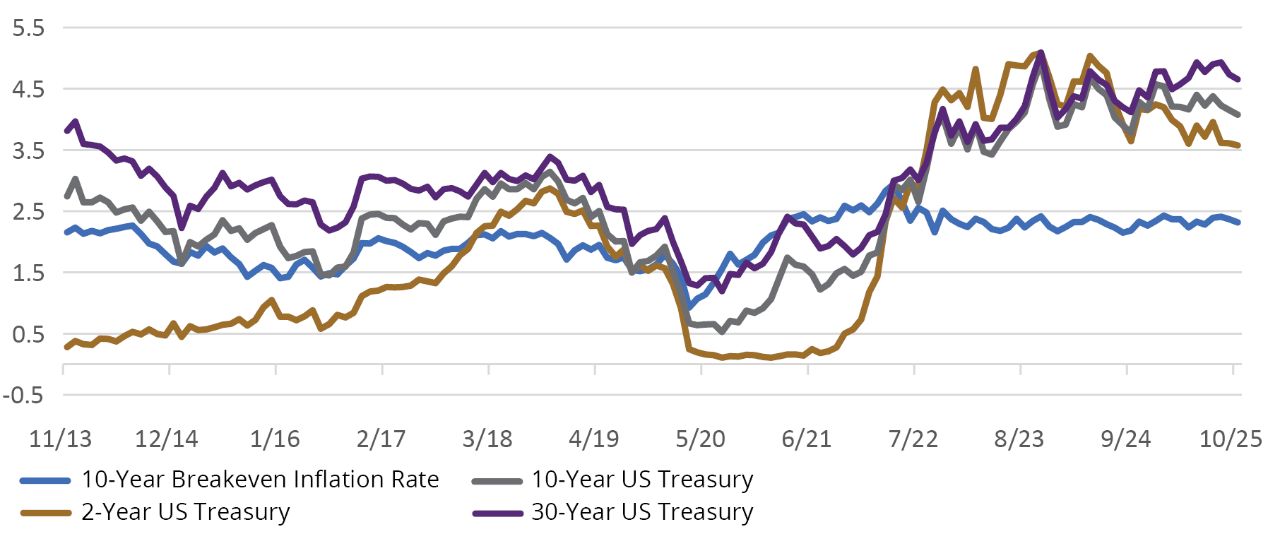
8 Treasury Inflation-Protected Securities are Treasury bonds that are adjusted to eliminate the effects of inflation on interest and principal payments, as measured by the CPI.

9 The BIS 50% Rule restricts US exports to any company that is 50% or more owned by a sanctioned entity, even if that company itself isn’t explicitly listed.

10 The Exchange Stabilization Fund is a US Treasury reserve account used to manage currency stability and respond to financial crises, giving the Treasury flexibility to intervene in foreign exchange markets and support global financial stability without needing Congressional approval.

11 A swap line is an agreement between two central banks to exchange currencies, allowing one to access foreign currency liquidity, typically US dollars, to stabilize markets and support domestic financial institutions during times of stress.

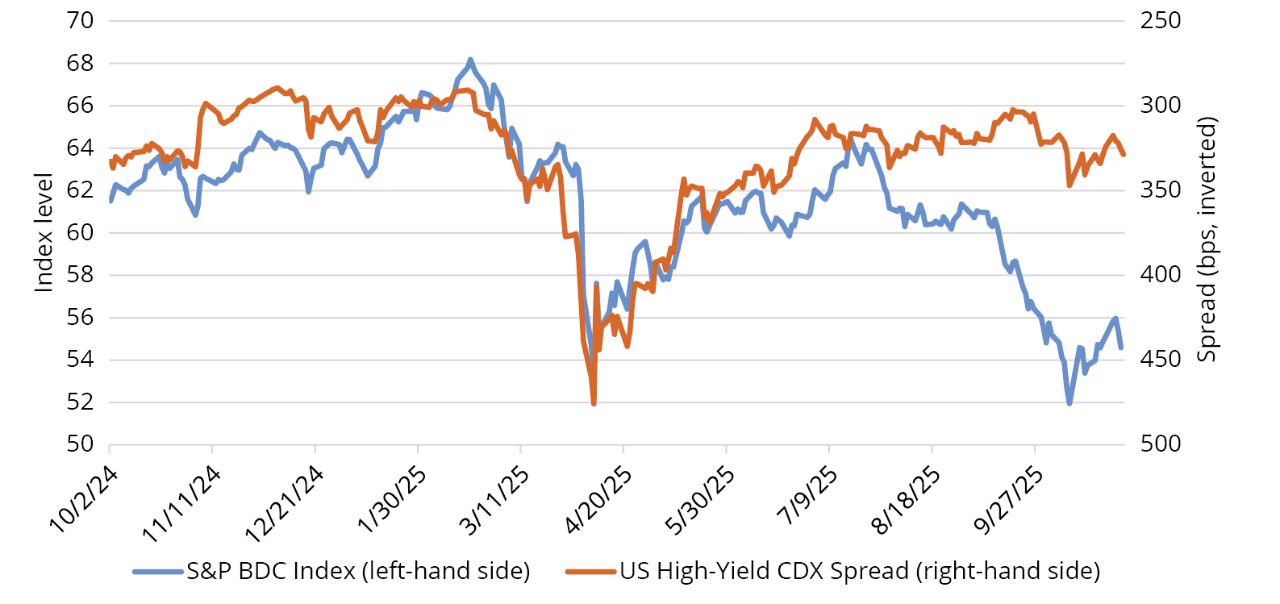
12 Business development companies are publicly traded investment firms that provide financing to small and mid-sized private companies, often through direct lending, and offer retail investors access to private credit markets with higher yield potential and higher risk.

13 Interval funds are a type of closed-end fund that allows investors to buy shares anytime but only permit redemptions at set intervals, such as quarterly, rather than daily.

14 Total return is the actual rate of return of an investment over a given evaluation period, including interest, capital gains, dividends, and distributions realized during that time.

15 Go-anywhere strategies are benchmark-agnostic and can invest across sectors, credit qualities, currencies, and countries without preset limits, unlike core-bond-plus strategies, which allow flexibility but impose caps on below-IG, non-US, or sector-specific exposures.

16 Core/core plus strategies typically invest in a baseline of IG bonds such as government, corporate, and securitized debt. Core-plus funds can take that baseline and add additional sectors such as corporate high-yield, emerging-market debt, or non-US currency exposures to enhance returns.

17 As of 10/31/25. US high yield is represented by the Bloomberg US High Yield Index, a benchmark tracking US dollar-denominated, below- IG corporate bonds issued in the US market (YTW: 7.16%). Global high yield is represented by the Bloomberg Global High Yield Index, a multi-currency benchmark tracking below-IG corporate bonds issued in major markets worldwide, including the US, Europe, and EMs (YTW: 6.68%). Yield to worst refers to the minimum yield that can be received on a bond assuming the issuer does not default on any payments.

18 Spreads are the difference in yields between two fixed-income securities with the same maturity but originating from different investment sectors.

19 Leveraged loans are loans made to companies with below-IG credit ratings, typically carrying higher interest rates and secured by collateral to compensate for their greater default risk.

20 Subordinated structures are debt or securities that rank below senior obligations in repayment priority, meaning they carry higher risk because they are paid only after senior claims in the event of default.

Important Risks: Investing involves risk, including the possible loss of principal. • Fixed income security risks include credit, liquidity, call, duration, and interest-rate risk. As interest rates rise, bond prices generally fall. • Investments in high-yield (“junk”) bonds involve greater risk of price volatility, illiquidity, and default than higher-rated debt securities. • Mortgage-related and asset-backed securities’ risks include credit, interest-rate, prepayment, and extension risk. The value of the underlying real estate of real estate related securities may go down due to various factors, including but not limited to strength of the economy, amount of new construction, laws and regulations, costs of real estate, availability of mortgages, and changes in interest rates. • Loans can be difficult to value and less liquid than other types of debt instruments; they are also subject to nonpayment, collateral, bankruptcy, default, extension, prepayment and insolvency risks. • Foreign investments may be more volatile and less liquid than US investments and are subject to the risk of currency fluctuations and adverse political, economic and regulatory developments. These risks may be greater, and include additional risks, for investments in emerging markets. • The risks associated with mortgage-related and asset-backed securities as well as collateralized loan obligations (CLOs) include credit, interest-rate, prepayment, liquidity, default, and extension risk.

The views expressed herein are those of Wellington Management, are for informational purposes only, and are subject to change based on prevailing market, economic, and other conditions. The views expressed may not reflect the opinions of Hartford Funds or any other sub-adviser to our funds. They should not be construed as research or investment advice nor should they be considered an offer or solicitation to buy or sell any security. This information is current at the time of writing and may not be reproduced or distributed in whole or in part, for any purpose, without the express written consent of Wellington Management or Hartford Funds.


FIOWP039 4984873
Insight from sub-adviser Wellington Management
Author Headshot
Managing Director at Wellington Management LLP and Fixed-Income Strategist for Hartford Funds
Author Headshot
Associate Strategist