1 The Federal Reserve's balance sheet is a weekly report of its assets—primarily US Treasury securities and mortgage-backed securities (MBS)—and liabilities, such as bank reserves and currency in circulation. It acts as a tool for implementing monetary policy and maintaining financial stability, often expanded via quantitative easing to inject liquidity into the economy or shrunk via tightening.
2 A basis point is a unit that is equal to 1/100th of 1%, and is used to denote the change in a financial instrument. The basis point is commonly used for calculating changes in interest rates, equity indexes and the yield of a fixed-income security.
3 The federal funds rate is the target interest rate set by the Federal Reserve (FOMC), at which banks lend excess cash reserves to each other overnight to meet reserve requirements.
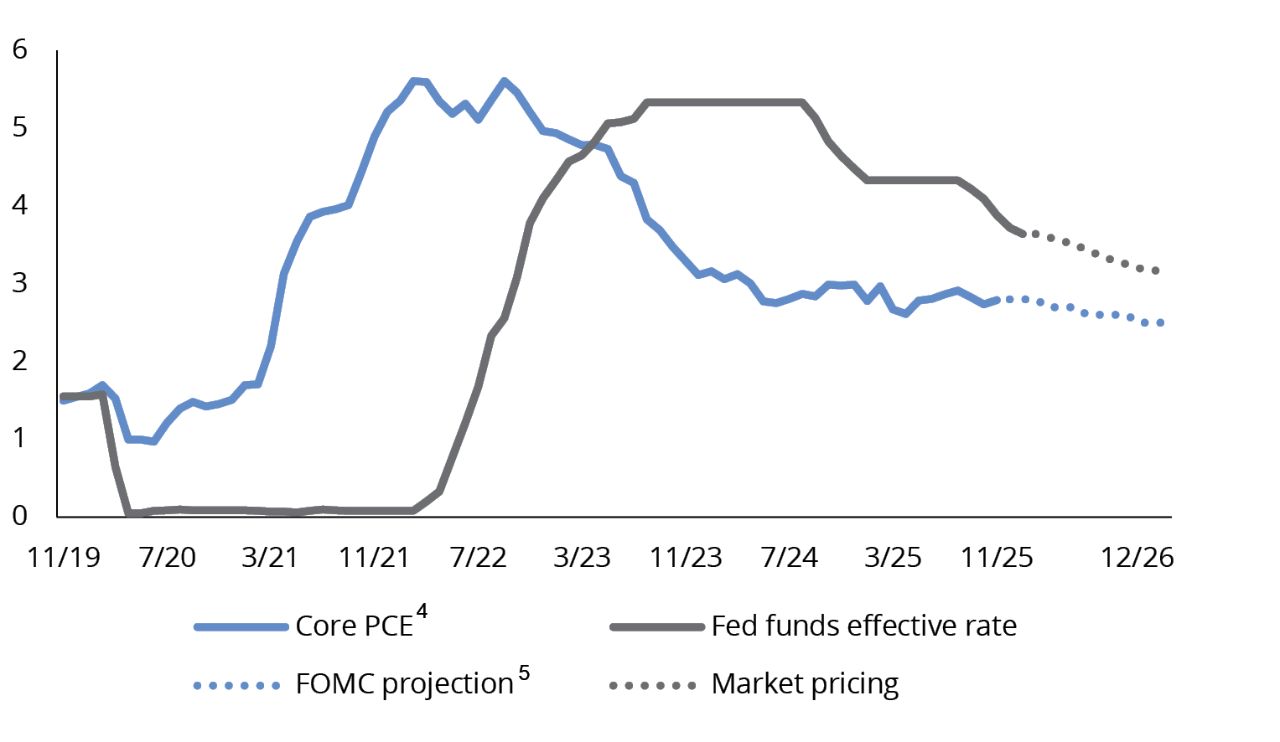
4 PCE (Personal Consumption Expenditures) measures the price changes for a wide range of goods and services purchased by consumers, including durable goods (e.g., cars), non-durable goods (e.g., food), and services (e.g., healthcare). The Federal Reserve uses the PCE price index to measure inflation because it adapts quickly to changes in consumer spending patterns and covers a broad range of expenses.
5 The Federal Open Market Committee (FOMC) is the 7-member Board of Governors and five Federal Reserve Bank presidents who meet eight times yearly to set US monetary policy, primarily by targeting the federal funds rate and conducting open market operations. It is the main Federal Reserve body for promoting maximum employment and price stability.
6 Tail risk is the probability of rare, extreme, and unexpected financial losses that occur far from the average expected outcome. These occurrences represent market crashes or crises where traditional risk management models fail.
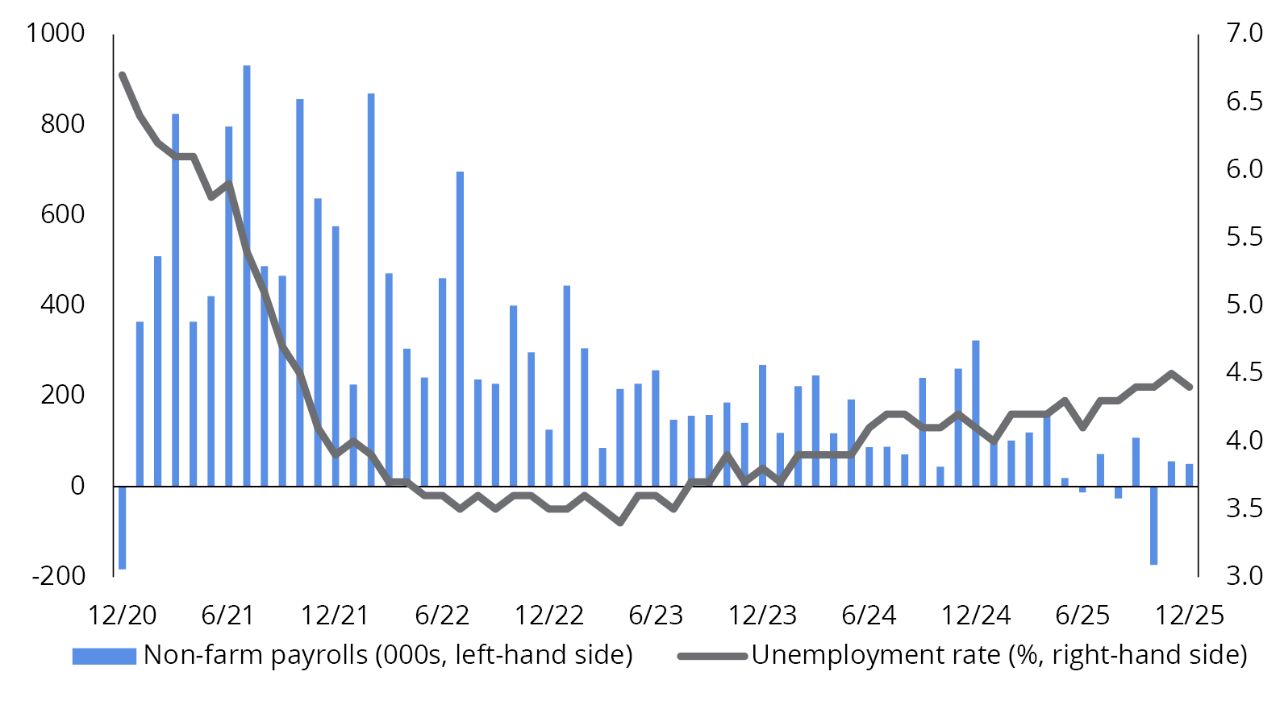
7 The household survey is produced by the US Bureau of Labor Statistics and is designed to measure the labor-force status of the civilian noninstitutional population with demographic detail. The national unemployment rate is the best-known statistic produced from the household survey. The survey also provides a measure of employed people, one that includes agricultural workers and the self-employed. A representative sample of US households provides the information for the household survey.
8 Agency Mortgage-Backed Securities (MBS) are investment pools of residential mortgages guaranteed by US government agencies or government-sponsored enterprises (GSEs)—specifically Fannie Mae, Freddie Mac, and Ginnie Mae. These securities offer high credit quality and safety from default, as the government guarantees the principal and interest payments.
9 A Preferred Stock Purchase Agreement (SPA) is a legal contract detailing the terms, conditions, purchase price, and number of shares for a private company’s sale of preferred stock to investors, often used in venture capital financings. It binds the issuer and investor, establishing representations, warranties, and closing conditions.
10 Spreads are the difference in yields between two fixed-income securities with the same maturity, but originating from different investment sectors.
11 GSE most commonly refers to a Government-Sponsored Enterprise, which is a type of financial-services corporation created by the US Congress to enhance the flow of credit to specific sectors of the economy, particularly housing and agriculture. Examples of GSE's include: Freddie Mac (Federal Home Loan Mortgage Corpiration), Fannie Mae (Federal National Mortgage Association), and Farmer Mac (Federal Agrecultural Mortgage Corporation).
12 An Initial Public Offering (IPO) is the process where a private company first sells shares to the public to raise capital, increase liquidity, and enhance prestige.
13 Securitized products are income-generating bonds backed by pools of loans—such as mortgages, auto loans, or credit-card debt—that transform illiquid assets into tradable securities. These instruments offer diversification and higher yields than traditional bonds, with risks including prepayment, credit, and interest-rate volatility.
14 Risk premia represent the additional return expected or required by investors for holding risky assets over risk-free assets, such as government bonds. These premiums compensate for uncertainty and potential losses.
15 Go-anywhere strategies are typically benchmark-agnostic and not bound by limits on exposure by sector, quality, currency, or country. Whereas traditional core-bond-plus strategies generally have flexibility to invest across the fixed-income landscape, they generally have upper limits on the amount that can be invested in securities rated below-investment-grade, domiciled outside the US, non-US-dollar-denominated, or reside in a particular sector (e.g., emerging markets).
16 Duration is a measure of the sensitivity of an investment’s price to nominal interest-rate movement.
17 Core/core plus strategies typically invest in a baseline of investment-grade bonds such as government, corporate, and securitized debt. Core-plus funds can take that baseline and add additional sectors such as corporate high-yield, emerging-market debt, or non-US currency exposures to enhance returns.
18 The yield curve is a line that plots interest rates of bonds having equal credit quality but differing maturity dates; its slope is used to forecast the state of the economy and interest-rate changes.
19 Short-term bonds are debt securities issued by governments or corporations that mature quickly, usually within one to four years, offering investors periodic interest payments and return of principal; they are popular for their lower interest-rate risk, making them a relatively stable option for short-to-medium-term financial goals and preserving capital, with ultra-short bonds maturing in under a year acting as cash equivalents.
20 High-yield (HY) securities, or "junk bonds," are rated below-investment-grade because there is a greater possibility that the issuer may be unable to make interest and principal payments on those securities.
21 Yield to worst is the minimum yield that can be received on a bond assuming the issuer doesn’t default on any of its payments.
22 Leveraged loans are high-yield, senior secured debt instruments extended to companies with significant existing debt or poor credit histories. Typically used for mergers, acquisitions, or recapitalizations, these risky loans feature floating interest rates and are often syndicated to investors to manage default risk.
23 Subordination refers to a lower priority level of debt or securities. Subordinated debt ranks below senior debt in terms of claims on assets and earnings. This means that in the event of a default or liquidation, subordinated debt holders are paid after senior debt holders. Subordinated debt is often considered riskier because it has a lower claim on assets, but it typically offers higher interest rates to compensate for this increased risk.
24 Emerging-market debt (EMD) are debt instruments issued by developing countries. These bonds tend to offer higher yields than Treasuries or corporate bonds in the US. Emerging-market issues tend to carry higher risks than domestic debt instruments.
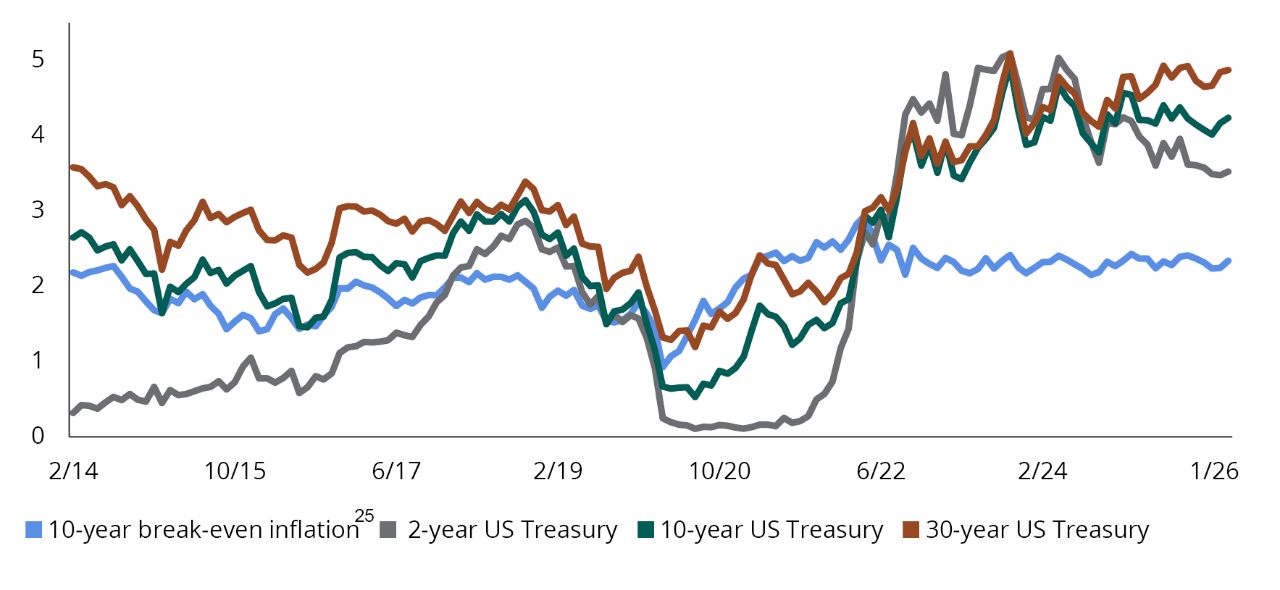
25 The break-even inflation rate is a measurement that aims to predict the effects of inflation on certain investments, by analyzing known market inflation rates from recent years. It can be calculated by comparing the yield of an inflation-based bond (such as Treasury Inflation-Protected Securities, or TIPS) with a nominal bond of the same maturity period. The difference represents the break-even inflation rate, or the rate that inflation would have to be for an investor to “break even”—or earn the same return—between purchasing TIPS or nominal Treasuries.
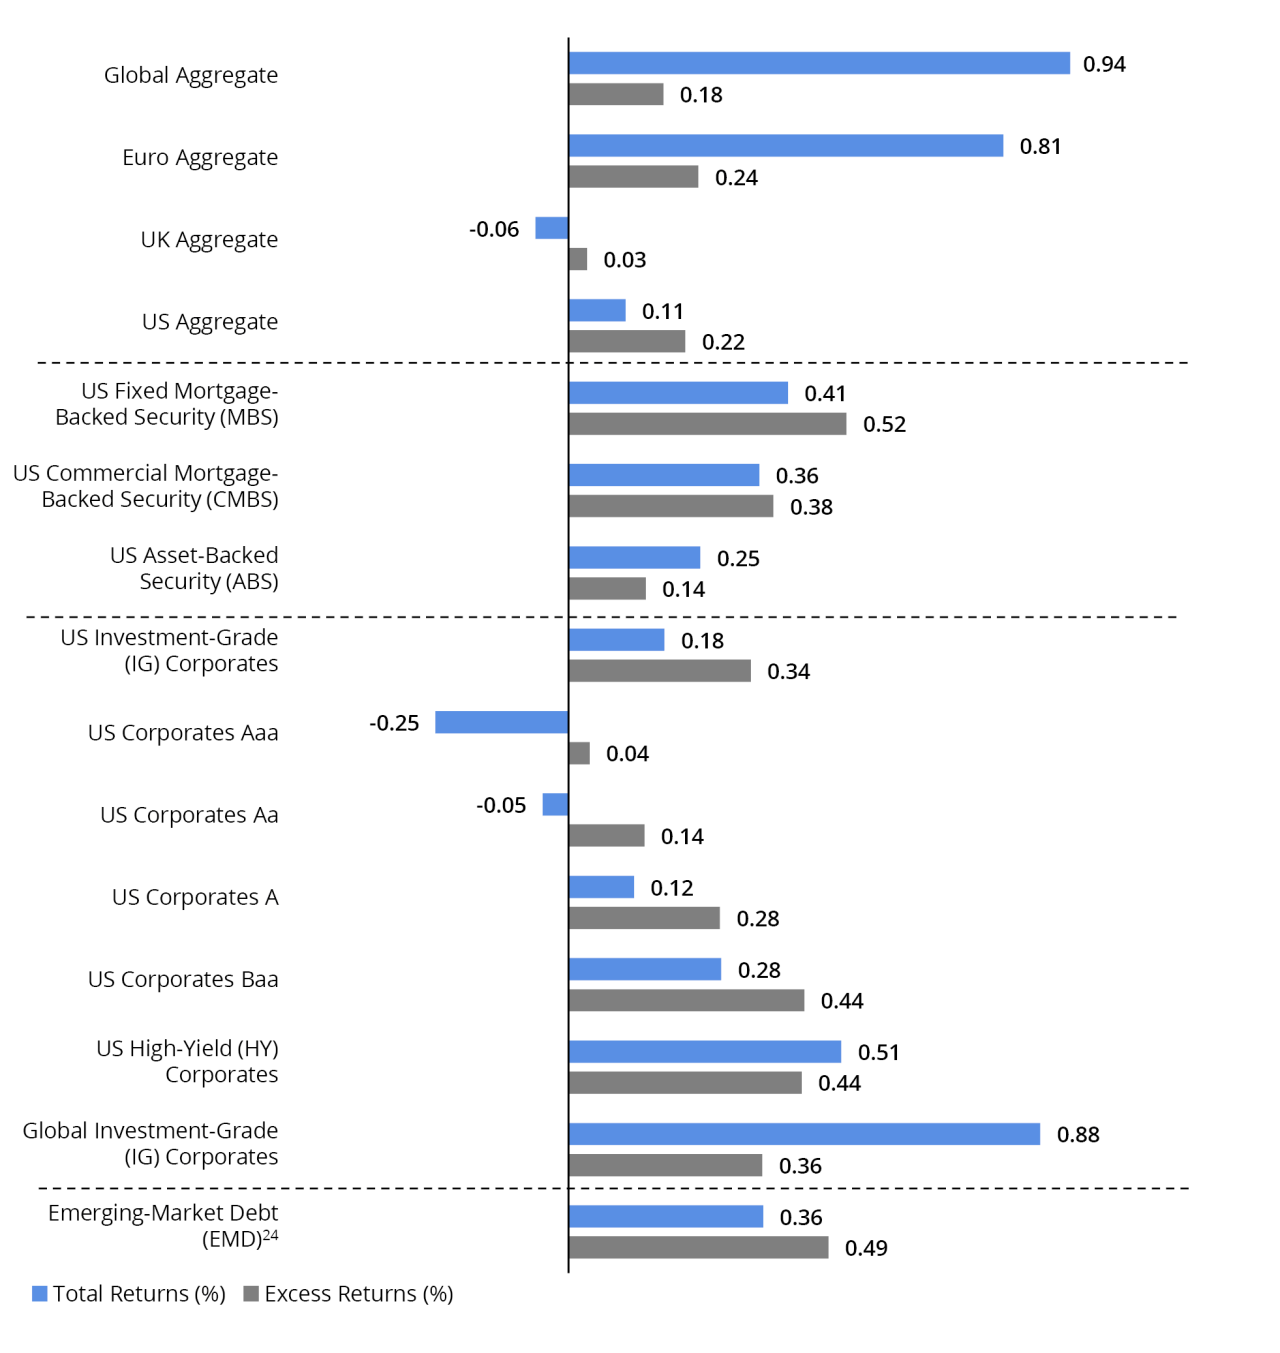
Representative indices from Figure 5:
Global Aggregate is represented by the Bloomberg Global Aggregate Bond Index, which is a broad-based measure of the global IG fixed-rate debt markets. Euro Aggregate is represented by the Bloomberg Global Aggregate Bond Index - European Euro, which includes fixed-rate, IG Euro denominated bonds. UK Aggregate is represented by the Bloomberg Global Aggregate Bond Index - United Kingdom, includes fixed-rate, IG sterling-denominated bonds. US Aggregate is represented by the Bloomberg US Aggregate Bond Index, which is composed of securities that cover the US IG fixed-rate bond market, with index components for government and corporate securities, mortgage pass-through securities, and asset-backed securities. US Fixed MBS is represented by the Bloomberg US MBS Index, which tracks fixed-rate agency mortgage backed passthrough securities guaranteed by Ginnie Mae (GNMA), Fannie Mae (FNMA), and Freddie Mac (FHLMC). US CMBS is represented by the Bloomberg CMBS ERISA Eligible Index, which measures the performance of IG commercial mortgage-backed securities, which are classes of securities that represent interests in pools of commercial mortgages. The index includes only CMBS that are Employee Retirement Income Security Act of 1974. US ABS is represented by the Bloomberg Asset-Backed Securities Index, which is the ABS component of the Bloomberg US Aggregate Index. It has three subsectors: credit and charge cards, autos, and utility. US IG Corporates is represented by the Bloomberg US Corporate Bond Index, which measures the performance of US dollar-denominated, IG corporate bonds issued by industrial, utility, and financial companies. US Corporates Aaa is represented by the Bloomberg Aaa Corporate Bond Index, which is designed to measure the performance of IG corporate bonds that have a credit rating of Aaa. US Corporates Aa is represented by the Bloomberg Aa Corporate Bond Index which is designed to measure the performance of IG corporate bonds that have a credit rating of Aa. US Corporates A is represented by the Bloomberg A Corporate Index, which is designed to measure the performance of IG corporate bonds that have a credit rating of A. US Corporates Baa is represented by the Bloomberg Baa Corporate Bond Index, which is designed to measure the performance of IG corporate bonds that have a credit rating of Baa. US High-Yield Corporates is represented by the Bloomberg US Corporate High Yield Bond Index, which measures the performance of US dollar-denominated, below-IG corporate bonds issued by industrial, utility, and financial companies. Global IG Corporates is represented by the Bloomberg Global Credit - Corporate Bond Index, which is an unmanaged index considered representative of fixed rate, non-IG debt of companies in the US, developed markets, and emerging markets. Emerging-Market Debt is represented by the Bloomberg Emerging Markets Hard Currency Bond Index, which includes USD-denominated debt from sovereign, quasi-sovereign, and corporate EM issuers.
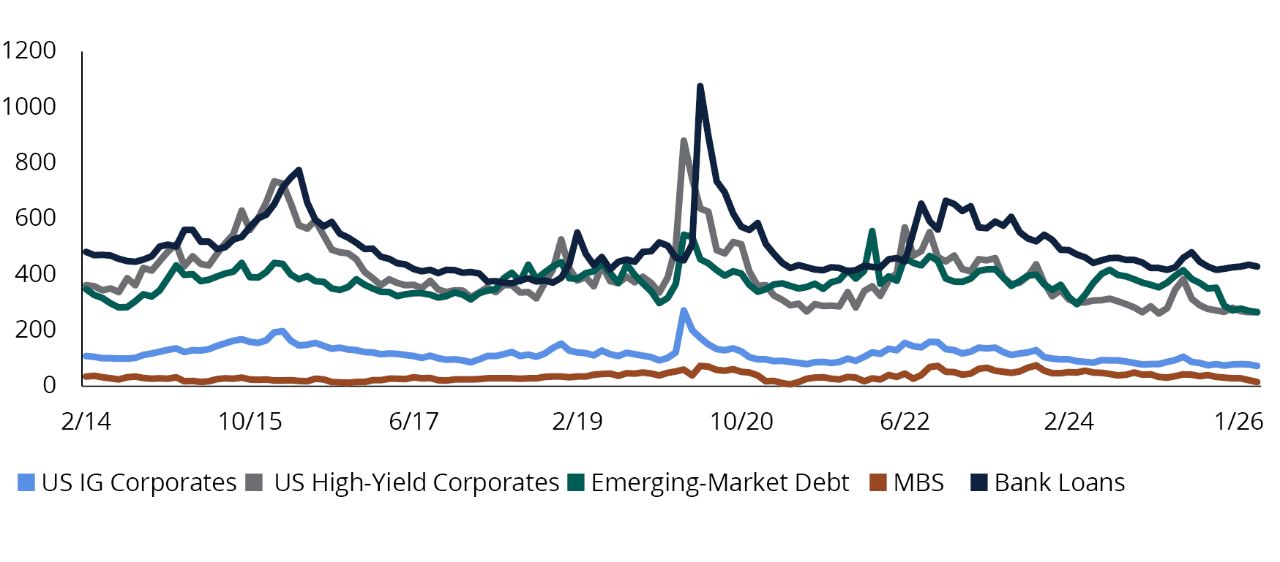
Representative indices from Figure 7:
US IG Corporates are represented by the Bloomberg US Corporate Bond Index, which measures the performance of US dollar-denominated, IG corporate bonds issued by industrial, utility, and financial companies. US High-Yield Corporates are represented by the Bloomberg US Corporate High Yield Bond Index, which measures the performance of US dollar-denominated, below-IG corporate bonds issued by industrial, utility, and financial companies. Emerging-Market Debt is represented by the J.P. Morgan EMBI Global Diversified Index, a broad-based, unmanaged index which tracks liquid, US dollar emerging-market fixed- and floating-rate debt instruments issued by sovereign and quasi-sovereign entities. MBS is represented by the Bloomberg US MBS Index, which tracks fixed-rate agency mortgage backed passthrough securities guaranteed by Ginnie Mae (GNMA), Fannie Mae (FNMA), and Freddie Mac (FHLMC). Bank Loans are represented by the Morningstar/LSTA US Leveraged Loan Index, which is a market-value-weighted index that is designed to measure the performance of the US leveraged loan market based upon market weightings, spreads, and interest payments.
Important Risks: Investing involves risk, including the possible loss of principal. • Fixed income security risks include credit, liquidity, call, duration, and interest-rate risk. As interest rates rise, bond prices generally fall. • Investments in high-yield (“junk”) bonds involve greater risk of price volatility, illiquidity, and default than higher-rated debt securities. • Mortgage-related and asset-backed securities’ risks include credit, interest-rate, prepayment, and extension risk. The value of the underlying real estate of real estate related securities may go down due to various factors, including but not limited to strength of the economy, amount of new construction, laws and regulations, costs of real estate, availability of mortgages, and changes in interest rates. • Loans can be difficult to value and less liquid than other types of debt instruments; they are also subject to nonpayment, collateral, bankruptcy, default, extension, prepayment and insolvency risks. • Foreign investments may be more volatile and less liquid than US investments and are subject to the risk of currency fluctuations and adverse political, economic and regulatory developments. These risks may be greater, and include additional risks, for investments in emerging markets. • The risks associated with mortgage-related and asset-backed securities as well as collateralized loan obligations (CLOs) include credit, interest-rate, prepayment, liquidity, default, and extension risk.
The views expressed herein are those of Wellington Management, are for informational purposes only, and are subject to change based on prevailing market, economic, and other conditions. The views expressed may not reflect the opinions of Hartford Funds or any other sub-adviser to our funds. They should not be construed as research or investment advice nor should they be considered an offer or solicitation to buy or sell any security. This information is current at the time of writing and may not be reproduced or distributed in whole or in part, for any purpose, without the express written consent of Wellington Management or Hartford Funds.