• Products
  • Insights
  • Practice Management
  • Resources
  • About Us

Investors have long studied the US Treasury yield curve for clues about the economy’s next chapter. Of particular recent interest has been the inverted yield curve, which occurs when bonds with shorter maturities are yielding more than their longer counterparts. This type of curve has historically been a predictor of tougher markets. That said, the most recent cycle challenges this conventional wisdom.

Consider that, from July 2022 through early September 2024, the yield on the 2-year Treasury exceeded the yield on the 10-year Treasury, producing an inversion that suggested an imminent risk-off environment. Yet, during this period, the S&P 500 Index delivered a cumulative return of 46.37%. This divergence between signal and outcome reveals one of today’s central investment challenges: Even well-known and trusted economic barometers can be misleading from time to time.
Today, the yield curve has reasserted its typical upward slope, with the spread1 between 2-year and 10-year Treasuries widening to 55 basis points (bps)2 by late September and hitting 60 bps at various times in recent weeks. Many analysts expect the yield curve to continue steepening as the Federal Reserve (Fed) continues to cut short-term interest rates. For investors who need to make fixed-income allocation decisions for their portfolios, a closer look at different yield curve shapes and their meanings could prove helpful.


Yield Curve Shapes


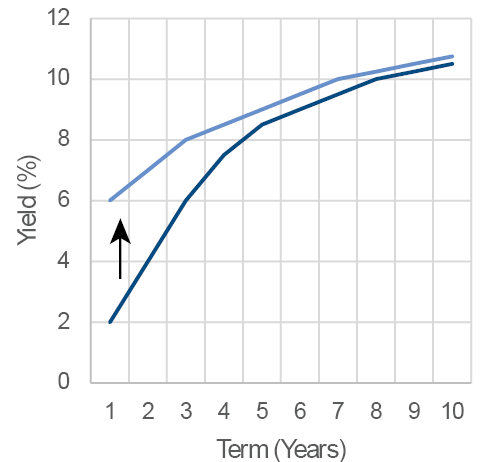
Normal (Upward-Sloping)
Long-term bonds yield more than short-term bonds. In this environment, lenders  often demand a premium for longer commitments.

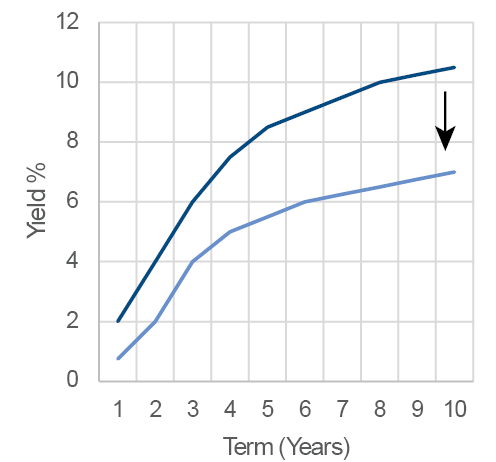
Inverted (Downward-Sloping)
Short-term yields are higher than long-term yields—often interpreted as a possible warning sign of recession as investors seek the safety of longer-dated maturities.
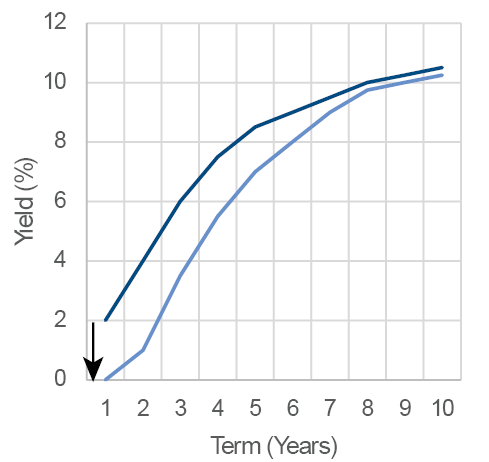
Flat
When yields across maturities are similar, the curve is “flat.” This often signals an inflection point, or a period of uncertainty. 
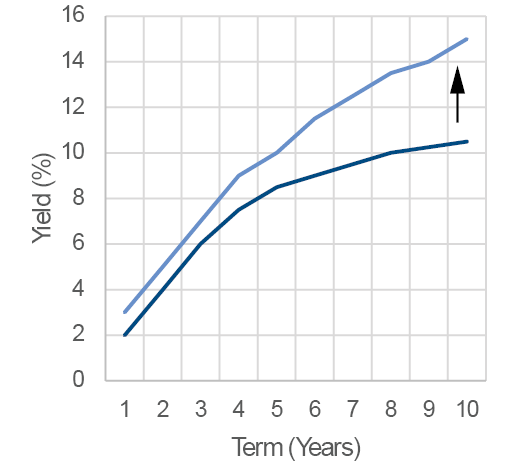
Steep
A pronounced spread between short and long maturities reflects expectations of future growth or inflation.

Humped or Kinked
When intermediate yields exceed yields on the short and long ends, this is often due to supply-demand quirks, regulatory issues, or technical factors. These curve shapes are typically transitory and, possibly, a sign of inconclusive data.


FIGURE 1

Yield Curve Shapes Often Reflect Underlying Macroeconomic Trends
Movements of Short-Term Rates vs. Long-Term Rates in Different Environments

 
Bull Flattener
Bull Flattener
Bull Flattener
Bull Flattener
 Existing Yield Curve     Shifted Yield Curve
Bull Flattener Bull Steepener Bear Flattener Bear Steepener
Long-term yields fall faster than short-term yields Short-term yields fall faster than long-term yields Short-term yields rise faster than long-term yields Long-term yields climbing faster than short-term yields
Environment: Economic downturn; flight to safety Environment: Central banks are cutting rates Environment: Central banks are raising rates Environment: Inflationary, strong growth
Potential Outcome: Long-term bonds outperform short-term bonds Potential Outcome: Short-term bond prices rise the most Potential Outcome: Short-term bond prices negatively impacted Potential Outcome: Negative total returns for intermediate-to-long-dated bonds

For illustrative purposes only. Source: Hartford Funds.


Yield Curve Movements


Bull Flattener
A bull flattener occurs when long-term yields fall faster than short-term yields, causing a flattening convergence of yields along the curve. Falling long-term yields sometimes signal investor concern over a downturn in the economy. A flight to safety drives demand for long-term bonds, pushing yields down. In this scenario, long-term bonds can generate greater positive total returns than short-term bonds.

Bull Steepener
Conversely, a bull steepener occurs when short-term yields fall more rapidly than long-term yields. The spread between rapidly falling short-term rates and long-term rates steepens the shape of the curve. This can occur when markets anticipate a Fed rate-cutting cycle.

Bear Flattener
A bear flattener arises when short-term rates rise faster than long-term rates, often in anticipation of hawkish central-bank policy. The yield curve flattens as short-term and long-term rates converge. Bear flatteners are seen as a potential warning sign of an economic contraction.

Bear Steepener
A bear steepener reflects long-term yields climbing faster than short-term yields, typically driven by strong economic growth and rising inflation expectations. This steepening can result in investors selling long-term bonds to avoid falling bond prices in a rising-rate atmosphere.

A bull steepener occurs when short-term yields fall more rapidly than long-term yields. This can occur when markets anticipate a Fed rate-cutting cycle.

Why Is an Upward Sloping Curve Considered “Normal?”
An upward sloping yield curve—often referred to as a normal yield curve—reflects the market’s baseline expectations. At its core, this shape signals that long-term bonds are offering higher yields than short-term bonds. It helps explain why lenders require a “term premium”—greater compensation for tying up capital over longer periods given the greater uncertainties and risks associated with the distant future (i.e., inflation, changes in economic growth, or borrower creditworthiness).

This upward slope also conveys something fundamental about market sentiment: When the curve is steep or upward sloping, investors generally anticipate continued economic growth and, potentially, moderate inflation. In these environments, lenders demand higher returns to compensate for both opportunity cost and potential shifts in real rates over time, while borrowers are willing to pay a higher term premium for the predictability and security of locking in long-term funding.

Navigating Uncertainty: Beyond Shape Recognition
Yield curves, like markets themselves, are dynamic and multidimensional. It’s worth considering the shape of the yield curve as one component of the process—but integrating macroeconomic, technical, and global policy signals should also factor into allocation decisions. As the past few years have demonstrated, investors need a flexible framework when navigating uncertain market conditions.

Yield curves offer guidance, not guarantees. By understanding their nuances and recognizing when traditional signals may not play out as expected, investors can better position portfolios for the complex landscape ahead.


Talk to your financial professional to help position your fixed-income portfolio for potential opportunities.


1 Spreads are the difference in yields between two fixed-income securities with the same maturity but originating from different investment sectors.

2 A basis point is a unit that is equal to 1/100th of 1% and is used to denote the change in a financial instrument. The basis point is commonly used for calculating changes in interest rates, equity indexes and the yield of a fixed-income security.

Important Risks: Investing involves risk, including the possible loss of principal. • Fixed-income security risks include credit, liquidity, call, duration, event and interest-rate risk. As interest rates rise, bond prices generally fall. • U.S. Treasury securities are backed by the full faith and credit of the US government as to the timely payment of principal and interest.

The views expressed here are those of the author and should not be construed as investment advice. This material and/or its contents are current as of the time of writing and may not be reproduced or distributed in whole or in part, for any purpose, without the express written consent of Hartford Funds.


WP864 4933968
About The Author
Author Headshot
Joe Boyle, CFA, CPA
Hartford Funds Fixed-Income Product Manager