• Products
  • Insights
  • Practice Management
  • Resources
  • About Us

Dividend-paying stocks don’t always command the same attention as faster-growing parts of the market, especially during periods when growth is leading. They’re not the flashiest part of a portfolio—but dividends can play a critical role in a diversified portfolio.1

From their contribution to long-term returns to the role dividend policy plays in stock performance, there’s more to the dividend story than yield alone. And with trends such as elevated corporate cash levels and shifting investor demand, the case for understanding dividends may be as relevant now as it’s ever been.


The Long-Term View

Dividends have played a significant role in the returns investors have received during the last several decades. Going back to 1960, 85% of the cumulative total return of the S&P 500 Index2 can be attributed to reinvested dividends and the power of compounding, as illustrated in FIGURE 1 (30% on an average annual basis).


Figure 1

The Power of Dividends and Compounding
Growth of $10,000 (1960–2025)  

Power of Dividends and Compounding chart

As of 12/31/25. Past performance does not guarantee future results. Indices are unmanaged and not available for direct investment. Dividend-paying stocks are not guaranteed to outperform non-dividend-paying stocks in a declining, flat, or rising market. For illustrative purposes only. Data Sources: Morningstar and Hartford Funds, 3/26. 


Decade By Decade: How Dividends Impacted Returns

Looking at average stock performance over a longer time frame provides a more granular perspective. From 1940–2025, dividend income’s contribution to the total return of the S&P 500 Index averaged 33%. On a decade-by-decade basis, S&P 500 Index’s performance shows how dividends’ contribution varied greatly.


Figure 2

Dividends’ Contribution to Total Return Has Varied By Decade
S&P 500 Index Annualized Total Return by Decade (%)

Dividends' contribution to total return varies by decade chart

As of 12/31/25. Past performance does not guarantee future results. Indices are unmanaged and not available for direct investment. Total return for the S&P 500 Index was negative for the 2000s. Dividends provided a 1.8% annualized return over the decade. For illustrative purposes only. Data Sources: Morningstar and Hartford Funds, 3/26.


During the 1940s, 1960s, and 1970s, decades in which total returns were lower than 10%, dividends played a large role in terms of their contribution to total returns. By contrast, dividends played a smaller role during the 1950s, 1980s, 1990s, 2010s, and 2020s when average annual total returns for the decade were well into double digits.

During the 1990s, dividends were de-emphasized. At the time, companies thought they were better able to deploy their capital by reinvesting it in their businesses rather than returning it to shareholders. Significant capital appreciation year in and year out caused investors to shift their attention away from dividends. 


Dividends were de-emphasized in the 1990s, but regained investor attention following the dot-com bust.


From 2000 to 2009, a period often referred to as the “lost decade,” the S&P 500 Index produced a negative return. Thanks to the bursting of the dot-com bubble in March 2000, stock investors once again turned to fundamentals such as P/E ratios3 and dividend yields.4

FIGURE 3 summarizes the dividend yield for the S&P 500 Index from 1960–2025. According to Yale, the median dividend yield for the entire period was 2.83%, with yields peaking in the 1980s and bottoming in the 2000s. Today, some investors are increasingly seeking to reduce risk in their portfolios by shifting some gains from growth stocks into dividend-paying stocks.


Figure 3

The S&P 500 Index’s Dividend Yield Has Been Relatively Stable (1960–2025)

The S&P 500 index's yield has been relatively stable over the past decade

As of 12/31/25. Past performance does not guarantee future results. Indices are unmanaged and not available for direct investment. For illustrative purposes only. Data Sources: Yale and Hartford Funds, 3/26.


Highest Doesn’t Always Mean Best

Investors seeking dividend-paying investments may make the mistake of simply choosing those that offer the highest yields possible. A study conducted by Wellington Management reveals the potential flaws in this thinking.

Since 1930, the study found that stocks offering the highest level of dividend payouts performed in line overall with those that pay high, but not the very highest, level of dividends, though they often traded leadership over the decades.

This conclusion is counterintuitive: Why wouldn’t the highest-yielding stocks have the best historical total returns? Isn’t the ability to pay a generous dividend a sign of a healthy underlying business?

We’ll answer these questions in a moment, but we’ll begin by summarizing the methodology and findings of the study.

Wellington Management began by dividing dividend-paying stocks into quintiles by their level of dividend payouts. The first quintile (i.e., top 20%) consisted of the highest dividend payers, while the fifth quintile (i.e., bottom 20%) consisted of the lowest dividend payers.

FIGURE 4 summarizes the performance of the S&P 500 Index as a whole relative to each quintile over nine decades.


Figure 4

Second-Quintile Stocks Outperformed Most Often (1930–2025)
Percentage of Time Dividend Payers by Quintile Outperformed the S&P 500 Index (summary of data in FIGURE 5)

Second quintile stocks outperformed most often from 1930-2020 chart

As of 12/31/25. Past performance does not guarantee future results. Indices are unmanaged and not available for direct investment. Data Sources: Wellington Management and Hartford Funds, 3/26. 


Second-quintile stocks outperformed the S&P 500 Index in six out of 10 time periods (1930 to 2025), while all other quintiles outperformed just 50% of the time.


Figure 5

Compound Annual Growth Rate (%) for US Stocks by Dividend Yield Quintile by Decade
(1930–2025)

 
  S&P 500 Index 1st Quintile 2nd Quintile 3rd Quintile 4th Quintile  5th Quintile 
Jan 1930 to Dec 1939 -1.30 -1.50 -1.80 -0.60 -0.80 2.10
Jan 1940 to Dec 1949 9.10 13.90 13.00 10.10 8.80 6.80
Jan 1950 to Dec 1959 19.40 18.40 19.70 18.30 16.70 19.80
Jan 1960 to Dec 1969 7.90 8.60 9.00 6.70 7.80 9.30
Jan 1970 to Dec 1979 5.70 9.50 10.10 7.00 7.70 3.80
Jan 1980 to Dec 1989 17.60 20.50 19.10 17.30 16.00 14.60
Jan 1990 to Dec 1999 18.20 12.50 15.60 14.90 18.00 19.00
Jan 2000 to Dec 2009 -0.80 5.40 4.40 4.10 2.30 -1.70
Jan 2010 to Dec 2019 13.50 12.90 13.40 14.00 13.70 11.50
Jan 2020 to Dec 2025 15.17 13.40 10.37 9.77 16.36 20.80

As of 12/31/25. Past performance does not guarantee future results. Indices are unmanaged and not available for direct investment. US stocks are represented by the S&P 500 Index. Chart represents the compound annual growth rate (%) for US stocks by dividend yield quintile by decade from 1930-2019 and January 2020-December 2025. For illustrative purposes only. Data Sources: Wellington Management and Hartford Funds, 3/26.

The best way to measure whether a company will be able to pay a consistent dividend is through the payout ratio.


Payout Ratio: A Critical Metric

One reason why second-quintile dividend-paying stocks outperformed first quintile stocks over multiple decades is because the first-quintile’s excessive dividend payouts haven’t always been sustainable. The best way to measure whether a company will be able to pay a consistent dividend is through the payout ratio.

The payout ratio is calculated by dividing the yearly dividend per share by the earnings per share. A high payout ratio means that a company is using a significant percentage of its earnings to pay a dividend, which leaves them with less money to invest in future growth of the business.

The chart below illustrates the average dividend-payout ratio since 1983 for the first two quintiles of dividend payers within the Russell 1000 Index.5 The first-quintile stocks had an average dividend payout ratio of 72%, while the second quintile had a 49% average payout ratio.

A payout ratio of 72% could be difficult to sustain if a company experiences a drop in earnings. Once this happens, a company could be forced to cut its dividend. A dividend cut is often viewed in the financial markets as a sign of weakness and frequently results in a decline in the price of the company’s stock.


Figure 6

Average Dividend Payout Ratio
(1983-2025) 

74% 1st quintile, 41% 2nd quintile

As of 12/31/25. Past performance does not guarantee future results. Indices are unmanaged and not available for direct investment. Payout ratios illustrated are for stocks within the Russell 1000 Index. For illustrative purposes only. Data Sources: Wellington Management and Hartford Funds, 3/26.


Do Dividend Policies Affect Stock Performance?

In an effort to learn more about the relative performance of companies according to their dividend policies, Ned Davis Research conducted a study in which it divided companies into two groups based on whether or not they paid a dividend during the previous 12 months. It named these two groups “dividend payers” and “dividend non-payers.”

The “dividend payers” were then divided further into three groups based on their dividend-payout behavior during the previous 12 months. Companies that kept their dividends per share at the same level were classified as “no change.” Companies that raised their dividends were classified as “dividend growers and initiators.” Companies that lowered or eliminated their dividends were classified as “dividend cutters or eliminators.” Companies that were classified as either “dividend growers and initiators” or “dividend cutters and eliminators” remained in these same categories for the next 12 months, or until there was another dividend change.

For each of the five categories (dividend payers, dividend non-payers, dividend growers and initiators, dividend cutters and eliminators, and no change in dividend policy) a total-return geometric average was calculated; monthly rebalancing was also employed. 

It’s important to point out that our discussion is based on historical information regarding different stocks’ dividend-payout rates. Such past performance can’t be used to predict which stocks may initiate, increase, decrease, continue, or discontinue dividend payouts in the future.

Based on the Ned Davis study, it’s clear that companies that don’t pay dividends or cut their dividends suffered negative consequences. In FIGURE 7, dividend non-payers and dividend cutters and eliminators (e.g., companies that completely eliminated their dividends) were more volatile (as measured by beta6 and standard deviation)7 and fared worse than companies that maintained their dividend policy.


Since 1973, companies that grew or initiated dividends have delivered higher returns with lower volatility.


Lowest Risk and Highest Returns for Dividend Growers and Initiators

In contrast to companies that cut or eliminated their dividends, companies that grew or initiated a dividend have experienced the highest returns relative to other stocks since 1973—with significantly less volatility. This helps explain why so many financial professionals are now discussing the benefits of incorporating dividend-paying stocks as the core of an equity portfolio with their clients.


Figure 7

Average Annual Returns and Volatility by Dividend Policy
S&P 500 Index (1973-2025)

 
  Returns Beta Standard
Deviation
Dividend Growers & Initiators 10.22% 0.89 15.97%
Dividend Payers 9.20% 0.94 16.71%
No Change in Dividend Policy 6.87% 1.02 18.45%
Dividend Cutters & Eliminators  -0.96% 1.22 24.80%
Dividend Non-Payers 4.21% 1.18 21.91%
Equal-Weighted S&P 500 Index 7.74% 1.00 17.55%

As of 12/31/25. Past performance does not guarantee future results. Indices are unmanaged and not available for direct investment. For illustrative purposes only. Data Sources: Ned Davis Research and Hartford Funds, 3/26.


Dividend Growth May Be a Key to Outperformance

Corporations that consistently grow their dividends have historically exhibited strong fundamentals, solid business plans, and a deep commitment to their shareholders.

The market environment is also supportive of dividends. A strong US economy has helped companies grow earnings and free cash flow,8 resulting in near-record levels of cash on corporate balance sheets (FIGURE 9). 

This excess cash should allow businesses with existing dividends to maintain, if not grow, their dividends. 


Figure 8

Returns of S&P 500 Index Stocks by Dividend Policy: Growth of $100 (1973–2025)

Retuns of S&P 500 index stocks by dividend policy: growth of $100 chart

As of 12/31/25. Past performance does not guarantee future results. Indices are unmanaged and not available for direct investment. For illustrative purposes only. Data Sources: Ned Davis Research and Hartford Funds, 3/26.

The Future for Dividend Investors

Trend 1: High Corporate Cash Could Bode Well for Dividends

In the aftermath of the Global Financial Crisis (GFC), corporations began accruing record profits, and their balance sheets swelled as a result. Cash on corporate balance sheets have more than quadrupled since the early 2000s. Corporations can use this excess cash in a variety of ways, such as expanding their businesses or making acquisitions. While these options may be attractive in some environments, during uncertain times some corporations may be more cautious and choose to hold on to their cash in case of another economic downturn. Companies may also choose to use excess cash to initiate a dividend or increase their existing dividend payouts.

Figure 9

High Levels of Cash on Corporate Balance Sheets
(1945–3Q25)

Record levels of cash on corporate balance sheets chart

As of 9/30/25. Most recent data available. Data Sources: Federal Reserve and Hartford Funds, 3/26.

FIGURE 10 shows the confluence of two positive trends that could benefit dividend investors: high corporate profits for S&P 500 Index companies coupled with near record-low payout ratios. The average dividend payout ratio over the past 99 years has been 55.72%. As of December 31, 2025, the payout ratio stood at just 32.28%—leaving plenty of room for growth.

Figure 10

S&P 500 Index Dividend Payout Ratio Quarterly Data
(3/31/26–2025)

S&P 500 index dividend payout ratio quarterly data chart

■ S&P 500 Index GAAP Reported Earnings Per Share
 S&P 500 Dividends Per Share
■ Average Dividend Payout Ratio
 Dividend Payout Ratio % (Trailing 4Q Cash Dividends/Trailing 4Q Reported Earnings)

As of 12/31/25. Past performance does not guarantee future results. Indices are unmanaged and not available for direct investment. For illustrative purposes only. Data Sources: Ned Davis Research and Hartford Funds, 3/26.

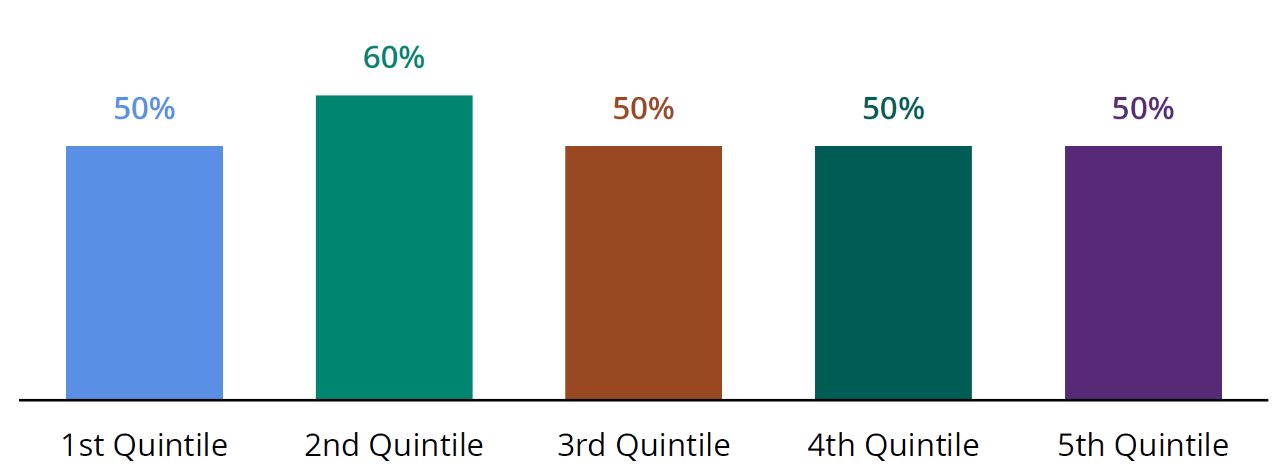
Trend 2: Many Retirees Are Seeking Yield and Capital Appreciation

Although bond yields have risen and can offer predictable income, bonds haven’t historically offered as much capital appreciation as stocks. Dividend-paying stocks may be appealing to many investors who are seeking yield along with growth potential. For example, retiring baby boomers who are searching for income-producing investments and institutional investors seeking yield may find dividend-paying stocks to be an attractive option.
 

Trend 3: Financial Repression and Institutional Investors

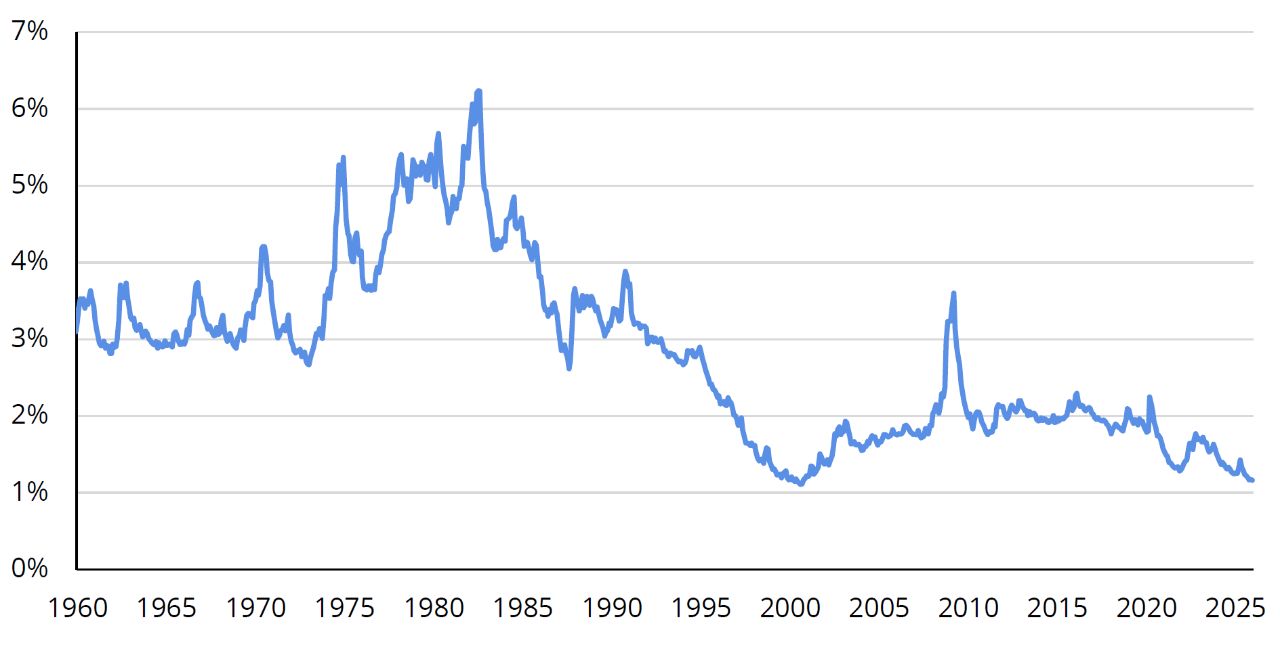
Following a prolonged period of near‑zero rates after the GFC, the US Federal Reserve (Fed) aggressively raised interest rates to combat post‑pandemic inflation. While rate cuts began in late 2024, the pace of easing slowed considerably through 2025. In 2026, interest rates remain elevated relative to the prior decade, reflecting a policy environment shaped by more than just short‑term economic cycles.

We generally think of monetary policy as a catalyst to help accelerate or decelerate economic activity, but it can also serve other purposes. During the prolonged low-rate era following the GFC, low interest rates benefited not only businesses and consumers who wanted to borrow money, but also the biggest debtor in the world, the US government, by keeping interest payments on the national debt manageable.

Now that rates have risen, that dynamic has shifted. Savers who were receiving startlingly low rates on CDs,9 money-market funds,10 and savings accounts11 are now earning more attractive yields. But higher rates have also increased the cost of servicing the national debt, putting additional pressure on an already burgeoning level of US government borrowing.

Low interest rates are especially problematic for institutional investors. How long can a pension plan with an actuarial discount rate of 6% or higher continue to accept 10-Year US Treasury bonds12 that yield around 4%?

Institutional investors who seek higher interest rates have numerous options, including high-yield bonds,13 bank loans,14 sovereign debt of foreign countries,15 REITs,16 and dividend-paying stocks.17

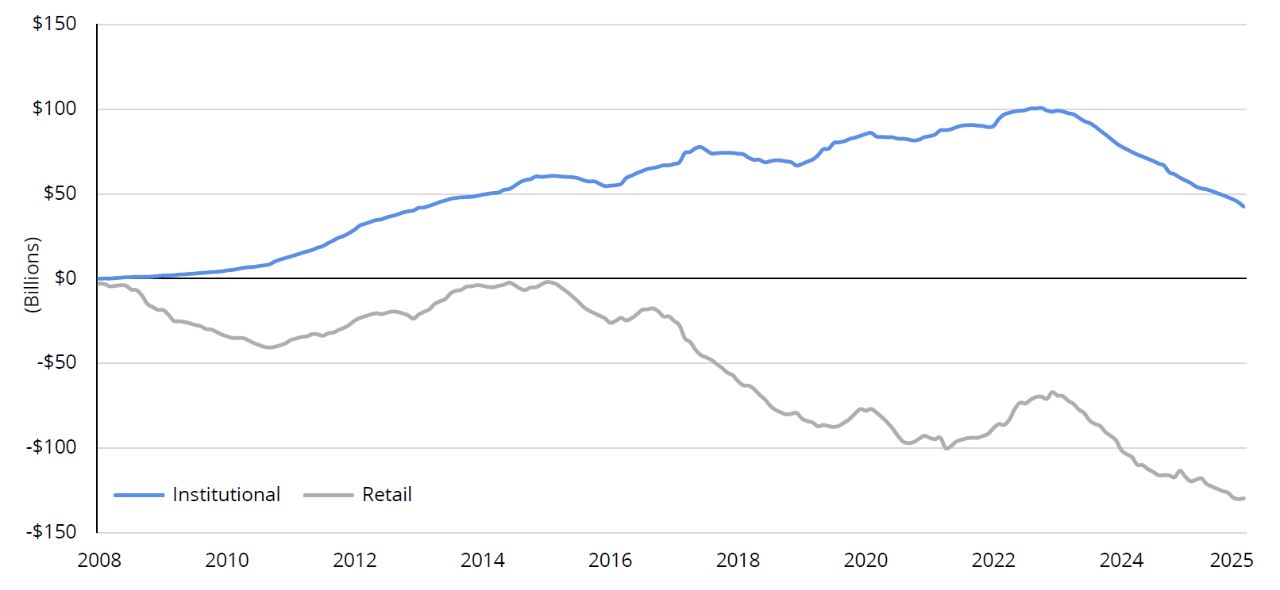
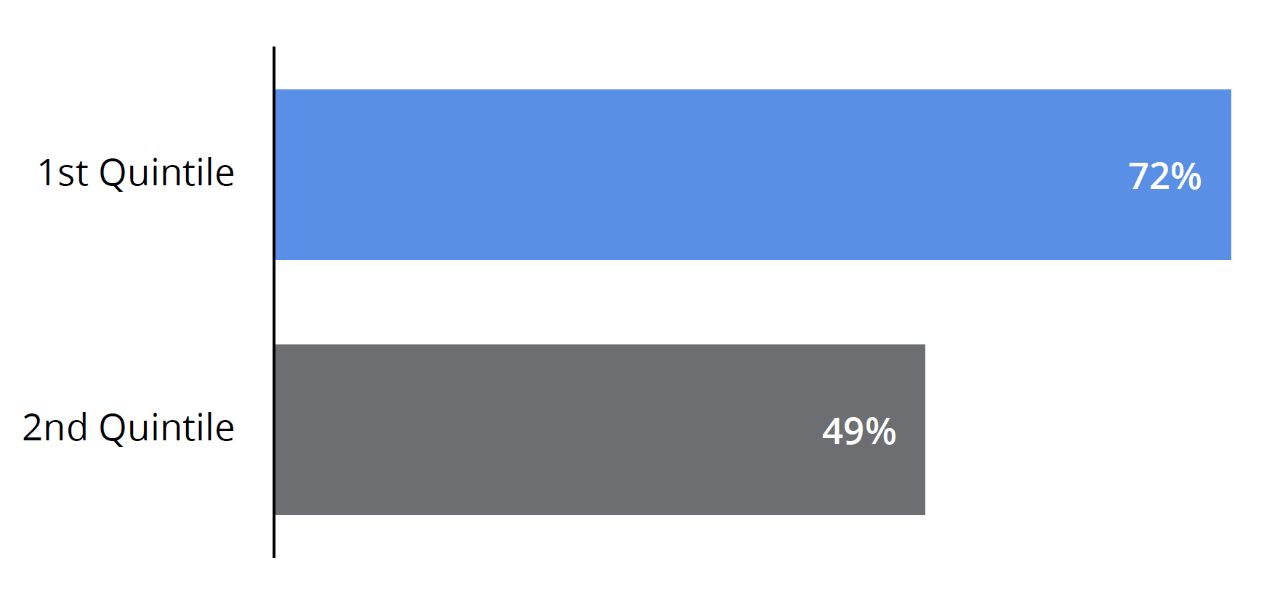
In fact, since 2008, some institutional investors have poured more than $42 billion into equity-income funds while individual investors have withdrawn nearly $130 billion over the same time period (see FIGURE 11). It’s not uncommon for institutional investors to be ahead of the general public when it comes to investing, but how long will this striking disparity last?

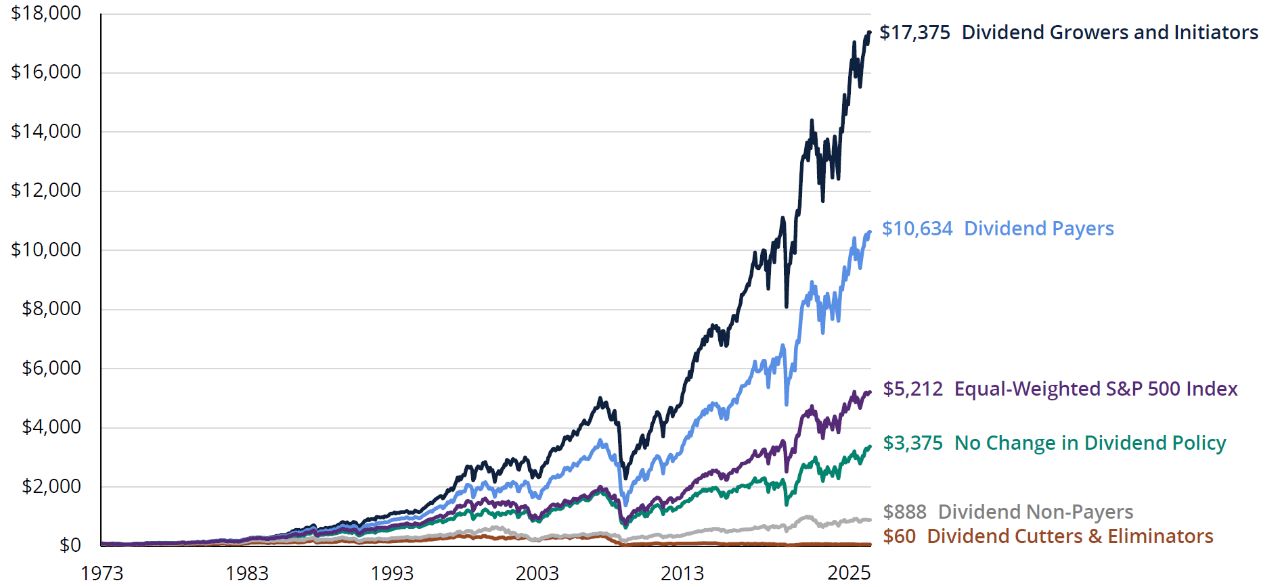
More recently, periods of market concentration and heightened volatility have brought renewed attention to dividend‑paying stocks, as both institutional and retail investors reassess sources of return beyond growth‑oriented segments of the market.

Figure 11

Institutional Investors Have Gravitated to Equity-Income Funds While Individual Investors Have Fled Them
Cumulative Net Asset Flows (2008–2025)

Instituitional investors have gravitated to equity-income mutual funds while individual investors have fled them

As of 12/31/25. Flows into the equity-income category can vary significantly from year to year as different funds move in and out of the category. Data Sources: Morningstar and Hartford Funds, 3/26.

Talk to your financial professional about the potential benefits of incorporating dividend-paying stocks into your portfolio.


Morningstar Ratings (Mutual Fund I-Shares) for Select Hartford Funds That Invest in Dividend-Paying Stocks

OVERALL
(as of 3/31/2026)
Overall, 4 stars, 3-Year, 3 stars, 5-Year, 3 stars, and 10-Year, 4 stars, rated against 1048, 1048, 983 and 823 products, respectively. Morningstar RatingTM is calculated for products with at least a 3-year history, based on a risk-adjusted return measure (excluding any applicable sale charges) and accounts for variations in a product's monthly performance. 5 stars are assigned to the top 10%; 4 stars to the next 22.5%, 3 stars to the next 35%, 2 stars to the next 22.5% and 1 star to the bottom 10%. ETFs and mutual funds are considered a single population. The Overall Rating is derived from a weighted average of the performance figures associated with its 3-, 5-, and 10-year (if applicable) Morningstar Rating metrics. For more information about these ratings, including their methodology, please go to global.morningstar.com/managerdisclosures . Ratings for other share classes may vary and are subject to change monthly. Past performance is no guarantee of future performance.
©2026 Morningstar, Inc. All rights reserved. The information contained herein: (1) is proprietary to Morningstar and/ or its content providers; (2) may not be copied or distributed; and (3) is not warranted to be accurate, complete or timely. Neither Morningstar nor its content providers are responsible for any damages or losses arising from any use of this information.

1048 Products | Large Value Category
Based on Risk-Adjusted Returns

1 Diversification does not ensure a profit or protect against a loss in a declining market.

2 S&P 500 Index is a market capitalization-weighted price index composed of 500 widely held common stocks.

3 Price/earnings (P/E) ratio is the ratio of a stock’s price to its earnings per share.

4 Dividend yield is a company’s dividend per share divided by its share price.

5 The Russell 1000 Index measures the performance of the large-cap segment of the US equity universe.

6 Beta is a measure of risk that indicates the price sensitivity of a security or a portfolio relative to a specified market index.

7 Standard deviation measures the portfolio’s total-return volatility. A higher standard deviation indicates greater historical volatility.

8 Free cash flow represents the cash a company can generate after accounting for capital expenditures needed to maintain or maximize its asset base.

9 A CD (certificate of deposit) is a savings certificate entitling the bearer to receive interest. A CD bears a maturity date, a specified fixed interest rate and can be issued in any denomination. CDs are insured up to $250,000 per depositor by the Federal Deposit Insurance Corporation (FDIC) or the National Credit Union Association (NCUA).

10 Money market funds are not insured or guaranteed by the Federal Deposit Insurance Corporation (FDIC) or any other government agency. Although the funds seek to preserve the value of the investment at $1.00 per share, it is possible to lose money by investing in the funds.

11 A savings account is an account provided by a bank for individuals to save money and earn interest on the cash held in the account. Savings accounts are typically insured by the Federal Deposit Insurance Corporation (FDIC) up to $250,000.

12 US Treasury bonds are backed by the US government and are guaranteed as to the timely payment of principal and interest. This guarantee does not apply to the value of fund shares.

13 High-yield securities, or “junk bonds,” are rated below-investment-grade because there is a greater possibility that the issuer may be unable to make interest and principal payments on those securities.

14 Bank loans are below-investment-grade, senior-secured, short-term loans made by banks to corporations. They are rated below-investment-grade because there is a greater possibility that the issuer may be unable to make interest and principal payments on those securities.

15 A government bond is a bond issued by a national government denominated in the country’s own currency. Bonds issued by national governments in foreign currencies are normally referred to as sovereign bonds. Timely payment of interest and principal payments on sovereign debt is dependent upon the issuing nation’s future economic health and taxing power.

16 A REIT, which stands for Real Estate Investment Trust, is a company that owns or manages income-producing real estate. REITs are dependent upon the financial condition of the underlying real estate. Risks associated with REITs include credit risk, liquidity risk, and interest-rate risk.

17 A stock is an instrument that signifies an ownership position (called equity) in a corporation, and represents a claim on its proportional share in the corporation’s assets and profits. Dividends are a distribution of a portion of a company’s earnings, decided by the board of directors, to a class of its shareholders. There are no guarantees connected with the dividend payouts for dividend-paying stocks.

Important Risks:  Investing involves risk, including the possible loss of principal. • Fixed income security risks include credit, liquidity, call, duration, and interest-rate risk. As interest rates rise, bond prices generally fall. • For dividend-paying stocks, dividends are not guaranteed and may decrease without notice. • Foreign investments may be more volatile and less liquid than U.S. investments and are subject to the risk of currency fluctuations and adverse political, economic and regulatory developments. • Different investment styles may go in and out of favor, which may cause a fund to underperform the broader stock market.

This information should not be considered investment advice or a recommendation to buy/sell any security. In addition, it does not take into account the specific investment objectives, tax and financial condition of any specific person. This information has been prepared from sources believed reliable but the accuracy and completeness of the information cannot be guaranteed. This material and/or its contents are current at the time of writing and are subject to change without notice.

WP106 5438761