Pre-Sales Support
Mutual Funds and ETFs - 800-456-7526
Monday-Thursday: 8:00 a.m. – 6:00 p.m. ET
Friday: 8:00 a.m. – 5:00 p.m. ET
Post-Sales and Website Support
888-843-7824
Monday-Friday: 9:00 a.m. - 6:00 p.m. ET
In the 1990 film “Crazy People,” an advertising executive decides to create a series of truthful ads. One of the funniest ads says, “Volvo—they’re boxy but they’re good.”
Dividend-paying stocks are like the Volvos of the investing world. They’re not fancy at first glance, but they have a lot going for them when you look deeper under the hood. In this insight, we’ll take a historical look at dividends and examine the future for dividend investors.
The Long-Term View
Dividends have played a significant role in the returns investors have received during the last several decades. Going back to 1960, 85% of the cumulative total return of the S&P 500 Index1 can be attributed to reinvested dividends and the power of compounding as illustrated in FIGURE 1 (30% on an average annual basis).
Figure 1
The Power of Dividends and Compounding
Growth of $10,000 (1960–2023)
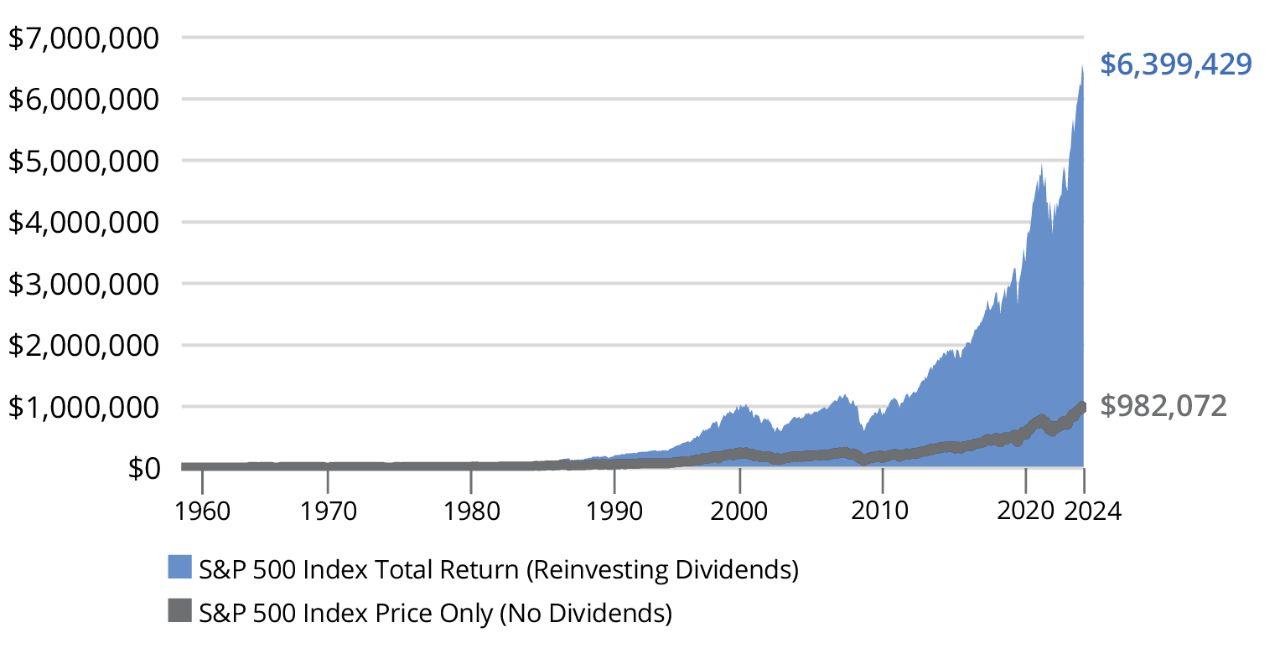
As of 12/31/24. Past performance does not guarantee future results. Indices are unmanaged and not available for direct investment. Dividend-paying stocks are not guaranteed to outperform non-dividend-paying stocks in a declining, flat, or rising market. For illustrative purposes only. Data Sources: Morningstar and Hartford Funds, 3/25.
Decade By Decade: How Dividends Impacted Returns
Looking at average stock performance over a longer time frame provides a more granular perspective. From 1940–2024, dividend income’s contribution to the total return of the S&P 500 Index averaged 34%. On a decade-by-decade basis, S&P 500 Index's performance shows how dividends’ contribution varied greatly from decade to decade.
Figure 2
Dividends’ Contribution to Total Return Has Varied By Decade
S&P 500 Index Annualized Total Return by Decade (%)
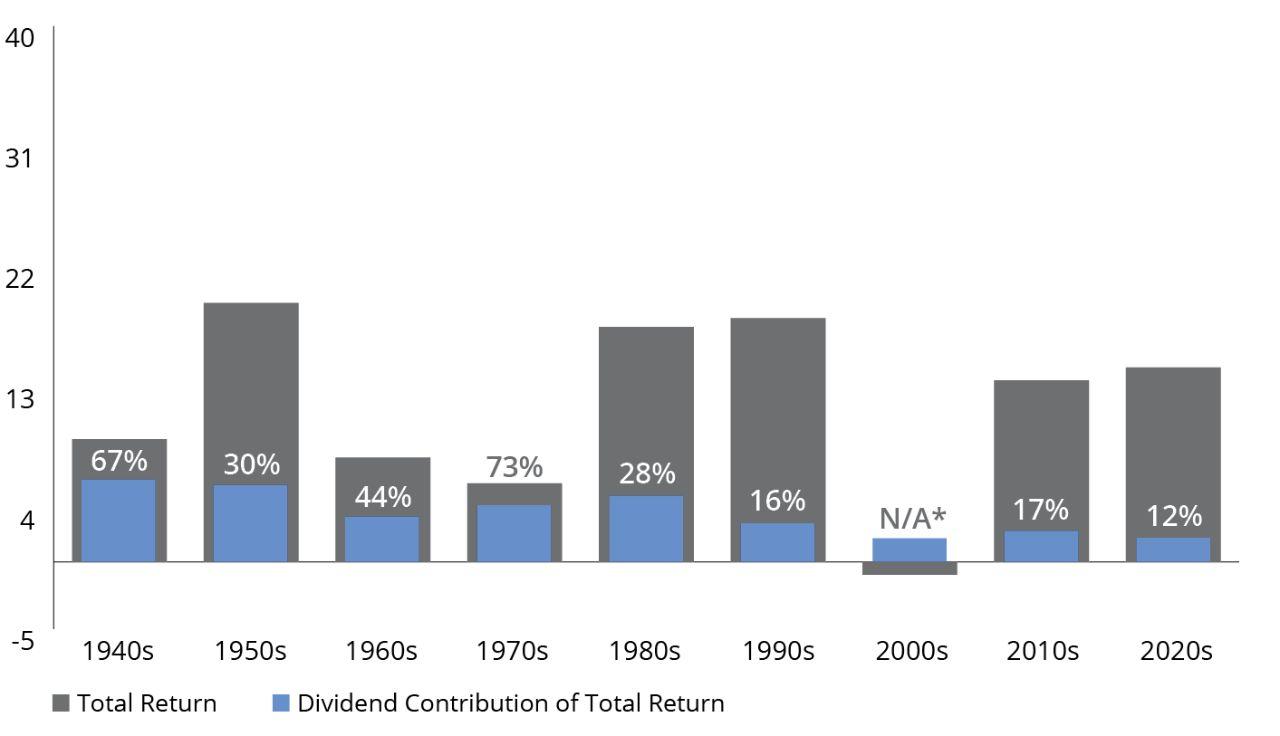
As of 12/31/24. Past performance does not guarantee future results. Indices are unmanaged and not available for direct investment. *Total return for the S&P 500 Index was negative for the 2000s. Dividends provided a 1.8% annualized return over the decade. For illustrative purposes only. Data Sources: Morningstar and Hartford Funds, 3/25.
During the 1940s, 1960s, and 1970s, decades in which total returns were lower than 10%, dividends played a large role in terms of their contribution to total returns. By contrast, dividends played a smaller role during the 1950s, 1980s, and 1990s when average annual total returns for the decade were well into double digits.
During the 1990s, dividends were de-emphasized. At the time, companies thought they were better able to deploy their capital by reinvesting it in their businesses rather than returning it to shareholders. Significant capital appreciation year in and year out caused investors to shift their attention away from dividends.
Dividends were de-emphasized in the 1990s, but after the dot-com bubble burst, investors once again turned their attention to dividends.
From 2000 to 2009, a period often referred to as the “lost decade,” the S&P 500 Index produced a negative return. Thanks to the bursting of the dot-com bubble in March 2000, stock investors once again turned to fundamentals such as P/E ratios2 and dividend yields.3
FIGURE 3 summarizes the dividend yield for the S&P 500 Index from 1960–2024. According to Yale, the median dividend yield for the entire period was 2.90%, with yields peaking in the 1980s and bottoming in the 2000s. Today, some investors are increasingly seeking to reduce risk in their portfolios by shifting some gains from growth stocks into dividend-paying stocks.
Figure 3
The S&P 500 Index’s Dividend Yield Has Been Relatively Stable
(1960–2024)
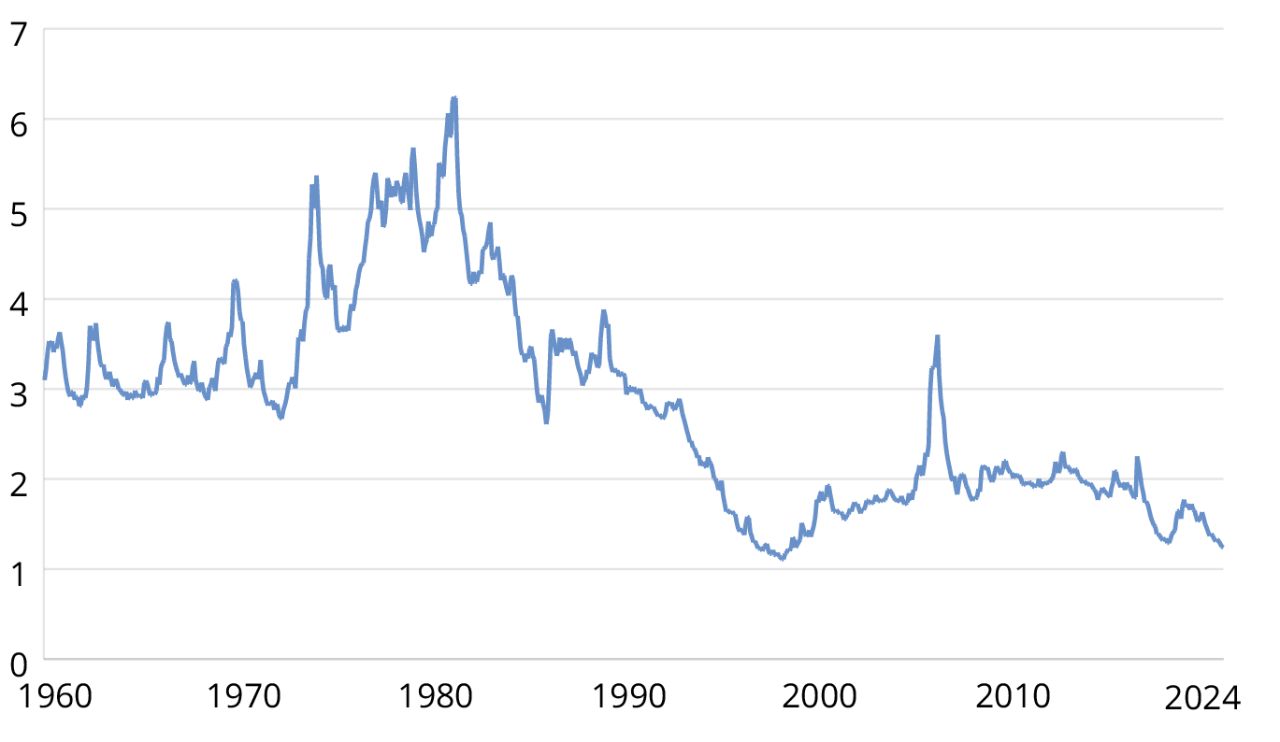
As of 12/31/24. Past performance does not guarantee future results. Indices are unmanaged and not available for direct investment. For illustrative purposes only. Data Sources: Yale and Hartford Funds, 3/25.
Highest Doesn’t Always Mean Best
Investors seeking dividend-paying investments may make the mistake of simply choosing those that offer the highest yields possible. A study conducted by Wellington Management reveals the potential flaws in this thinking.
Since 1930, the study found that stocks offering the highest level of dividend payouts performed in line overall with those that pay high, but not the very highest, level of dividends, though they often traded leadership over the decades.
Since 1930, stocks offering the highest level of dividend payouts performed in line overall with those that pay high, but not the very highest, level of dividends.
This conclusion is counterintuitive: Why wouldn’t the highest-yielding stocks have the best historical total returns? Isn’t the ability to pay a generous dividend a sign of a healthy underlying business?
We’ll answer these questions in a moment, but we’ll begin by summarizing the methodology and findings of the study.
Wellington Management began by dividing dividend-paying stocks into quintiles by their level of dividend payouts. The first quintile (i.e., top 20%) consisted of the highest dividend payers, while the fifth quintile (i.e., bottom 20%) consisted of the lowest dividend payers.
FIGURE 4 summarizes the performance of the S&P 500 Index as a whole relative to each quintile over nine decades.
Figure 4
Second-Quintile Stocks Outperformed Most Often (1930–2024)
Percentage of Time Dividend Payers by Quintile Outperformed the S&P 500 Index (summary of data in FIGURE 5)
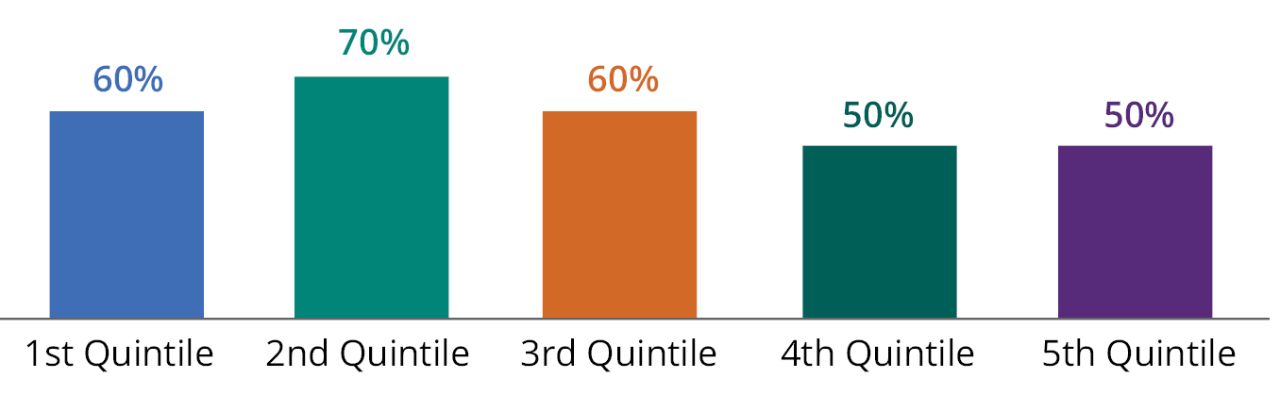
As of 12/31/24. Past performance does not guarantee future results. Indices are unmanaged and not available for direct investment. Data Sources: Wellington Management and Hartford Funds, 3/25.
The second-quintile stocks outperformed the S&P 500 Index in seven out of 10 time periods (1930 to 2024), while first- and third-quintile stocks came in second, beating the Index 60% of the time. Fourth- and fifth-quintile stocks lagged behind.
Figure 5
Compound Annual Growth Rate (%) for US Stocks by Dividend Yield Quintile by Decade
(1930–2024)
| S&P 500 Index | 1st Quintile | 2nd Quintile | 3rd Quintile | 4th Quintile | 5th Quintile | |
| Jan 1930 to Dec 1939 | -0.20 | -2.36 | 0.61 | -2.34 | -0.38 | 2.07 |
| Jan 1940 to Dec 1949 | 9.51 | 13.92 | 13.06 | 10.26 | 8.63 | 6.83 |
| Jan 1950 to Dec 1959 | 18.33 | 18.52 | 20.31 | 18.47 | 16.57 | 19.81 |
| Jan 1960 to Dec 1969 | 8.26 | 8.82 | 8.90 | 6.46 | 7.97 | 9.30 |
| Jan 1970 to Dec 1979 | 6.05 | 9.67 | 10.22 | 7.00 | 7.57 | 3.94 |
| Jan 1980 to Dec 1989 | 16.80 | 20.23 | 19.62 | 17.20 | 16.19 | 14.65 |
| Jan 1990 to Dec 1999 | 17.96 | 12.37 | 15.54 | 15.06 | 18.10 | 18.93 |
| Jan 2000 to Dec 2009 | -0.44 | 5.57 | 4.15 | 4.21 | 1.99 | -1.75 |
| Jan 2010 to Dec 2019 | 13.65 | 12.98 | 13.25 | 14.15 | 13.68 | 10.85 |
| Jan 2020 to Dec 2024 | 14.16 | 12.04 | 10.34 | 9.29 | 16.62 | 20.19 |
As of 12/31/24. Past performance does not guarantee future results. Indices are unmanaged and not available for direct investment. US stocks are represented by the S&P 500 Index. Chart represents the compound annual growth rate (%) for US stocks by dividend yield quintile by decade from 1930-2019 and January 2020-December 2024. For illustrative purposes only. Data Sources: Wellington Management and Hartford Funds, 3/25.
Payout Ratio: A Critical Metric
One reason why second-quintile dividend-paying stocks outperformed first quintile stocks over multiple decades is because the first-quintile’s excessive dividend payouts haven’t always been sustainable. The best way to measure whether a company will be able to pay a consistent dividend is through the payout ratio.
The best way to measure whether a company will be able to pay a consistent dividend is through the payout ratio.
The payout ratio is calculated by dividing the yearly dividend per share by the earnings per share. A high payout ratio means that a company is using a significant percentage of its earnings to pay a dividend, which leaves them with less money to invest in future growth of the business.
The chart below illustrates the average dividend-payout ratio since 1979 for the first two quintiles of dividend payers within the Russell 1000 Index.4 The first-quintile stocks had an average dividend payout ratio of 75%, while the second quintile had a 40% average payout ratio.
A payout ratio of 75% could be difficult to sustain if a company experiences a drop in earnings. Once this happens, a company could be forced to cut its dividend. A dividend cut is often viewed in the financial markets as a sign of weakness and frequently results in a decline in the price of the company’s stock.
Figure 6
Average Dividend Payout Ratio
(1979-2024)
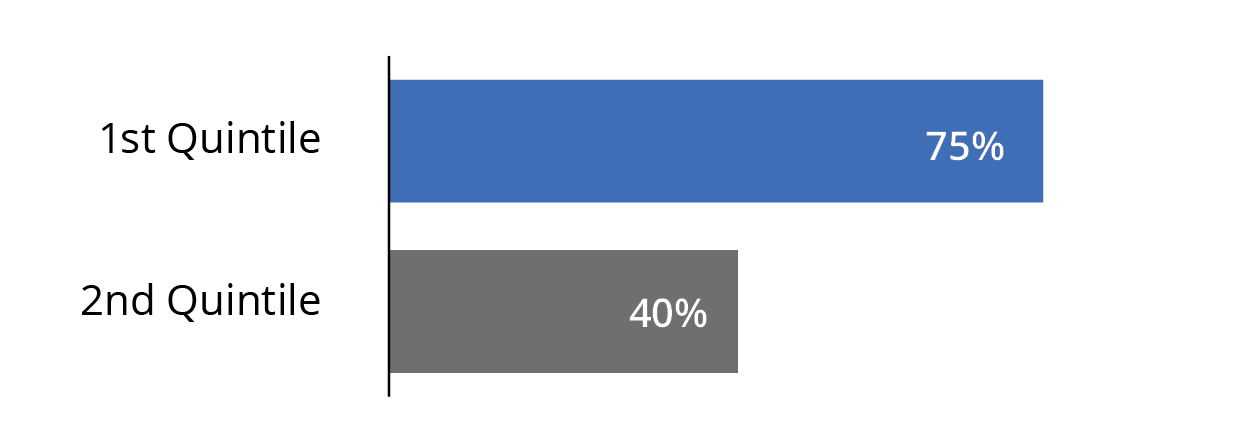
Chart Data: 1/31/79-12/31/24. Past performance does not guarantee future results. Indices are unmanaged and not available for direct investment. Payout ratios illustrated are for stocks within the Russell 1000 Index. For illustrative purposes only. Data Sources: Wellington Management and Hartford Funds, 3/25.
Do Dividend Policies Affect Stock Performance?
In an effort to learn more about the relative performance of companies according to their dividend policies, Ned Davis Research conducted a study in which it divided companies into two groups based on whether or not they paid a dividend during the previous 12 months. It named these two groups “dividend payers” and “dividend non-payers.”
The “dividend payers” were then divided further into three groups based on their dividend-payout behavior during the previous 12 months. Companies that kept their dividends per share at the same level were classified as “no change.” Companies that raised their dividends were classified as “dividend growers and initiators.” Companies that lowered or eliminated their dividends were classified as “dividend cutters or eliminators.” Companies that were classified as either “dividend growers and initiators” or “dividend cutters and eliminators” remained in these same categories for the next 12 months, or until there was another dividend change.
For each of the five categories (dividend payers, dividend non-payers, dividend growers and initiators, dividend non-payers, and no change in dividend policy) a total-return geometric average was calculated; monthly rebalancing was also employed.
It’s important to point out that our discussion is based on historical information regarding different stocks’ dividend-payout rates. Such past performance can’t be used to predict which stocks may initiate, increase, decrease, continue, or discontinue dividend payouts in the future.
Based on the Ned Davis study, it’s clear that companies that don’t pay dividends or cut their dividends suffered negative consequences. In FIGURE 7, dividend non-payers and dividend cutters and eliminators (e.g., companies that completely eliminated their dividends) were more volatile (as measured by beta5 and standard deviation)6 and fared worse than companies that maintained their dividend policy.
Lowest Risk and Highest Returns for Dividend Growers and Initiators
In contrast to companies that cut or eliminated their dividends, companies that grew or initiated a dividend have experienced the highest returns relative to other stocks since 1973—with significantly less volatility. This helps explain why so many financial professionals are now discussing the benefits of incorporating dividend-paying stocks as the core of an equity portfolio with their clients.
Companies that grew or initiated a dividend have experienced the highest returns relative to other stocks since 1973—with significantly less volatility.
Figure 7
Average Annual Returns and Volatility by Dividend Policy
S&P 500 Index (1973-2024)
| Returns | Beta | Standard Deviation |
|
| Dividend Growers & Initiators | 10.24% | 0.88 | 16.09% |
| Dividend Payers | 9.20% | 0.94 | 16.84% |
| No Change in Dividend Policy | 6.75% | 1.02 | 18.56% |
| Dividend Cutters & Eliminators | -0.89% | 1.21 | 24.94% |
| Dividend Non-Payers | 4.31% | 1.17 | 22.06% |
| Equal-Weighted S&P 500 Index | 7.65% | 1.00 | 17.71% |
As of 12/31/24. Past performance does not guarantee future results. Indices are unmanaged and not available for direct investment. For illustrative purposes only. Data Sources: Ned Davis Research and Hartford Funds, 3/25.
Dividend Growth May Be a Key to Outperformance
Corporations that consistently grow their dividends have historically exhibited strong fundamentals, solid business plans, and a deep commitment to their shareholders.
The market environment is also supportive of dividends. A strong US economy has helped companies grow earnings and free cash flow, resulting in near-record levels of cash on corporate balance sheets (FIGURE 9).
This excess cash should allow businesses with existing dividends to maintain, if not grow, their dividends.
Figure 8
Returns of S&P 500 Index Stocks by Dividend Policy: Growth of $100 (1973–2024)
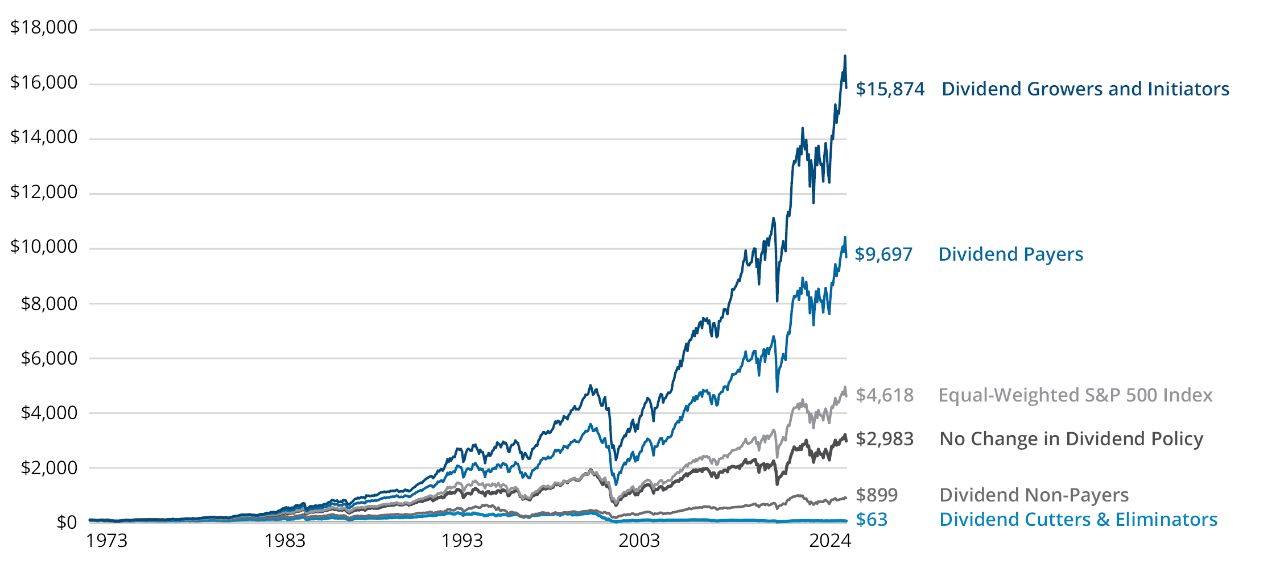
As of 12/31/24. Past performance does not guarantee future results. Indices are unmanaged and not available for direct investment. For illustrative purposes only. Data Sources: Ned Davis Research and Hartford Funds, 3/25.
The Future for Dividend Investors
Trend 1: High Corporate Cash Could Bode Well for Dividends
In the aftermath of the Global Financial Crisis, corporations began accruing record profits, and their balance sheets swelled as a result. Cash on corporate balance sheets has nearly quadrupled since the early 2000s. Corporations can use this excess cash in a variety of ways, such as expanding their businesses or making acquisitions. While these options may be attractive in some environments, during uncertain times some corporations may be more cautious and choose to hold on to their cash in case of another economic downturn. Companies may also choose to use excess cash to initiate a dividend or increase their existing dividend payouts.
Figure 9
High Levels of Cash on Corporate Balance Sheets
(1945–2024)
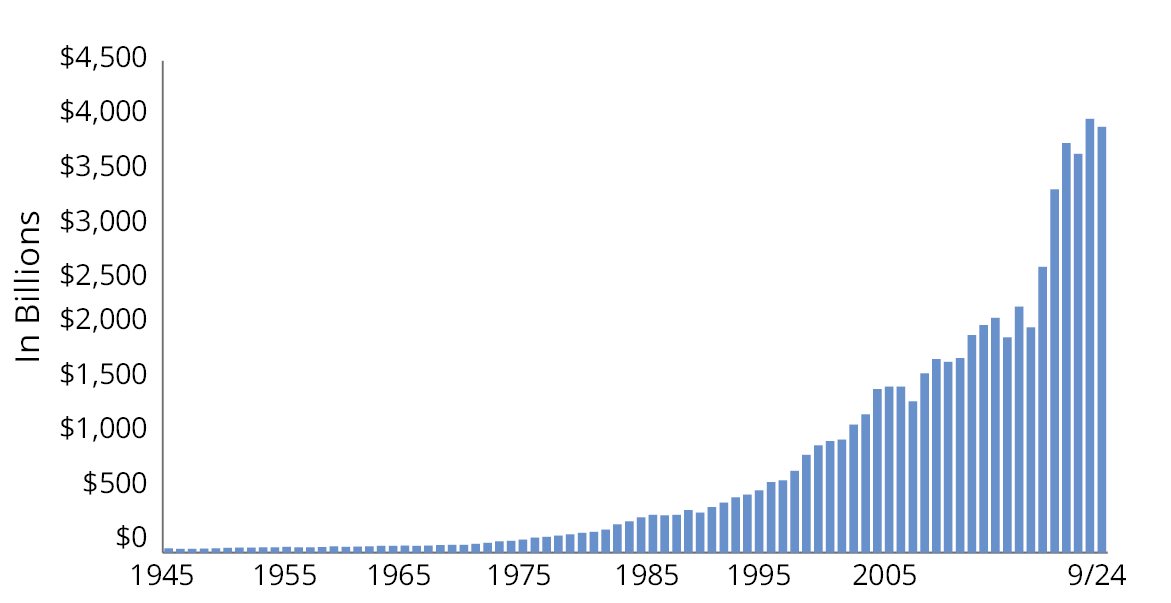
As of 9/30/24. Most recent data available. Data Sources: Federal Reserve and Hartford Funds, 3/25.
FIGURE 10 shows the confluence of two positive trends that could benefit dividend investors: high corporate profits for S&P 500 Index companies coupled with near record-low payout ratios. The average dividend payout ratio over the past 98 years has been 55.94%. As of December 31, 2024, the payout ratio stood at just 35.78%—leaving plenty of room for growth.
High corporate profits and near record-low payout ratios could benefit dividend investors.
Figure 10
S&P 500 Index Dividend Payout Ratio Quarterly Data
(3/31/1926–2024)
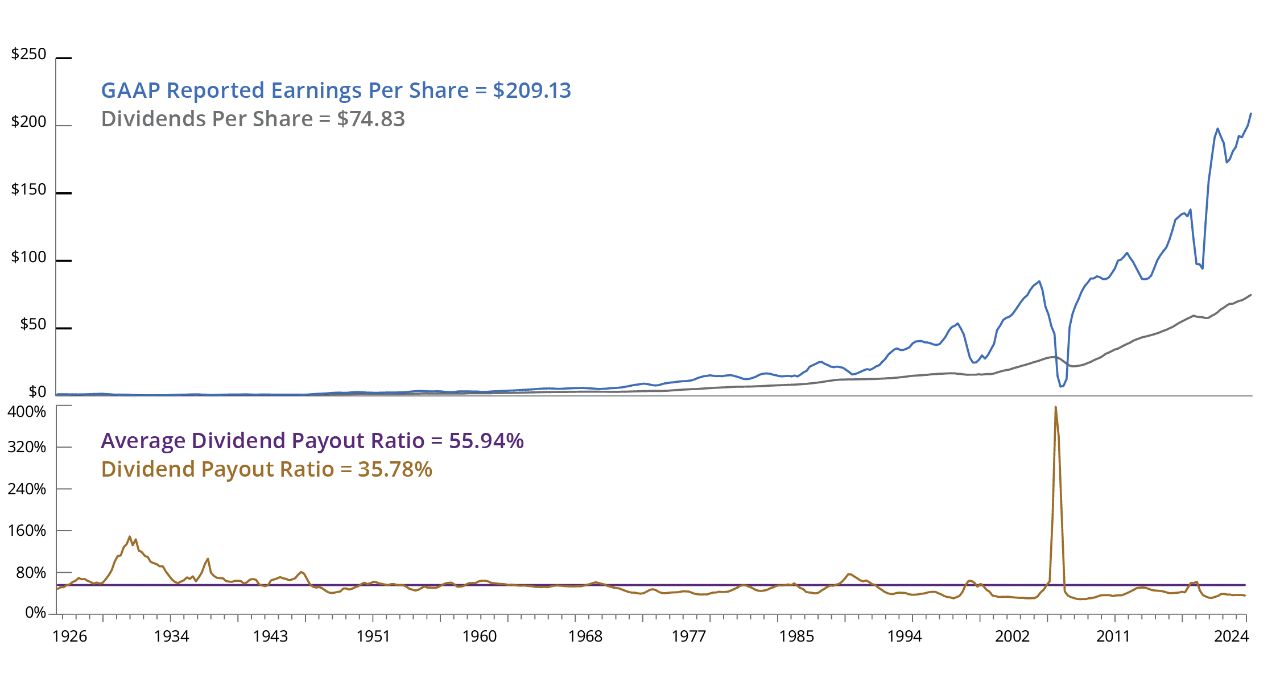
■ S&P 500 Index GAAP Reported Earnings Per Share
■ S&P 500 Dividends Per Share
■ Average Dividend Payout Ratio
■ Dividend Payout Ratio % (Trailing 4Q Cash Dividends/Trailing 4Q Reported Earnings)
As of 12/31/24. Past performance does not guarantee future results. Indices are unmanaged and not available for direct investment. For illustrative purposes only. Data Sources: Ned Davis Research and Hartford Funds, 3/25.
Trend 2: Many Retirees Are Seeking Yield and Capital Appreciation
Although bond yields have risen and can offer predictable income, bonds haven’t historically offered as much capital appreciation as stocks. Dividend-paying stocks may be appealing to many investors who are seeking yield along with growth potential. For example, retiring baby boomers who are searching for income-producing investments and institutional investors seeking yield may find dividend-paying stocks to be an attractive option.
Trend 3: Financial Repression and Institutional Investors
The US Federal Reserve (Fed) held interest rates low in the aftermath of the Great Recession and has since been working to normalize them. Although rates were increased to combat inflation, they were cut in 2024, and the cuts are projected to continue in 2025.
We generally think of monetary policy as a catalyst to help accelerate or decelerate economic activity, but it can also be used for other purposes. By keeping interest rates low, the Fed helped keep interest payments on the national debt low. In other words, low interest rates benefited not only businesses and consumers who wanted to borrow money, but also the biggest debtor in the world: the US government.
Low interest rates benefit debtors and can put savers at a disadvantage. Investors who have money in CDs,7 money-market funds,8 and savings accounts9 were receiving startlingly low rates until recently. Meanwhile, low interest rates made it easier for the US government to make payments on outstanding debt. These lower debt payments made severe austerity measures less necessary in the short term. But the burgeoning level of US government debt could one day lead to such measures.
Low interest rates are especially problematic for institutional investors. How long can a pension plan with an actuarial discount rate of 6% or higher continue to accept 10-Year US Treasury bonds10 that yield around 4%?
Institutional investors who seek higher interest rates have numerous options, including high-yield bonds,11 bank loans,12 sovereign debt of foreign countries,13 REITs,14 and dividend-paying stocks.15
In fact, since 2008, some institutional investors have poured nearly $47 billion into equity-income funds while individual investors have withdrawn nearly $123 billion from them over the same time period (see FIGURE 11). It’s not uncommon for institutional investors to be ahead of the general public when it comes to investing, but how long will this striking disparity last?
If technology stocks continue to struggle as they have in early 2025, both retail investors and institutional investors could look to dividend-paying stocks as an alternative.
Figure 11
Institutional Investors Have Gravitated to Equity-Income Funds While Individual Investors Have Fled Them
Cumulative Net Asset Flows (2008–2024)
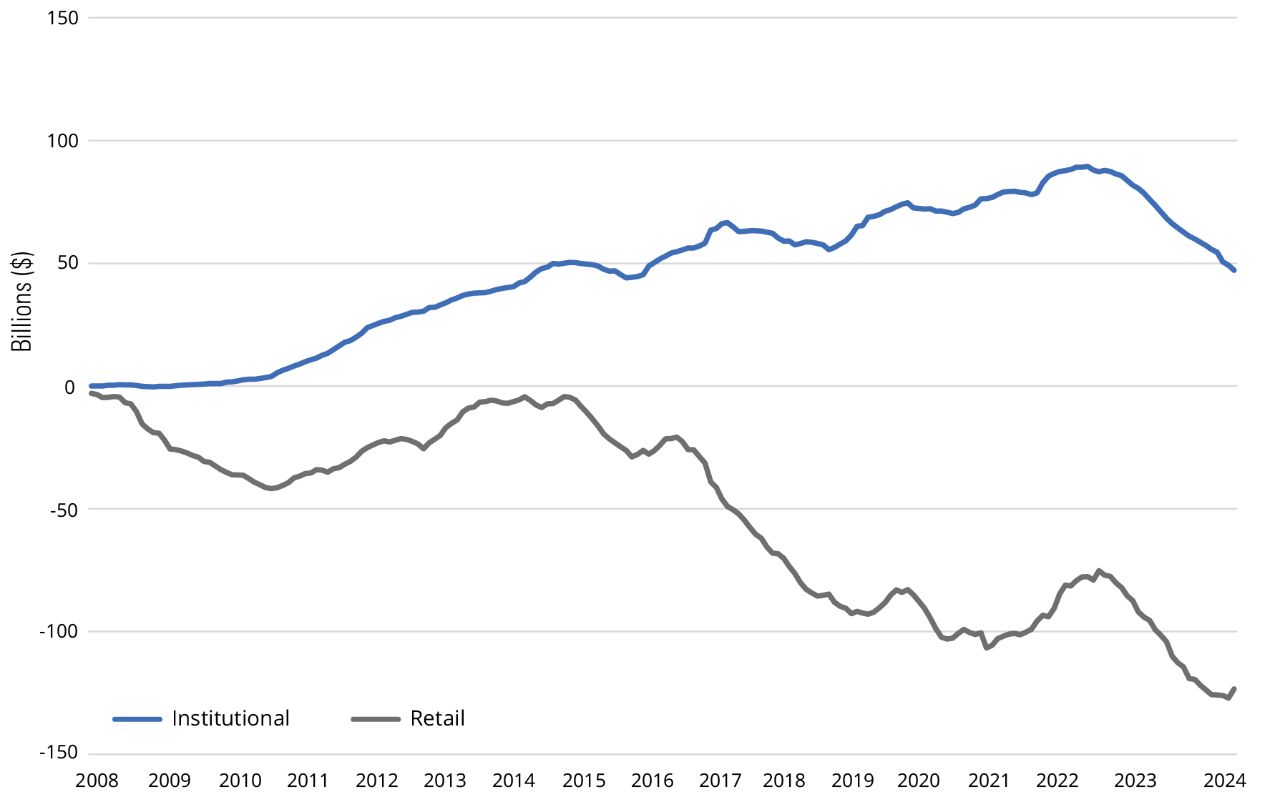
As of 12/31/24. Flows into the equity-income category can vary significantly from year to year as different funds move in and out of the category. Sources: Morningstar and Hartford Funds, 3/25.
Summary
Dividends have historically played a significant role in total return, particularly when average annual equity returns were lower than 10% during a decade.
Stocks in the highest quintile of dividend yields have historically underperformed stocks in the second quintile. Therefore, investors should only use yield as one of several considerations when selecting a dividend-paying investment.
Furthermore, dividend growers and initiators have historically provided greater total return with less volatility relative to companies that either maintained or cut their dividends.
Trends that bode well for dividend-paying stocks include historically high levels of corporate cash, their growth potential relative to bonds, and baby boomers’ demand for income that will last throughout retirement.
Institutional investors have been investing heavily in dividend-paying stocks and strategies, which has helped bolster their performance. Demand for these investments will only grow if retail investors follow the lead of institutional investors.
Talk to your financial professional about the potential benefits of incorporating dividend-paying stocks into your portfolio.
Morningstar Ratings (Mutual Fund I-Shares) for Select Hartford Funds that Invest in Dividend-Paying Stocks
1 S&P 500 Index is a market capitalization-weighted price index composed of 500 widely held common stocks.
2 Price/earnings “P/E” ratio is the ratio of a stock’s price to its earnings per share.
3 Dividend yield is a company’s dividend per share divided by its share price.
4 The Russell 1000 Index measures the performance of the large-cap segment of the US equity universe. It’s a subset of the Russell 3000 Index and includes approximately 1,000 of the largest securities based on a combination of their market cap and current index membership.
5 Beta is a measure of risk that indicates the price sensitivity of a security or a portfolio relative to a specified market index.
6 Standard deviation measures the portfolio’s total-return volatility. A higher standard deviation indicates greater historical volatility.
7 A CD (certificate of deposit) is a savings certificate entitling the bearer to receive interest. A CD bears a maturity date, a specified fixed interest rate and can be issued in any denomination. CDs are insured up to $250,000 per depositor by the Federal Deposit Insurance Corporation (FDIC) or the National Credit Union Association (NCUA).
8 Money market funds are not insured or guaranteed by the Federal Deposit Insurance Corporation (FDIC) or any other government agency. Although the funds seek to preserve the value of the investment at $1.00 per share, it is possible to lose money by investing in the funds.
9 A savings account is an account provided by a bank for individuals to save money and earn interest on the cash held in the account. Savings accounts are typically insured by the Federal Deposit Insurance Corporation (FDIC) up to $250,000.
10 US Treasury Bonds are backed by the US government and are guaranteed as to the timely payment of principal and interest. This guarantee does not apply to the value of fund shares.
11 High-yield securities, or “junk bonds,” are rated below-investment-grade because there is a greater possibility that the issuer may be unable to make interest and principal payments on those securities.
12 Bank loans are below-investment-grade, senior-secured, short-term loans made by banks to corporations. They are rated below-investment-grade because there is a greater possibility that the issuer may be unable to make interest and principal payments on those securities.
13 A government bond is a bond issued by a national government denominated in the country’s own currency. Bonds issued by national governments in foreign currencies are normally referred to as sovereign bonds. Timely payment of interest and principal payments on sovereign debt is dependent upon the issuing nation’s future economic health and taxing power.
14 A REIT, which stands for Real Estate Investment Trust, is a company that owns or manages income-producing real estate. REITs are dependent upon the financial condition of the underlying real estate. Risks associated with REITs include credit risk, liquidity risk, and interest-rate risk.
15 A stock is an instrument that signifies an ownership position (called equity) in a corporation, and represents a claim on its proportional share in the corporation’s assets and profits. Dividends are a distribution of a portion of a company’s earnings, decided by the board of directors, to a class of its shareholders. There are no guarantees connected with the dividend payouts for dividend-paying stocks.
Important Risks: Investing involves risk, including the possible loss of principal. • Fixed income security risks include credit, liquidity, call, duration, and interest-rate risk. As interest rates rise, bond prices generally fall. • For dividend-paying stocks, dividends are not guaranteed and may decrease without notice. • Foreign investments may be more volatile and less liquid than U.S. investments and are subject to the risk of currency fluctuations and adverse political, economic and regulatory developments. • Different investment styles may go in and out of favor, which may cause a fund to underperform the broader stock market.
This information should not be considered investment advice or a recommendation to buy/sell any security. In addition, it does not take into account the specific investment objectives, tax and financial condition of any specific person. This information has been prepared from sources believed reliable but the accuracy and completeness of the information cannot be guaranteed. This material and/or its contents are current at the time of writing and are subject to change without notice.