• Products
  • Insights
  • Practice Management
  • Resources
  • About Us

Fears are rising that the global economy could be heading in a stagflationary direction—one in which economic growth is weak and inflation high. Increasing tensions in the Middle East and the risk of rising energy prices only add to these worries. On average, this is the worst kind of environment for the stock market. But investors need not panic. Our analysis shows that stocks have performed well when there’s stagflation—just not as well as at other times.

Importantly, there’s been divergence in sector performance in these environments, and divergence in performance between companies may rise, too. There’s an argument that the sector allocation of European stock markets could benefit relative to the US. This would be problematic for many investors, given that the US dominates the global market.

In addition to the familiar valuation argument—that inexpensive European stocks present an opportunity relative to their expensive US counterparts—this increasing divergence in sector and company-specific performance is one more reason why we believe investors should be wary of passive approaches to investing in global equities today.


Why Does Stagflation Present a Challenge for Companies and Investors?
Low growth is bad for sales, as businesses and consumers tighten their belts. Demand is weak, and high inflation adds to the headache. In a buoyant economy, companies can pass on higher input costs to consumers. When demand is already weak, this isn’t so easy. Corporate profit margins often take a hit instead, putting additional downward pressure on earnings.

Besides weakening corporate fundamentals, the ability of central banks to stimulate demand by cutting interest rates is also hampered. When inflation is high, central banks typically want higher interest rates to bring inflation under control. And higher rates risk making the “stagnation” worse. But if the Federal Reserve (Fed) were to cut rates, that risks sending inflation even higher. There are no easy options.
 

How Do Stocks Perform During Stagflation?
In this analysis, we’ve defined stagflation fairly simply: real gross domestic product (GDP) growth below the previous 10-year average and Consumer Price Index (CPI)1 inflation above its 10-year average. By keeping things simple, we can analyze market performance over the past nearly 100 years. When it comes to analyzing sector performance, we cover the period since 1974.

We compare using 10-year averages rather than fixed rates of growth and inflation because what feels like low growth or high inflation to investors isn’t constant over time. It depends on what they’ve been used to. This is a less severe definition of stagflation than those that require the existence of a recession (negative growth).

As could be anticipated for the environment described above, stocks often find the going tougher during stagflation years compared with other environments. Based on data since 1926, the median yearly real return2 in a stagflation year has been about 0%. This is less than investors would typically want from equities over the long run, but it still means returns have been in line with inflation. In addition, in about half of these years they generated a positive real return—and, when these real returns have been positive, they’ve tended to be strong, averaging about 16%. In the interest of balance, it’s worth pointing out that when they were negative, they averaged -14%.


FIGURE 1

Equity Performance in Stagflationary Periods Has Been Historically Mixed
Real Returns With Inflation and Growth Above/Below 10-year Averages (1926-2024)*

Real Returns With Inflation and Growth Above/Below 10-year Averages (1926-2024)*

As of 12/31/24. Past performance does not guarantee future results. Indices are unmanaged and are unavailable for direct investment. * Calendar-year data (number of occurrences in brackets). High Inflation = inflation above the previous 10-year average, High Growth = real GDP above the 10-year average, and vice-versa for Low Inflation and Low Growth. Based on analysis of data on US equities 1926-2024. Because the first 10 years are used to calculate the first 10-year average, the total number of years used to calculate performance between 1926 and 2024 adds up to 89 years. Stocks represented by Ibbotson® SBBI® US Large-Cap Stocks (IA SBBI US Large Stock Index). See below for representative index definitions. Data Sources: Morningstar Direct, accessed via CFA Institute and Schroders.


Statistical analysis of how stocks have performed relative to cash in stagflation years compared with other times shows no significant statistical difference. In other words, any difference could be due to random noise rather than a meaningful relationship.

Do We Need an Earlier Crash or Rate Cuts for Stocks to Do Well During Stagflation? No
It’s worth asking if there are economic and market conditions necessary to support equities in these more favorable outcomes, to aid investment decision-making today. The number of stagflation years during which a positive real return was generated was small (only eight: 1967, 1971, 1975, 1979, 1980, 2006, 2007, and 2009), so we need to be wary of making bold claims. But that’s not the aim here. The data show that, even in this small sample, there’s been a diverse range of backdrops (FIGURE 2) that still allow for some conclusions to be drawn:

  • It isn’t necessary for the market to have fallen the year before (i.e., the good performance being a rebound). In most cases, it followed a year when real returns were positive (second-to-last column in FIGURE 2).
  • It isn’t necessary for interest rates to be cut. We assess this by comparing cash returns with the previous year (a lower figure implying rates were cut). In 1979, 1980, and 2006, rates were raised, and, in 2007, they were broadly flat (final column in FIGURE 2).
     

FIGURE 2

Real Returns During Stagflation: Not Tied to Previous Performance or Earlier Rate Cuts
Positive and Negative Returns When Inflation and Growth Sat Above and Below 10-year Averages (1926-2024)

Positive and Negative Returns When Inflation and Growth Sat Above and Below 10-year Averages (1926-2024)

As of 12/31/24. Past performance does not guarantee future results. Indices are unmanaged and are unavailable for direct investment. Figures are shown on a rounded basis. Calendar years shown are those where both real GDP growth was below the previous 10-year average and CPI inflation was above its 10-year average. Based on analysis of data on US equities 1926-2024. Because the first 10 years are used to calculate the first 10-year average, the total number of years used to calculate performance between 1926 and 2024 adds up to 89 years. Stocks represented by Ibbotson® SBBI® US Large-Cap Stocks (IA SBBI US Large Stock Index), cash by Ibbotson® US (30-day) Treasury Bills (IA SBBI US 30 Day TBill USD Index). See below for representative index definitions. Data Sources: Morningstar Direct, accessed via CFA Institute and Schroders.


There’s no historical reason why stocks need to fall if we enter a period of stagflation. There can be diminished conviction in favor of strong returns, but predicting doom isn’t appropriate, either.
 

With Stagflation, Some Sectors Have Done Better than Others
Sector data are only available since 1974, and that reduces the number of stagflation years we can analyze. In addition, sectors themselves have changed a lot over time. Communications Services used to consist of telecom companies, such as AT&T, whereas today Alphabet (Google) and Meta together make up nearly two-thirds of the sector on a market-capitalization4 basis. There are also important differences compared with past episodes of stagflation. In particular, the cause of high inflation in the past was often rising commodity prices. This time around, ample supply and weak demand kept commodity prices low before the recent rise in Israel-Iran tensions, while tariffs are the immediate source of inflation risk. Any conclusions from historical analysis must, therefore, come with lower conviction and be overlaid with qualitative judgement.


FIGURE 3

Sector Performance Is Mixed During Stagflation
US Sector Real Equity Returns When Inflation Is Above and Growth Below its 10-year Average (1974-2024)

US Sector Real Equity Returns When Inflation Is Above and Growth Below its 10-year Average (1974-2024)

As of 12/31/24. Past performance does not guarantee future results. Indices are unmanaged and are not available for direct investment. Figures are shown on a rounded basis. Based on analysis of data on sectors of the US equity market 1974-2024. Calendar years shown are those in which both real GDP growth was below the previous 10-year average and CPI inflation was above its 10-year average. Based on Datastream US sector indices.5 Data Sources: LSEG Datastream and Schroders.

High commodity prices have often been a cause of the high inflation during stagflationary periods.


 While acknowledging the caveats above, many of these divergences are intuitive:

  • Defensive sectors such as utilities and consumer staples have performed relatively well, as demand is less sensitive to the economic cycle.
  • Healthcare would also typically be classified as a defensive sector (its performance is less variable than that of the overall market, on average), so it’s interesting that its performance has underwhelmed when growth has been low and inflation high over the 1974-2024 period. It’s possible to analyze this sector over a longer history (back to 1927) using an alternative source, namely, the data library produced by highly regarded academic, Kenneth French.6 This isn’t possible for all other sectors on a consistent basis. When we do this, the healthcare sector’s performance ties in more with intuition. It performed well in the 1940s, ‘50s, ‘60s, ‘70s, ‘80s, and ‘90s episodes of stagflation but less well in the 2000s. Its median outperformance in a stagflation year over this longer period has been 4%. This allows us to take a more positive view on the sector’s performance during stagflation than the table above would suggest.
  • Energy and materials companies have typically performed well because high commodity prices have often been a cause of the high inflation during stagflationary periods. It’s said that the four most dangerous words in investing are “it’s different this time” but, without the recent rise in Middle Eastern tensions, things had looked different for these sectors this time. This relationship may not play out as in the past, but this will depend on events in the Middle East.
  • Real assets, such as real estate, can do relatively well, but this sector also has one of the widest ranges of outcomes. When it comes to individual investments, performance depends on the sector of the real estate market, the term length and inflation linkages built into the rental agreement, debt-maturity profile, and other factors. Real-estate investors have to understand the operational risk of their tenants if we enter stagflation.
  • Consumer discretionary has usually underperformed consumer staples, as individuals cut back on nonessentials.
  • Both IT and communication services have a poor track record. This is due to a combination of demand weakness alongside rising supply costs, but also valuation impacts. IT companies, especially growth-oriented ones, tend to have high price-to-earnings (P/E) ratios7 because investors expect strong future earnings. The higher interest rates that usually accompany stagflation reduce the present value8 of future earnings, hitting growth stocks such as IT companies particularly hard. This is also relevant for today’s crop of communication-services companies. One potential difference with today’s big growth companies is that many are highly profitable, cash-rich, and operate at a global scale. They’re not just growth stories—they’re also defensive in some ways, with strong balance sheets.
  • Financials have performed poorly. Often during stagflation, yields curves9 invert (flip from their usual upward-sloping shape in which longer-dated yields are higher than shorter-dated ones, to a downward-sloping one where the opposite is true). This happens as central banks keep short-term rates high to manage inflation while the market prices these rates to fall over time. “Safe haven” buying of government bonds can also be a factor pushing longer-dated yields lower. Inverted yield curves hurt banking profitability because banks must pay higher short-term interest rates on deposits while earning lower long-term rates on loans, compressing or even inverting their net interest margins. Banks also may have to shoulder rising defaults from borrowers and weak loan demand. A difference today is that yield curves have been steepening recently, as the market digests higher future inflation and expectations for increased government-bond issuance in the coming years. This has helped financials to perform well in 2025, at least so far. Expectations for banking-sector deregulation could also support profitability. So far so good, but serious growth concerns could easily lead to tumbling longer-term yields, putting this performance at risk.


Inverted yield curves hurt banking profitability because banks must pay higher short-term interest rates on deposits while earning lower long-term rates on loans. 


While many of these are intuitive, it’s important to again highlight the small sample size. When we run statistical tests, the only sectors that show significantly different performance during stagflation years are the materials and financials sectors. And, as explained above, there may be reasons to question whether either of these will persist this time around.
 

Do Any Global Stock Markets Have More, or Less, Favorable Sector Allocations?
When assessing this question, it’s important to complement historical analysis with qualitative judgement based on the current economic and market environment. The tariff shocks today are profoundly different from many stagflation experiences of the past.


FIGURE 4

Regional Market Composition

Regional Market Composition

Sector weights as of 3/20/24. Past performance does not guarantee future results. Indices are unmanaged and are unavailable for direct investment. Figures are shown on a rounded basis. Stagflation defined as both real GDP growth below the previous 10-year average and CPI inflation above its 10-year average. US = MSCI USA Index, UK = MSCI United Kingdom Index, EMU = MSCI EMU Index, JAP = MSCI Japan Index, MSCI ACWI = MSCI ACWI Index. See below for representative index definitions. Data Sources: LSEG Datastream and Schroders.


The US doesn't look like a candidate for strong performance if stagflation becomes a reality, in our view.


The US stands out for its large allocation to the IT sector, which has historically struggled during stagflation. Its communication-services behemoths, Alphabet and Meta, are also technology companies in all but sector classification (officially, both companies are grouped within communication services by GICS11). Furthermore, many of the companies in the IT and communications-services sectors have rich valuations. Many are also caught up in the trade war, given their complex global supply chains. In contrast, the US allocations to the sectors that have performed better during stagflation are all relatively low in absolute terms (totaling 16%). The US doesn’t look like a candidate for strong performance if stagflation becomes a reality, in our view.

On the one hand, the European market would appear to suffer from its large allocation to the industrials sector. Europe has also been very publicly in the firing line for President Donald Trump’s tariffs. However, Germany’s plans to increase borrowing to boost defense and infrastructure spending should support many European industrials, especially if there’s a bias towards “buying European” rather than from the US. Overweights to the utilities sector and underweights to IT and communication services could also be beneficial. In principle, the financials overweight is more problematic but, as it stands today, we think financials are in reasonable shape and benefitting from a steeper yield curve.9 This will be a sector to keep an eye on.

We think the UK market, which has been unloved by global investors for many years, is also an intriguing proposition. Its 17% allocation to the defensive consumer-staples sector is more than double any other major market. Plus, it has barely any exposure to the IT or communication-services sectors compared with elsewhere. But it also faces risks from its overweight allocation to energy, materials, and industrials vs. the rest of the world. Donald Trump has also suggested that he wants to put pressure on overseas healthcare companies. This could fight against the sector’s normally defensive qualities. Like Europe, the UK is overweight to financials. While not without risk, there’s potential to turn negative perceptions about the UK market’s boring, defensive nature to its advantage. It also remains cheaply valued compared with overseas markets and, therefore, has a more favorable starting point.

Japan is weighed down by large allocations to global industrials (which are sensitive to international trade) and to consumer discretionary. These sectors make up 43% of the MSCI Japan Index. It also doesn’t have an overweight allocation to any of the sectors that one would anticipate could perform better. There are positive developments in corporate governance in Japan (moves to more shareholder-friendly approaches) and valuations are outright cheap, but the global backdrop is challenging.

Sector allocations are also not particularly favorable for emerging-market equities, with overweights in consumer discretionary, communication services, and financials.

Whichever market you examine, there’ll be winners and losers. Sector allocations can provide useful insights into potential risks, but it’s only by analyzing individual company fundamentals that investors can hope to identify those which have the potential to thrive and those which risk underperforming.


Japan is weighed down by large allocations to global industrials (which are sensitive to international trade) and to consumer discretionary. 


What Does This Mean for Today?
At the end of the first quarter of 2025, the 12-month US inflation rate of 2.7% was 0.2% below its 10-year average, and real GDP growth of 2.0% vs. Q1 2024 was 0.5% below its 10-year average. This put it in the Low-Inflation/Low-Growth basket, but it would only take a small rise in inflation to push it into the High-Inflation/Low-Growth stagflation environment described in this article. A rise in oil priced on the back of increased Middle Eastern tensions could nudge the economy further in that direction.

Much is written about stagflation, with the potential to cause equity investors to panic. In this article we’ve set forth reasons why we think this may be overblown. We can draw four conclusions:

  1. Stocks performed worse during stagflation than at other times, but the difference hasn’t been statistically significant. Historically, stocks have outperformed cash and kept pace with inflation. There can be diminished conviction in favor of strong returns, but predictions of doom aren’t appropriate either. There’s always a reason to worry, and we think long-term investors may benefit from staying invested.
  2. Good performance in stagflation is not dependent on the market having fallen beforehand (i.e., a rebound). Nor are rate cuts a necessary ingredient. This should provide some comfort to equity investors today.
  3. Performance during stagflation varies a lot between sectors, and across historical episodes. Based on qualitative judgment and intuition, the US and Japanese markets look negatively exposed to stagflation risk. Europe and the UK are more interesting propositions. Investors passively tracking the global market could find this uncomfortable, given the MSCI World Index has 70% in the US, and the MSCI ACWI Index has 66%. Stagflation could encourage the broadening-out trend seen so far in 2025 to continue.
  4. While we haven’t analyzed individual company financials within this article, it should be obvious that there will be increased variation in performance at the company level in the event of stagflation. Balance-sheet resilience and pricing power will be important. As correlations among stocks fall and dispersion in returns rise, the potential for active managers to add significant value could rise with it.


Talk to your financial professional to learn more about the potential impact of inflaton and lower growth. 


1 The Consumer Price Index (CPI) in the United States is defined by the Bureau of Labor Statistics as a measure of the average change over time in the prices paid by urban consumers for a market basket of consumer goods and services.

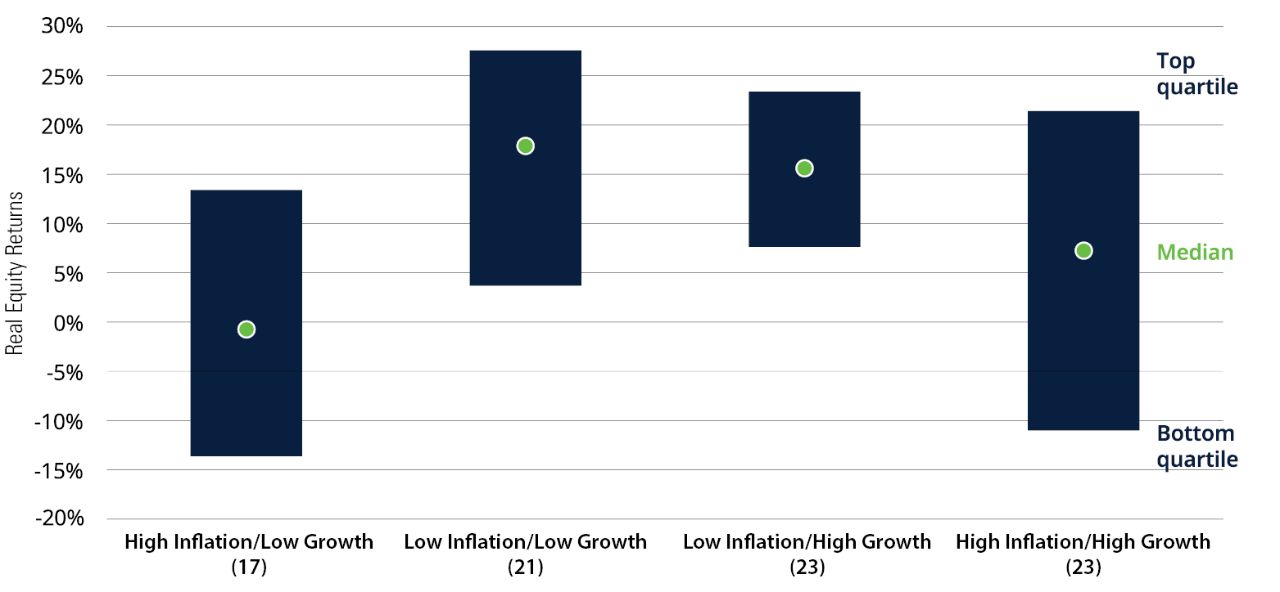
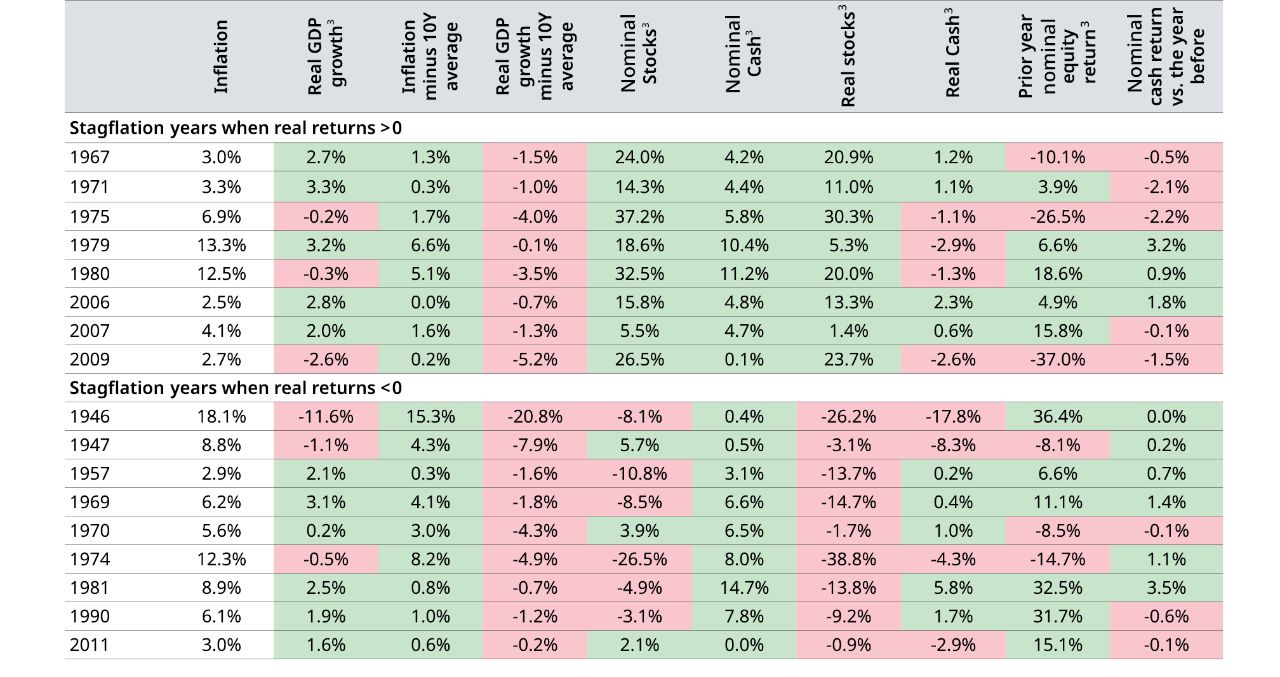
2 The real return on an investment is its annual growth rate after adjusting for the effects of inflation. It represents the actual increase in purchasing power an investor gains from an investment, reflecting the change in the value of money over time.

 3 Real GDP is the value of a country’s total output of goods and services adjusted for inflation or deflation. It allows economists, policymakers, and analysts to assess the underlying growth of an economy without the distortion caused by changes in prices. Nominal GDP, also called “current dollar” GDP, is the total in dollars (or any other currency) of goods and services consumed, plus government expenditures, investments, and exports, minus total imports. In the context of equities, the nominal value of a company’s stock is a value assigned when it is issuing share capital. It is the lowest limit set to the value of a share of stock and has nothing to do with the real value, which is the price at which the shares are traded.

4 Market capitalization, or market cap, is the current market value of all of a company’s outstanding stock shares. Market cap is often used to indicate a company’s size and worth in comparison to its peers.

5 LSEG DataStream provides sector indices that are based on the TRBC (The Reference Data Business Classification) industry classification. These indices allow for the analysis and comparison of developed, emerging, and select frontier markets across various levels of granularity. They are highly correlated with popular global benchmarks and cover over 99.5% of the investable market capitalization for each market.

6 Source: Kenneth French data library available at: https://mba.tuck.dartmouth.edu/pages/faculty/ken.french/data_library.html

7 The price-to-earnings (P/E) ratio measures a company’s share price relative to its earnings-per-share and helps assess the relative value of a company’s stock.

8 Present value is based on the concept that a sum of money in hand today is probably worth more than the same sum in the future because it can be invested and earn a return in the meantime. Calculating present value allows an investor to compare the potential performance of various investments by determining the current worth of the number of dollars that each investment will return by a future date.

9 The yield curve is a line that plots interest rates of bonds having equal credit quality but differing maturity dates; its slope is used to forecast the state of the economy and interest-rate changes.

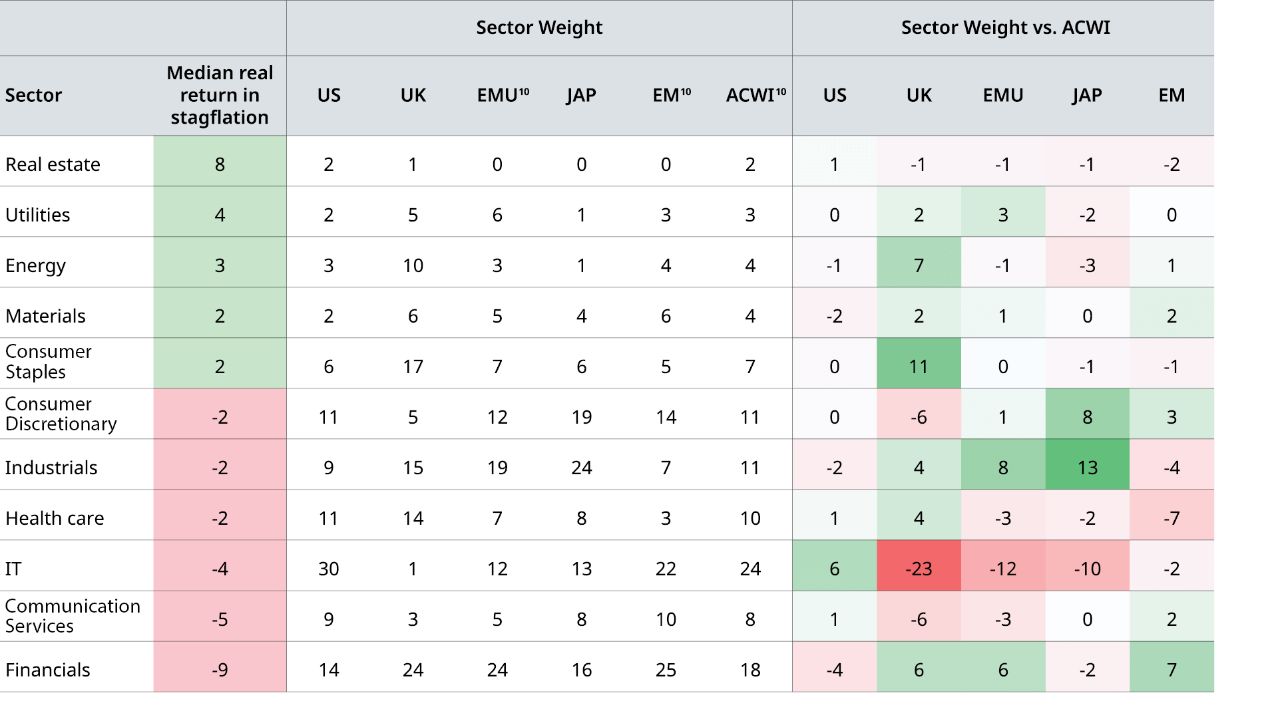
10 EM refers to emerging markets, defined as markets that are transitioning from a developing to a developed stated, characterized by rapid growth, increasing industrialization, and growing integration with the global economy. EMU refers to the MSCI EMU Index (European Economic and Monetary Union), which captures large and mid-cap representation across the developed market counties in the European Economic and Monetary Union. ACWI refers to the MSCI ACWI Index, which captures large and mid-cap representation across developed-market and emerging-market countries.

11 GICS, or the Global Industry Classification Standard, is a hierarchical system used to categorize companies by industry, developed by MSCI and S&P Dow Jones Indices. It provides a common framework for investors, analysts, and other market participants to understand and compare companies based on their business activities. The GICS structure includes four levels: Sectors, Industry Groups, Industries, and Sub-Industries.


The IA SBBI US Large Stock Index is an index that measures the performance of the U.S. large-cap equity market. It is part of the Ibbotson Associates Stocks, Bonds, Bills and Inflation (SBBI) series and is used to provide historical data and insights into the performance of this market segment.

The IA SBBI US 30 Day TBill USD Index measures the performance of a single issue of outstanding Treasury bill which matures closest to, but not beyond, one month from the rebalancing date. The issue is purchased at the beginning of the month and held for a full month; at the end of the month that issue is sold and rolled into a newly selected issue.

The MSCI USA Index is designed to measure the performance of the large and mid cap segments of the US market. The index covers approximately 85% of the free float-adjusted market capitalization in the US.

The MSCI United Kingdom Index is designed to measure the performance of the large and mid cap segments of the UK market. The index covers approximately 85% of the free float-adjusted market capitalization in the UK.

The MSCI EMU Index (European Economic and Monetary Union) captures large and mid cap representation across the 10 Developed Markets countries in the EMU. With 219 constituents, the index covers approximately 85% of the free float-adjusted market capitalization of the EMU.

The MSCI Japan Index is designed to measure the performance of the large and mid cap segments of the Japanese market. The index covers approximately 85% of the free float-adjusted market capitalization in Japan.

The MSCI ACWI Index captures large and mid cap representation across Developed Markets (DM) and Emerging Markets (EM) countries. The index covers approximately 85% of the global investable equity opportunity set.

Important Risks: Investing involves risk, including the possible loss of principal. • Foreign investments may be more volatile and less liquid than U.S. investments and are subject to the risk of currency fluctuations and adverse political, economic and regulatory developments. These risks may be greater, and include additional risks, for investments in emerging markets. • Focusing on one or more sectors, may subject inventors  to increased volatility and risk of loss if adverse developments occur. • Risks of focusing investments on the healthcare related sector include regulatory and legal developments, changes in funding or subsidies, patent and intellectual property considerations, intense competitive pressures, rapid technological changes, long and costly process for obtaining product approval by government agencies, potential product obsolescence, rising cost of medical products and services, and price volatility risk. • Investments in the commodities market may increase the Fund’s liquidity risk, volatility and risk of loss if adverse developments occur. Investments linked to prices of commodities may be considered speculative. • The value of the underlying real estate of real estate related securities may go down due to various factors, including but not limited to, strength of the economy, amount of new construction, laws and regulations, costs of real estate, availability of mortgages and changes in interest rates.

The views expressed herein are those of Schroders Investment Management, are for informational purposes only, and are subject to change based on prevailing market, economic, and other conditions. The views expressed may not reflect the opinions of Hartford Funds or any other sub-adviser to our funds. They should not be construed as research or investment advice nor should they be considered an offer or solicitation to buy or sell any security. This information is current at the time of writing and may not be reproduced or distributed in whole or in part, for any purpose, without the express written consent of Schroders Investment Management or Hartford Funds.


WP842 4650085
Insight from sub-adviser Schroders Investment Management
Author Headshot
Head of Strategic Research