Pre-Sales Support
Mutual Funds and ETFs - 800-456-7526
Monday-Thursday: 8:00 a.m. – 6:00 p.m. ET
Friday: 8:00 a.m. – 5:00 p.m. ET
Post-Sales and Website Support
888-843-7824
Monday-Friday: 9:00 a.m. - 6:00 p.m. ET
| 1 | Put points in perspective – Headlines sometimes bear news of the Dow Jones Industrial Average (Dow) dropping, inciting market fear. But it’s all relative. A 1% swing at year-end 2025 levels was equal to 481 points. When the Dow was at 10,000 points, a 1% swing was only 100 points. Volatility is a matter of perspective. |
| 2 | There’s an index for that – The Cboe VIX Index (VIX), or “fear index,” measures the market’s expectations for volatility over the next 30 days. The VIX tends to have an inverse correlation to the S&P 500 Index: When the market is down, fear is up, and vice versa. A score below 20 generally indicates investor contentment; a score above 30 suggests anxiety. |
| 3 | The only thing to fear is extreme fear itself – A VIX score of 40 or higher indicates extreme fear among investors. This doesn’t happen often. In fact, since 2010, the VIX has only spiked so high on 55 trading days.1 |
| 4 | Don’t let bad days blind you to good days – Since the VIX’s inception in 1990, 60% of the days of extreme fear occurred in 2008 and 2009, during the Global Financial Crisis. Most years—26 since 1990, to be exact—didn’t see a single day when the VIX hit over 40. Historically, extreme fear has been the exception, not the rule. |
| 5 | Volatility in 2025 was up, but not by much – Despite a year of heavy tariff turbulence, volatility in the S&P 500 Index in 2025 was just a percentage point less than the 10-year historical average from 2015-2024. Only 22% of trading days in 2025 had swings of +/-1%.2 |
| 6 | Patience is a virtue? – While investing in the stock market has its ups and downs, the longer an investor stays invested, the less significant those bumps in the road appear. As represented by the S&P 500 Index, stocks have tended to be up more often for investors who held on for longer (see charts below). |
| 7 | No one said it would be easy – From 1986 to 2025, the S&P 500 Index returned an average of 11.47% per year, and investors may have expected similar 11% returns in any individual year. However, there were only three years in which the Index returned between 9% and 12% during this period. Volatility is much easier to tolerate when you expect it. |
| 8 | Want to minimize volatility? – If market volatility makes you uncomfortable, you can work with a financial professional to include investments in your portfolio that specifically seek to help minimize volatility—without abandoning growth-oriented investments. |
| 9 | Or embrace volatility? – If you’re able to put aside the day-to-day discomfort of market volatility, it could provide the opportunity for higher returns. While trying to time the market is ill-advised, investing during down markets is exactly in line with the old financial adage “buy low, sell high.” |
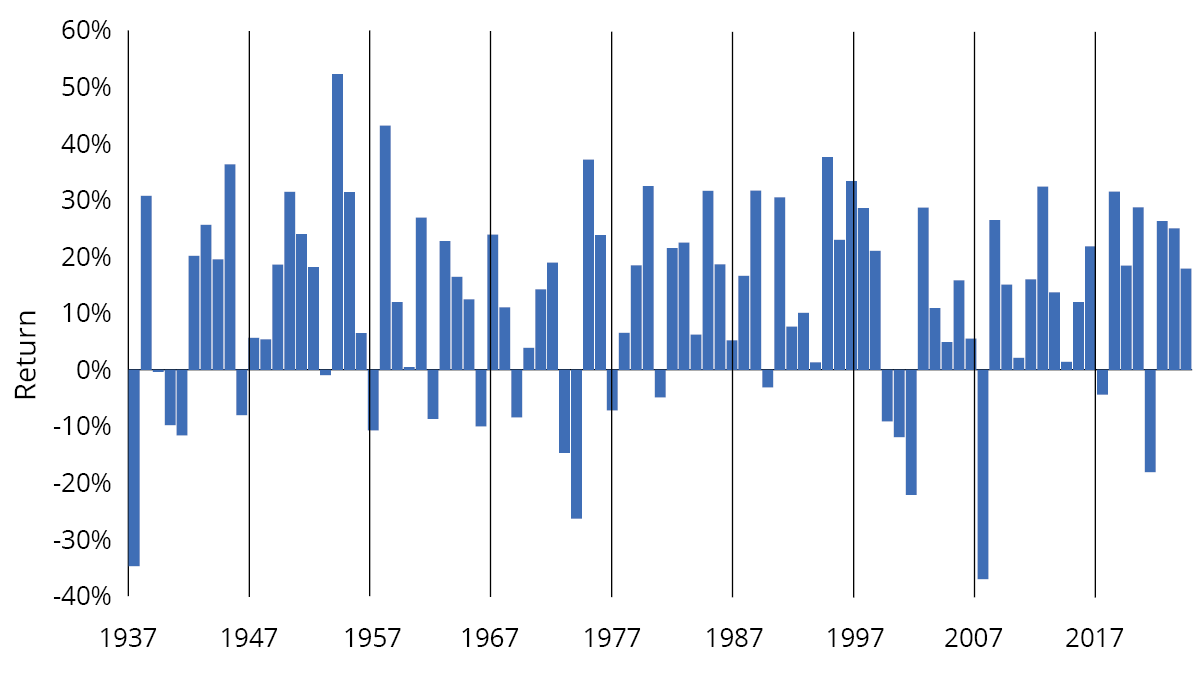
| 10 | Remember, the glass has been more than half full, historically – If you’re swept up in volatility, remember that markets have been positive more often than not. In fact, stocks have turned in a positive return 68 out of the last 88 calendar years, which means they’ve been on the rise 76% of the time (see chart below).3
|
Long-Term Investors Have Historically Seen Less Volatility
Each of the charts below shows the investment results for the S&P 500 Index for different lengths of time.
Historically, the longer an investor has held stocks, the greater the potential for an overall positive return.
One-Year Holding Periods (Jan. 1, 1937–Dec. 31, 2025)
Stocks were up 76% of the time—68 up periods, 21 down
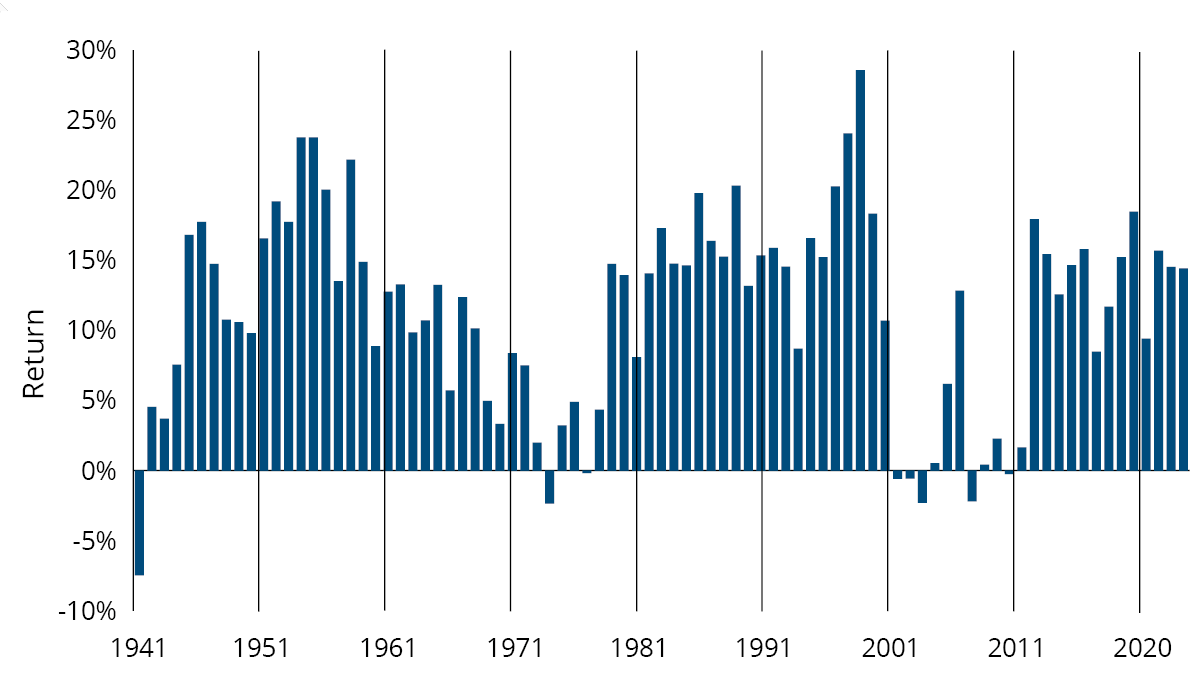
Five-Year Holding Periods (Jan. 1, 1937-Dec. 31, 2025)
Stocks were up 91% of the time—77 up periods, 8 down
Ten-Year Holding Periods (Jan. 1, 1937-Dec. 31, 2025)
Stocks were up 98% of the time—78 up periods, 2 down
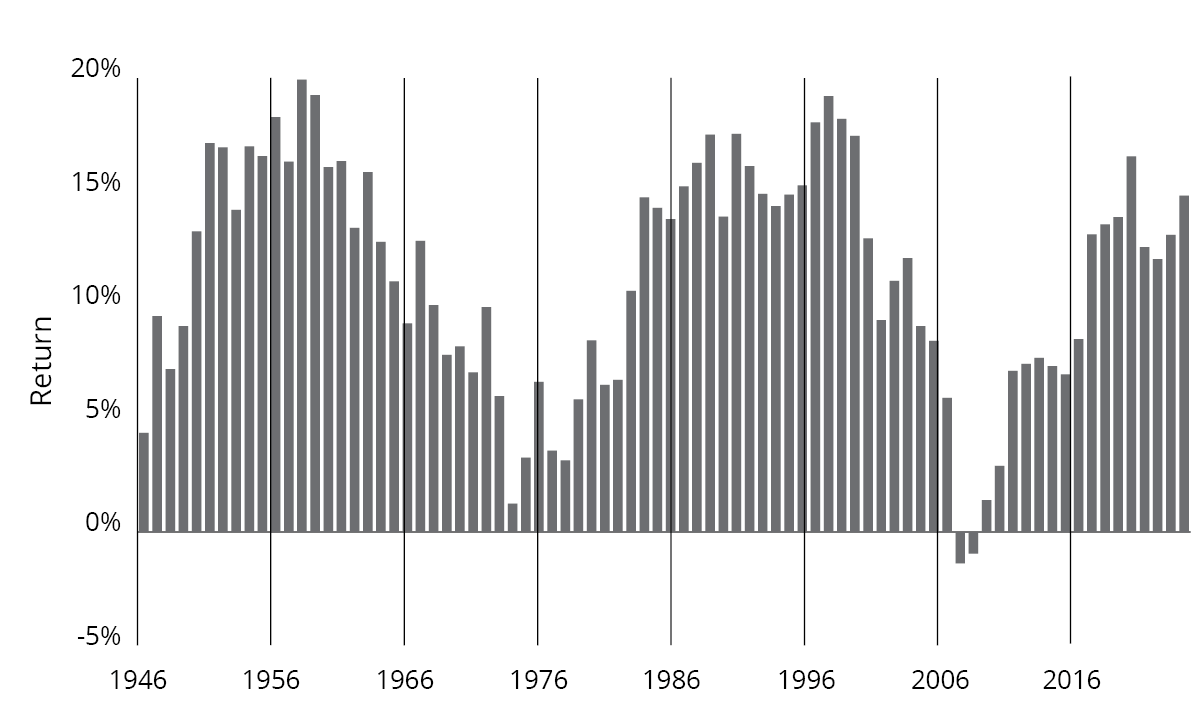
Past performance does not guarantee future results. Equities are represented by the S&P 500 Index. Data Sources: Morningstar and Hartford Funds, 2/26.
Although volatility is an inevitable part of investing, a financial professional
can help you stay focused on your long-term goals.
Past performance does not guarantee future results. Indices are unmanaged and not available for direct investment. Dow Jones Industrial Average is an unmanaged, price-weighted index of 30 of the largest, most widely held stocks traded on the NYSE. Cboe Volatility Index (VIX) is a key measure of market expectations of near-term volatility conveyed by S&P 500 Index option prices. S&P 500 Index is a market capitalization-weighted price index composed of 500 widely held common stocks.
1 Data Sources: FactSet and Hartford Funds, 2/26.
2 Data Sources: Morningstar and Hartford Funds, 2/26.
3 Data Sources: Ned Davis Research and Hartford Funds, 2/26.
Investing involves risk, including the possible loss of principal.
This material is provided for educational purposes only.