
Pre-Sales Support
Mutual Funds and ETFs - 800-456-7526
Monday-Thursday: 8:00 a.m. – 6:00 p.m. ET
Friday: 8:00 a.m. – 5:00 p.m. ET
Post-Sales and Website Support
888-843-7824
Monday-Friday: 9:00 a.m. - 6:00 p.m. ET
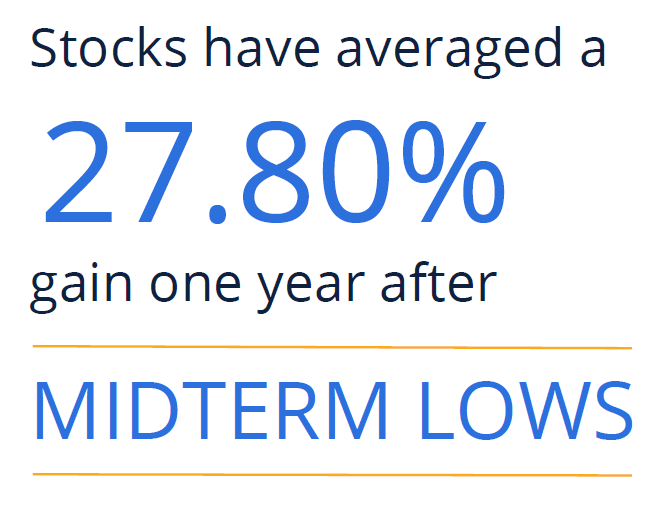
Volatility has been a defining feature of midterm years, with significant drawdowns that tend to emerge as the year progresses. Over the past 10 midterm election cycles, stocks have experienced average drawdowns of 16.77%, but one-year gains following those lows have averaged 27.80%.
| Year | Max Drawdown (%) |
Drawdown Low Date |
Returns (%) 1 Year Later |
|---|---|---|---|
| 1986 | -9.42 | 9/29/86 | 39.92 |
| 1990 | -19.92 | 10/11/90 | 29.10 |
| 1994 | -8.94 | 4/4/94 | 15.11 |
| 1998 | -19.34 | 8/31/98 | 37.93 |
| 2002 | -33.75 | 10/9/02 | 33.73 |
| 2006 | -7.70 | 6/13/06 | 23.86 |
| 2010 | -15.99 | 7/2/10 | 31.01 |
| 2014 | -7.40 | 10/15/14 | 8.66 |
| 2018 | -19.78 | 12/24/18 | 37.10 |
| 2022 | -25.43 | 10/12/22 | 21.60 |
| Average | -16.77 | September 2 | 27.80 |
Chart Data: 1986-2022. Past performance does not guarantee future results. Indices are unmanaged and not available for direct investment. S&P 500 Price Index is a market capitalization-weighted price index composed of 500 widely held common stocks and does not include the reinvestment of dividend payments. For illustrative purposes only. Data Sources: Morningstar, 6/26.
A financial professional can help you build a portfolio that’s right for you despite political uncertainty.
Important Risks: Investing involves risk, including the possible loss of principal.


