
Pre-Sales Support
Mutual Funds and ETFs - 800-456-7526
Monday-Thursday: 8:00 a.m. – 6:00 p.m. ET
Friday: 8:00 a.m. – 5:00 p.m. ET
Post-Sales and Website Support
888-843-7824
Monday-Friday: 9:00 a.m. - 6:00 p.m. ET
| Start Date | End Date | # of Days | S&P 500 Index Price Return (%) |
|---|---|---|---|
| 10/1/1976 | 10/11/1976 | 10 | -3.42 |
| 10/1/1977 | 10/13/1977 | 12 | -3.18 |
| 11/1/1977 | 11/9/1977 | 8 | 0.69 |
| 12/1/1977 | 12/9/1977 | 8 | -1.24 |
| 10/1/1978 | 10/18/1978 | 17 | -2.00 |
| 10/1/1979 | 10/12/1979 | 11 | -4.42 |
| 11/14/1995 | 11/19/1995 | 5 | 1.31 |
| 12/16/1995 | 1/6/1996 | 21 | 0.06 |
| 10/1/2013 | 10/17/2013 | 16 | 3.07 |
| 12/22/2018 | 1/25/2019 | 34 | 10.27 |
| 10/1/2025 | 11/12/2025 | 43 | 2.43 |
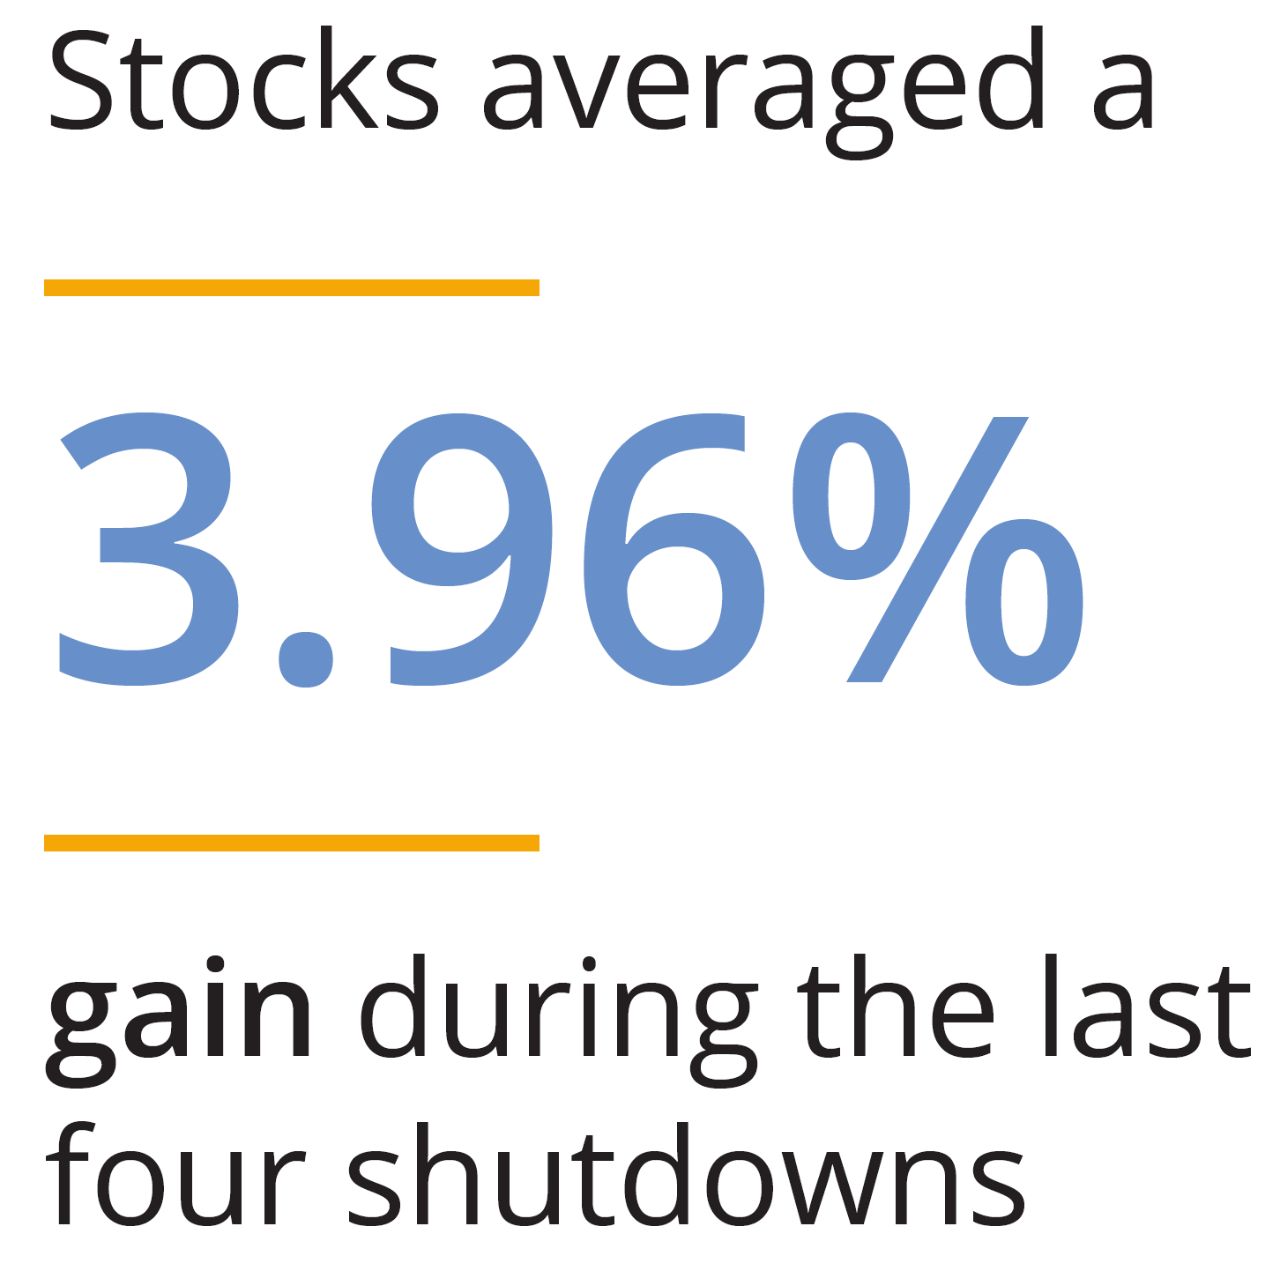
Past performance does not guarantee future results. Indices are unmanaged and not available for direct investment. Data shown is for the S&P 500 Price Index and includes government shutdowns that lasted at least five days since the first shutdown in 1976. Data Sources: Morningstar and History, Art & Archives, US House of Representatives, 1/26.
Talk to your financial professional to learn more about staying confident in the face of political uncertainty.
S&P 500 Price Index is a market capitalization-weighted price index composed of 500 widely held common stocks and does not include the reinvestment of dividend payments.
Investing involves risk, including the possible loss of principal.


