Pre-Sales Support
Mutual Funds and ETFs - 800-456-7526
Monday-Thursday: 8:00 a.m. – 6:00 p.m. ET
Friday: 8:00 a.m. – 5:00 p.m. ET
Post-Sales and Website Support
888-843-7824
Monday-Friday: 9:00 a.m. - 6:00 p.m. ET
FIGURE 1
Stock Recoveries Since the Global Financial Crisis Have Been Much Shorter
S&P 500 Index Drawdowns vs. Time to Recover
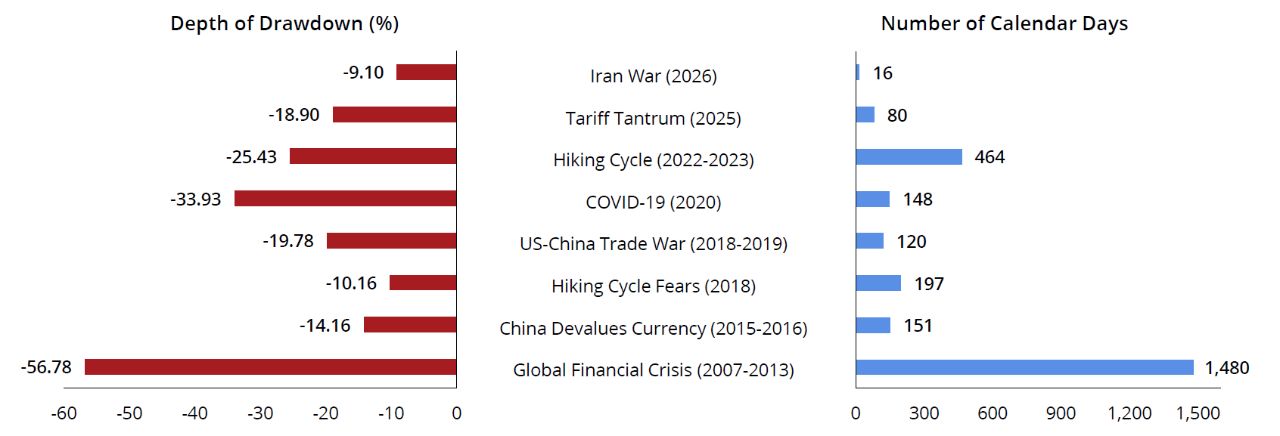
As of 9/30/26. Past performance does not guarantee future results. Indices are unmanaged and not available for direct investment. Note: The Iran War was a near-correction (below the 10% threshold) but is included for recency. Sources: Ned Davis and Morningstar, 9/26.
Observations:
The Takeaway
Many recent downturns haven’t been caused by deeper problems in the economy or financial system, so once investors gain more information or a conflict is resolved, confidence has returned quickly. It’s a good reminder that staying invested despite volatility can help you participate fully in market rebounds.
Talk to your financial professional about building a portfolio that helps you stay invested through market volatility.
1 Pre-GFC average recovery time is based on corrections from 1970 to 2006. Post-GFC recovery time based on corrections from 2013 to 2026.
S&P 500 Index is a market capitalization-weighted price index composed of 500 widely held common stocks.
Important Risks: Investing involves risk, including the possible loss of principal.
This material and/or its contents are current at the time of writing and are subject to change without notice.