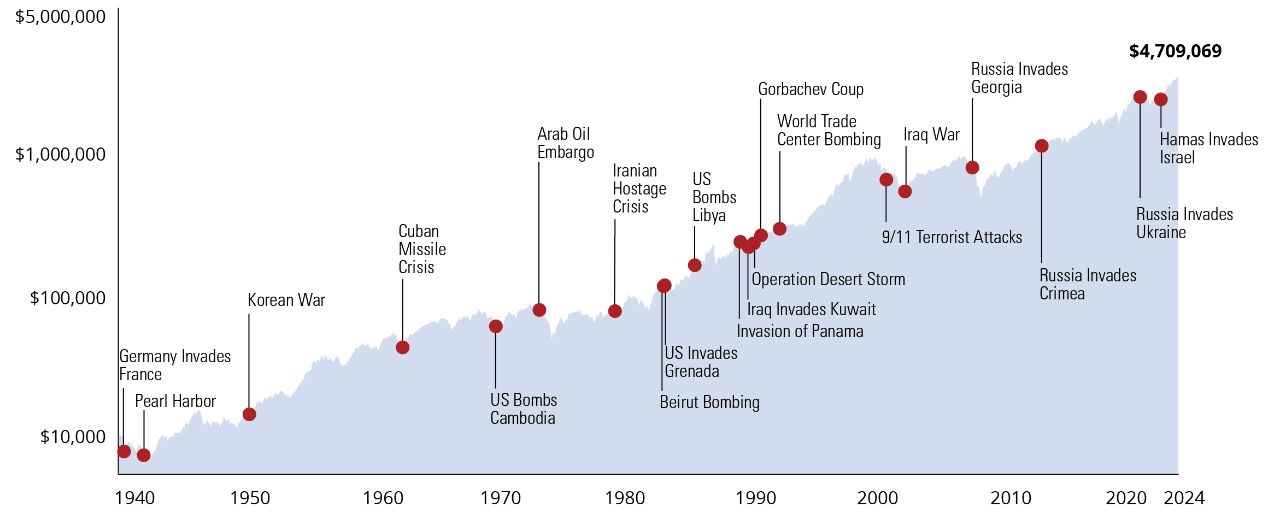
Geopolitical uncertainty can cause short-term market volatility, but the stock market has been resilient. In fact, stocks generated positive performance one year after an act of aggression for 73% of the armed conflicts since World War II. The longer the investment time frame, the more likely a positive return.
| Geopolitical/Military Events | S&P 500 Index Price Return (%) | ||||
|---|---|---|---|---|---|
| Event (Start Date) | 3 Months Later | Annualized | |||
| 1 Year Later | 3 Years Later | 5 Years Later | 10 Years Later | ||
| Germany Invades France (May 1940) | -15.3 | -22.0 | -0.9 | 4.1 | 4.2 |
| Pearl Harbor Attack (December 1941) | -12.4 | 0.4 | 11.7 | 9.5 | 9.6 |
| Korean War (June 1950) | 1.5 | 11.2 | 8.1 | 16.4 | 11.7 |
| Cuban Missile Crisis (October 1962) | 17.4 | 32.0 | 18.3 | 11.4 | 7.0 |
| US Bombs Cambodia (April 1970) | -4.6 | 27.1 | 9.4 | 0.9 | 2.6 |
| Arab Oil Embargo (October 1973) | -13.2 | -36.2 | -2.9 | -1.4 | 4.4 |
| Iranian Hostage Crisis (November 1979) | 11.6 | 25.9 | 11.4 | 10.3 | 12.7 |
| USSR Invades Afghanistan (December 1979) | -8.8 | 26.2 | 9.1 | 9.0 | 12.4 |
| Beirut Bombing (October 1983) | -0.7 | 0.7 | 13.0 | 11.3 | 10.8 |
| US Invades Grenada (November 1983) | -1.1 | 0.7 | 12.8 | 11.2 | 10.8 |
| US Bombs Libya (April 1986) | -0.5 | 19.9 | 8.3 | 9.9 | 10.5 |
| Invasion of Panama (December 1989) | -2.9 | -6.9 | 7.5 | 5.6 | 15.0 |
| Iraq Invades Kuwait (August 1990) | -10.5 | 10.2 | 8.6 | 9.7 | 15.1 |
| Operation Desert Storm (January 1991) | 21.5 | 32.3 | 14.5 | 14.0 | 15.4 |
| Gorbachev Coup (August 1991) | -1.8 | 9.3 | 6.3 | 11.5 | 11.9 |
| World Trade right Bombing (February 1993) | 1.5 | 5.4 | 13.7 | 18.7 | 6.5 |
| 9/11 Terrorist Attacks (September 2001) | 2.5 | -16.7 | 0.9 | 3.5 | 0.6 |
| Iraq War (March 2003) | 15.6 | 27.0 | 14.3 | 8.2 | 5.9 |
| Russia Invades Georgia (August 2008) | -34.3 | -22.3 | -4.7 | 5.5 | 8.1 |
| Russia Invades Crimea (March 2014) | 3.9 | 10.7 | 8.0 | 7.9 | 10.6 |
| Russia Invades Ukraine (February 2022) | -13.0 | -11.0 | 9.5 | ||
| Hamas Attacks Israel (October 2023) | 9.7 | 33.6 | |||
| Israel Attacks Iran’s Nuclear Facilities (June 2025) | ??? | ||||
| Median | -0.9 | 9.7 | 9.1 | 9.6 | 10.5 |
| % Positive | 41% | 73% | 90% | 95% | 100% |
Past performance does not guarantee future results. Indices are unmanaged and not available for direct investment. Data shown is for the S&P 500 Price Index, a market capitalization-weighted price index composed of 500 widely held common stocks, and does not include the reinvestment of dividend payments. Data Sources: Morningstar, Ned Davis Research, and Hartford Funds, 6/25.
Geopolitical Conflicts Have Had Minimal Impact on Long-Term Equity Performance
Growth of $10,000 in the S&P 500 Price Index (1940–2024)

Past performance does not guarantee future results. Indices are unmanaged and not available for direct investment. Data shown does not include the reinvestment of dividend payments. Data Sources: Morningstar, Ned Davis Research, and Hartford Funds, 3/25.
Your financial professional can help you put geopolitical events in perspective.
Important Risks: Investing involves risk, including the possible loss of principal.


