Pre-Sales Support
Mutual Funds and ETFs - 800-456-7526
Monday-Thursday: 8:00 a.m. – 6:00 p.m. ET
Friday: 8:00 a.m. – 5:00 p.m. ET
Post-Sales and Website Support
888-843-7824
Monday-Friday: 9:00 a.m. - 6:00 p.m. ET
In 1991, researchers at the University of Illinois tested 20 pilots in a flight simulator. These pilots all flew according to visual flight rules, meaning they flew only when conditions were clear enough to see the ground and other aircraft. They didn’t know how to use flight instruments. When the researchers created poor visual conditions, all 20 pilots crashed—in an average of 178 seconds. Next, the pilots were given two hours of flight-instrument training. After the training, all the pilots were able to fly successfully.
Likewise, as an investor you want to navigate periods of volatility successfully. But without historical perspective, when the stock market takes a dive, you may be tempted to make decisions that could hurt your long-term investment results. But volatility is not only expected, it can also be an investment-growth opportunity.
Perseverance Matters
When the stock market doesn’t provide positive returns in a particular year, investors often feel uneasy, overlooking the fact that the positive returns only come as an average return over time—not every year.
Naturally, investors desire more consistency than the chart in Figure 1 demonstrates (see next page). Given that the S&P 500 Index1 had an average annual return of 11.78% from 1985 through year-end 2024, many investors may expect a similar return in an individual year. Yet, the Index returned between 9% and 12% annually only three times during that time period. Usually, it was above or below the average annual return of 11.78%, sometimes significantly.
Figure 1: In the Short Term, the Stock Market Appears Really Volatile
S&P 500 Index Quarterly Returns % (1985–2024)2
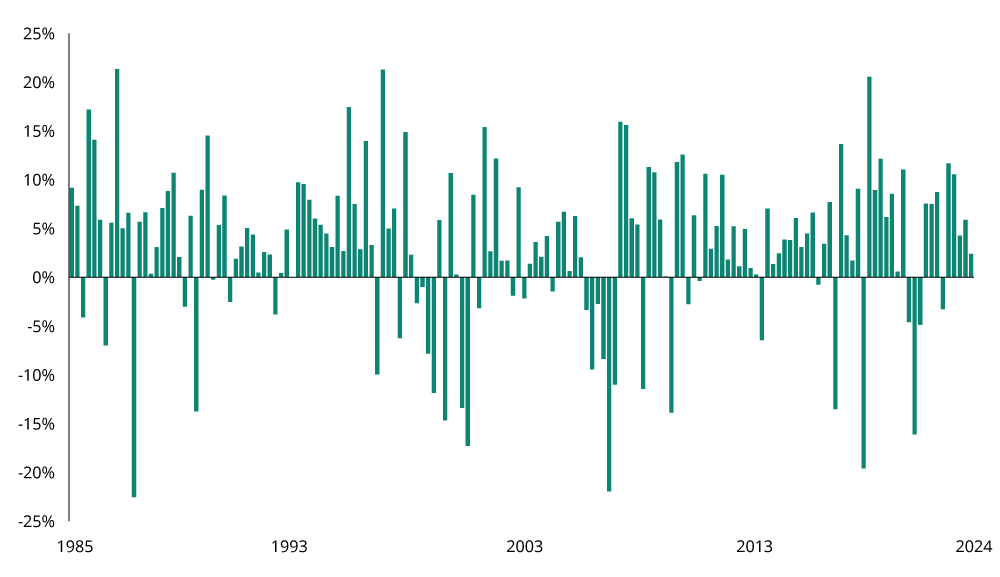
Past performance does not guarantee future results. For illustrative purposes only. Indices are unmanaged and not available for direct investment.
Perspective Can Change Investors’ Perception
Some investors view volatility as entirely bad, making it difficult to accept that volatility can represent the potential for gain as much as the potential for loss. More importantly, some investors forget that volatility, whether it lasts a day, a week, or a year, has historically been short-term.
Figure 2 shows the results of that volatility with a $10,000 investment in the same index as Figure 1, over the same time period. Instead of focusing on the stock market’s ups and downs, investors can see the overall effect of the 11.78% average annual return.
Figure 2: The Same Investment Viewed from a Long-Term Perspective
Long-Term Growth: Growth of $10,000 Invested in S&P 500 Index (1985-2024)2
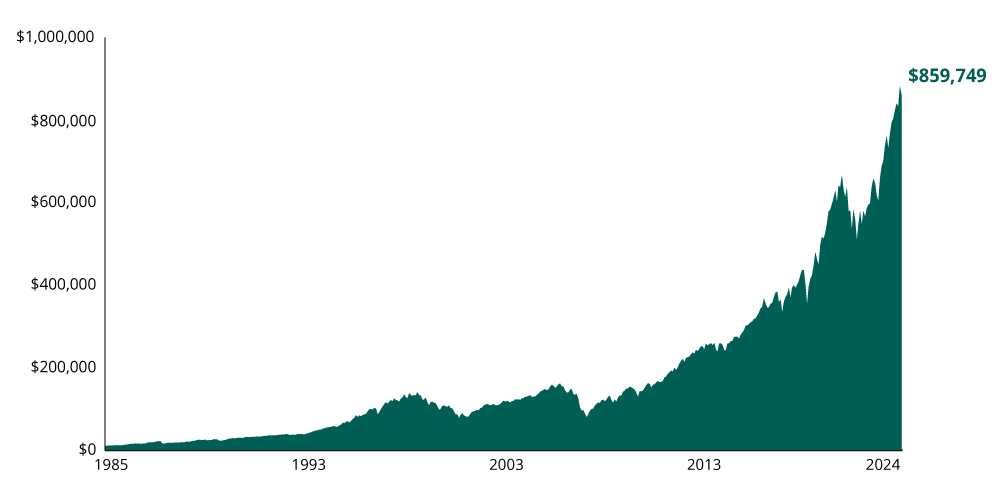
Past performance does not guarantee future results. For illustrative purposes only. Indices are unmanaged and not available for direct investment.
Two Very Different Reactions to Volatility That Led to an $1,175,452 Difference in Returns
In Figure 3, two investors began with $10,000 in the S&P 500 Index on 12/31/84. From there, each took a very different investment approach.
Every time the stock market dropped 8% or more in a month the apprehensive investor (shown in blue in Figure 3) panicked and transferred $2,000 to T-Bills, which are often viewed as safe, conservative investments. The opportunistic investor (shown in green in Figure 3), on the other hand, did the opposite by investing an additional $2,000 in the Index.
Figure 3: Volatility Can Provide Significant Opportunity
Two Hypothetical Approaches to Volatility: Growth of $10,000 Invested in S&P 500 Index (1985–2024)2
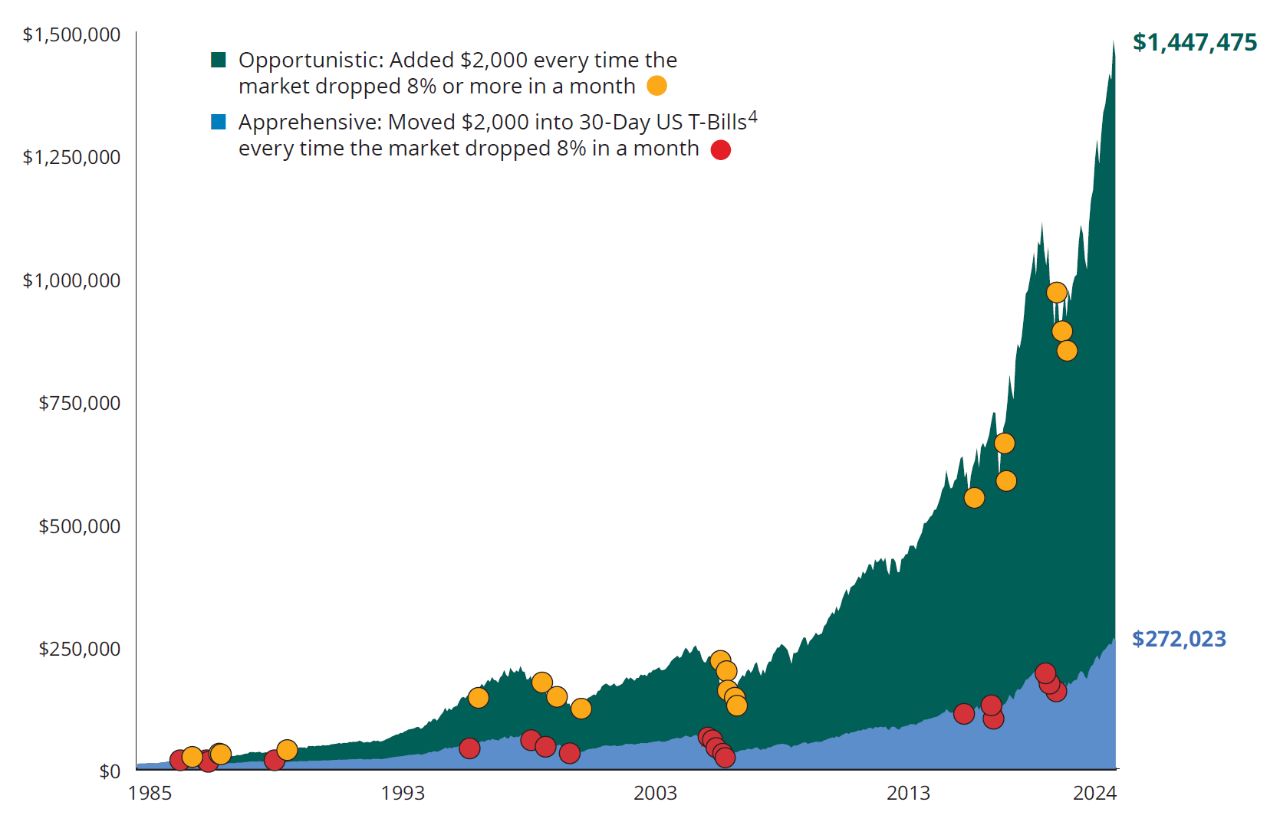
Past performance does not guarantee future results. For illustrative purposes only. Indices are unmanaged and not available for direct investment.
The Big Surprise
The apprehensive investor was able to avoid some of volatility’s short-term effects. But after several moves, the apprehensive investor’s assets were completely invested in cash, causing them to miss the significant growth experienced by the opportunistic investor.
The opportunistic investor chose to not only tolerate but take advantage of volatility. Ultimately, the opportunistic investor enjoyed a considerably higher investment value—more than double the apprehensive investor’s.
Investors should consider their financial ability to regularly make sizable investments during a prolonged market downturn. Assumes no taxes or transaction costs.
Despite the Growth Potential of Equities, Market Drops Can Still Be Uncomfortable
Keep in mind that there have been seven bear markets from 1985–2024.3 The seventh and most recent bear market began in January 2022. Five of them were less than a year long and the average decline was 35%.3 Historically, the probability of a bear market occurring is only about one in every five years. But what’s more important than what happens during these bear markets is what happens after they occur. For example, on 12/31/1984, the S&P 500 Index was at 167. On 12/31/2024, the S&P 500 closed at 5,8812—more than 34 times higher than it was at the end of 1984.
When the Market Gets Rough, Remember These Three Things
First, it’s natural to want consistent returns. But in the short term, the stock market can often be quite volatile. Second, looking at short-term volatility from a long-term perspective can change its significance completely. Third, viewing volatility as an opportunity instead of purely a threat can lead to far different results.
Don’t Fly Without Instruments
When market corrections or bear markets occur, getting out of the market is tempting. Like the pilots flying in the simulator, not seeing things clearly can lead to poor outcomes. Even though market drops are uncomfortable, there’s value in sticking with a sound investment plan for the long term.
Your financial professional can help you maintain perspective and avoid emotion-based decisions.
Financial Professionals: This article is based on our popular Beyond Investment Illusions seminar. Click here to access additional content to share.
1 The S&P 500 Index is a market capitalization-weighted price index composed of 500 widely held common stocks.
2 Morningstar and Hartford Funds, 2/25
3 Ned Davis and Hartford Funds, 2/25
4 Investing involves risk, including the possible loss of principal. T-Bills are guaranteed as to the timely payment of principal and interest by the U.S. Government and generally have lower risk-and-return than equities. Equity investments (stocks) are subject to market volatility and have greater risk than T-Bills and other cash investments.
This content is for informational use and should not be considered a recommendation or investment advice.