• Products
  • Insights
  • Practice Management
  • Resources
  • About Us

It hasn’t just been stocks rattling nerves lately— the bond market has had its own wild ride. From tariff tensions and stagflation fears to ballooning federal deficits and an unexpected US credit downgrade, fixed-income investors have faced a barrage of unsettling headlines. 

But here’s the thing: Volatility isn’t a reason to abandon fixed income—it’s a reminder of why it may belong in your portfolio. Bonds may still offer what they historically have offered: attractive valuations, smaller drawdowns compared to equities, and fewer dramatic ups and downs during times of market turbulence.

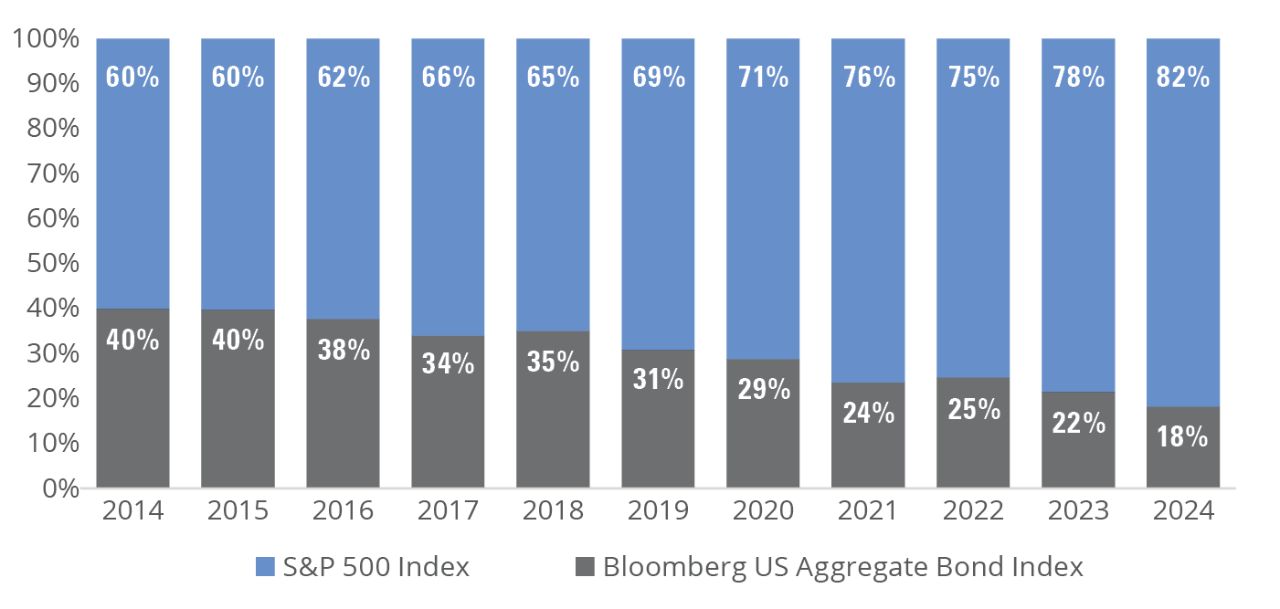
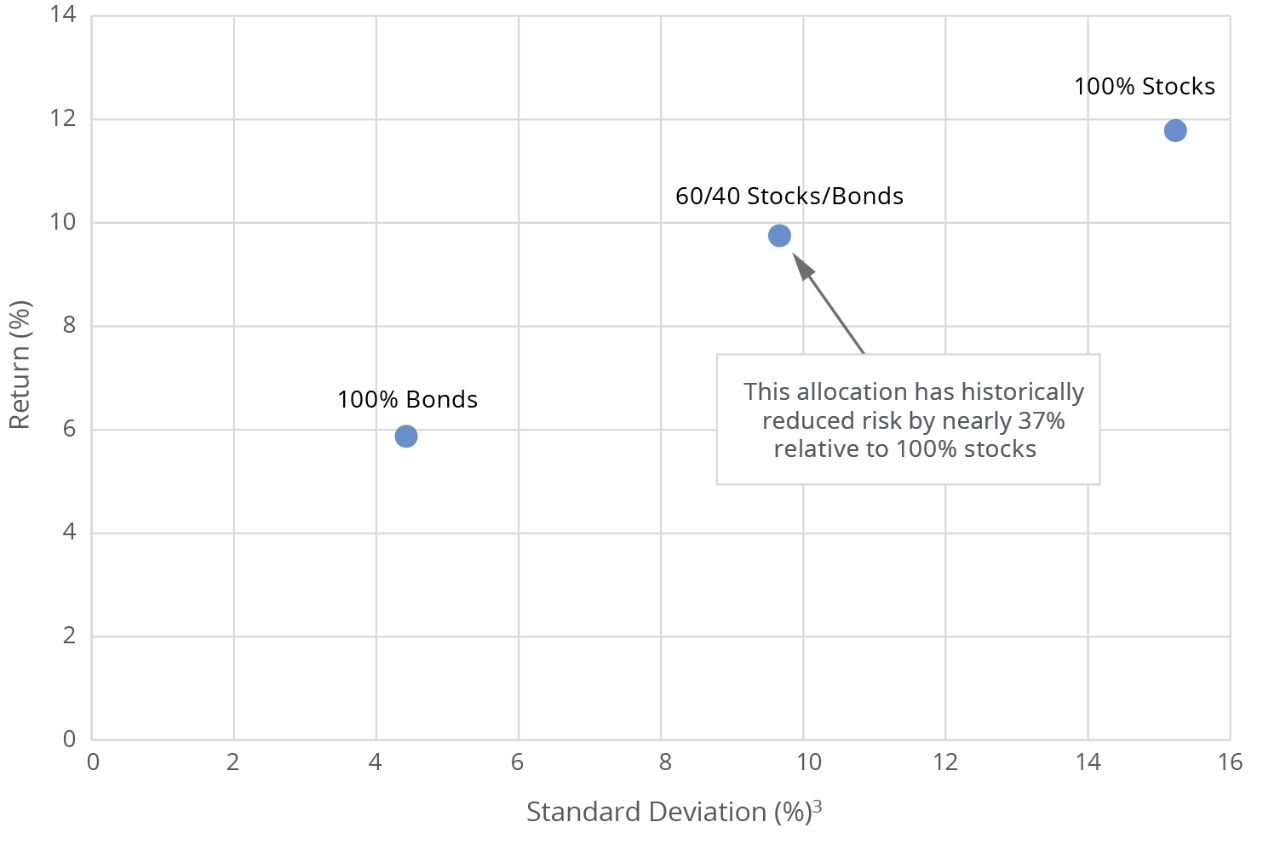
However, bonds’ positive effects can be diluted if a portfolio becomes unbalanced. FIGURE 1 shows that a failure to regularly rebalance a portfolio can also introduce excessive portfolio risk, which can render a carefully constructed allocation vulnerable to economic and geopolitical headwinds. The current period of uncertainty may be a timely opportunity to consider a strategic tilt from equities to fixed income.

FIGURE 1

How a 60/40 Portfolio Becomes an 82/18 Portfolio Over Time
Allocation Changes in a 60/40 Portfolio That Never Gets Rebalanced

Allocation Changes in a 60/40 Portfolio That Never Gets Rebalanced

Chart Data: 2014-2024. See below for index definitions. Data Sources: Morningstar and Hartford Funds, 5/25.

Here are a few more key reasons why a focus on bond allocations may make sense.


1. Attractive Valuations Relative to Equities

In addition to their diversification benefits, bonds have the added bonus of being attractively valued relative to stocks. This year—for the first time in over two decades—the 10-year US Treasury yield surpassed the earnings yield (inverse of the P/E1 multiple) of the S&P 500 Index, potentially making bonds a more compelling option (FIGURE 2).

Allocating to bonds now may also present an opportunity to acquire fixed income at a discount, providing the potential for attractive total returns: income plus price appreciation. Currently, the average price of a bond is sitting near its lowest point since the 1980s (FIGURE 3). As with any investment, its value at its entry point can make a difference.


FIGURE 2

The Yield on Fixed Income Has Surpassed Stocks’ Earnings Yield 
S&P 500 Index Earnings Yield vs. the 10-Year Treasury Yield (%)

S&P 500 Index Earnings Yield vs. the 10-Year Treasury Yield (%)

Chart Data: 12/31/94-3/31/25. Past performance does not guarantee future results. Data Sources: FactSet and Hartford Funds, 5/25. 

FIGURE 3

Largest Bond Discount in Decades
Average Bond Price of the Bloomberg US Aggregate Bond Index

Average Bond Price of the Bloomberg US Aggregate Bond Index

Chart Data: 1/30/76-3/31/25. Past performance does not guarantee future results. Investors cannot directly invest in indices. A bond is trading at a premium when the current price is higher than its face value. A bond is trading at a discount when the current price is less than its face value. Data Source: Bloomberg, 5/25.

Allocating to bonds can soften the blows from stock-market drawdowns, helping investors stay on track to meet their long-term goals.


2. Lower Drawdowns Relative to Equities

Since 1985, stocks have averaged an intra-year drawdown of -14.0%, with some years experiencing declines in excess of 30.0%. Bonds, however, had an average drawdown of -2.3% over the same time period (FIGURE 4). Allocating to bonds can soften the blows from stock-market drawdowns, helping investors stay on track to meet their long-term goals.


FIGURE 4

Bonds Have Endured Much Lower Average Drawdowns Than Stocks
Stock and Bond Drawdowns

Stock and Bond Drawdowns

Chart Data: 1985-3/31/25. Past performance does not guarantee future results. Investors cannot directly invest in indices. Drawdowns refer to the largest drop from peak to trough in performance during the calendar year. Bonds are represented by the Bloomberg US Aggregate Bond Index. Stocks are represented by the S&P 500 Index. Data Sources: Morningstar and Hartford Funds, 4/25.


By combining asset classes, investors can potentially optimize the balance between risk and reward.


3. Historically Lower Standard Deviation Relative to Equities

Volatility is a common concern for equity investors. Daily losses of 1-2% are frequent, and while some risk is unavoidable, adding bonds can reduce this volatility without sacrificing returns. By combining asset classes, investors can potentially optimize the balance between risk and reward.

Over the past 40 years, bonds have exhibited only a quarter of the volatility of stocks. Adding 40% bonds to an all-stock portfolio during this period would have reduced risk by nearly 37% without sacrificing returns (FIGURE 5). Ultimately, incorporating bonds can produce a portfolio with fewer dramatic ups and downs.


FIGURE 5

Balancing Stocks and Bonds: The Potential to Dampen Portfolio Risk
Stock-Bond Efficient Frontier2 Since 1985

Stock-Bond Efficient Frontier Since 1985

Chart Data: 1/30/76-3/31/25. Past performance does not guarantee future results. Investors cannot directly invest in indices. Source: Hartford Funds, 5/25.


Bottom Line

Volatility is a part of investing, but by incorporating bonds into a portfolio, investors can potentially reduce volatility relative to an all-equity portfolio without sacrificing return. Bonds can complement stocks in a diversified portfolio, potentially helping reduce overall portfolio risk. A less-volatile portfolio can reduce the likelihood of untimely selling and may help you achieve your long-term goals. Your financial professional can help you determine the appropriate bond allocation to meet those goals.


To learn more about strategies for volatile markets, please talk to your financial professional.


Bloomberg US Aggregate Bond Index is composed of securities that cover the US investment-grade fixed-rate bond market, with index components for government and corporate securities, mortgage pass-through securities, and asset-backed securities.

S&P 500 Index is a market capitalization-weighted price index composed of 500 widely held common stocks.

1 The price-to-earnings (P/E) ratio measures a company’s share price relative to its earnings-per-share and helps assess the relative value of a company’s stock.

2 The efficient frontier is a concept in modern portfolio theory (MPT) that represents a set of optimal portfolios offering the highest expected return for a given level of risk, or the lowest risk for a given level of expected return.

3 Standard deviation measures the portfolio’s total-return volatility. A higher standard deviation indicates greater historical volatility.

Important Risks: Investing involves risk, including the possible loss of principal. • Fixed income security risks include credit, liquidity, call, duration, and interest-rate risk. As interest rates rise, bond prices generally fall. • Diversification does not ensure a profit or protect against a loss in declining market. 

This information should not be considered investment advice or a recommendation to buy/sell any security. In addition, it does not take into account the specific investment objectives, tax and financial condition of any specific person. This information has been prepared from sources believed reliable, but the accuracy and completeness of the information cannot be guaranteed. This material and/or its contents are current at the time of writing and are subject to change without notice. 


WP836 4526600