• Products
  • Insights
  • Practice Management
  • Resources
  • About Us

In an increasingly uncertain market environment, many investors want investment options that seek to offer income to help mitigate price volatility along with growth potential. The Hartford Balanced Income Fund stands out as a notable option for those looking to potentially generate income and grow capital, with a historical track record of reducing drawdown risk. While the Fund maintains a conservative allocation—approximately 55% fixed income and 45% equities plus or minus 5%—it has consistently delivered top-quartile returns compared to its peers over various time horizons.

Although growth stocks have significantly outperformed in recent years,1 we believe market participants are beginning to rediscover the advantages of income-oriented strategies. Below we highlight the key features and benefits of the Hartford Balanced Income Fund in a diversified portfolio.


A Value-Oriented Dividend-Income Strategy

By focusing its equity investments on large-cap US companies with sustainable and growing dividends, the Fund seeks to capture less downside during economic downturns while participating meaningfully in equity-market recoveries (FIGURE 1). While value stocks have underperformed growth stocks in recent years, they may now be regaining favor.2


FIGURE 1

A Fund for Whatever Comes Next
Average Returns by Market Environment: Fund vs. S&P 500 Index vs. Morningstar Category

Average Returns by Market Environment: Fund vs. S&P 500 Index vs. Morningstar Category

Chart Data: 2007-2024. Past performance does not guarantee future results. Indices are unmanaged and not available for direct investment. Please see below for index definitions. Down Markets: S&P 500 Index has a negative return in a calendar year. Flat Markets: S&P 500 Index returns between 0% and 4% in a calendar year. Up Markets: S&P 500 Index has a greater than 4% return in a calendar year. Data Sources: Morningstar and Hartford Funds, 1/25.

Yields are currently among the highest we've seen in the post-global financial crisis era.


At the core of the Fund’s equity strategy is a value-oriented, dividend-income approach that targets undervalued companies with low price-to-earnings (P/E) ratios. The Fund seeks quality companies that are attractively priced due to near-term challenges or underappreciated secular trends. These companies often have a history of above-average dividends or strong expectations for dividend growth with the potential to provide a sustainable income stream for investors. The investment team believes markets often underestimate the long-term impact of dividends on shareholder returns, which have historically been significant (FIGURE 2).


FIGURE 2

Dividends Have Contributed Significantly to Total Return
Growth of $1,000 in Russell 1000 Value Index: With and Without Dividends

Growth of $1,000 in Russell 1000 Value Index: With and Without Dividends

Chart Data: 12/31/78-3/31/25. Past performance does not guarantee future results. Indices are unmanaged and not available for direct investment. Please see below for index definitions. Data Sources: Bloomberg and Hartford Funds, 4/25.


This stems from investors’ tendency to focus excessively on the short term and anchor future expectations to recent results. This often leads to overreactions to short-term events and a lack of attention to long-term structural changes.


Fixed-Income Component Helps Add Stability

The fixed-income portion of the Fund plays a critical role in potentially reducing volatility. The Fund primarily invests in investment-grade credit, while also incorporating exposure to emerging-markets debt and high-yield bonds to help enhance income and diversify return sources.

The fixed-income strategy is fundamentally driven, characterized by low turnover, and emphasizes investments in the bond market rather than relying heavily on derivative instruments. Moreover, we believe the current market environment presents an attractive entry point for fixed-income investors, with yields currently  among the highest seen in the post-Global Financial Crisis era (FIGURE 3).


FIGURE 3

Yields Are Near Their Highest Levels in Years
Fixed-Income Yield to Worst (%)

Fixed-Income Yield to Worst (%)

Chart Data: 3/31/05-3/31/25. Past performance does not guarantee future results. Indices are unmanaged and not available for direct investment. Yield to worst is the minimum yield that can be received on a bond assuming the issuer doesn’t default on any of its payments. Emerging-markets debt is represented by JPMorgan Emerging Markets Bond Index Plus. US high-yield corporate is represented by Bloomberg US High Yield 2% Issuer Cap Index. US high-yield corporate is represented by the Bloomberg US Corporate Index. Please see the last page for index definitions. Data Sources: Bloomberg, JP Morgan, and Hartford Funds.


In addition to potentially earning attractive yields, investors have the potential to benefit from excess returns (i.e., returns that exceed the returns of the Fund’s benchmark over a specific time period) through sector rotation and security selection—two foundational pillars of active fixed-income management. We believe inefficiencies persist in the corporate bond market due to its segmented buyer base and the inconsistent treatment of issuers by rating agencies. We strive to capitalize on these inefficiencies through rigorous, bottom-up, independent fundamental analysis.


The Fund seeks to deliver consistent returns across a variety of market conditions.


Expert Insights Across the Capital Structure and Risk Management

The Fund draws on the deep expertise of dedicated career credit research analysts who collaborate closely with their equity counterparts. This cross-disciplinary approach enables a holistic assessment of risk and value, which may lead to more informed decisions and higher-conviction investment theses.

We believe the Fund’s disciplined investment process and thoughtful risk-management framework are key to mitigating downside surprises. As a testament to our philosophy and investment process, we highlight the Fund’s consistent top-quartile—and in many periods, top-decile—performance relative to its Morningstar peer group (FIGURE 4).


FIGURE 4

Strong Performance and Percentile Rankings (as of 3/31/25)

 
  YTD 1-year 3-year 5-year 10-year
Fund (Class I) 3.01 7.30 3.81 7.75 5.99
Category 0.73 5.15 3.01 6.66 4.36
Index 2.18 6.34 4.06 8.35 5.58
Percentile Rank   8 24 16 4
# Funds in Category   438 426 390 289

Past performance does not guarantee future results. Indices are unmanaged and not available for direct investment. The Blended Index consists of 45% Russell 1000 Value Index, 44% Bloomberg US Corporate Index, 5.5% JP Morgan Emerging Markets Bond Index Plus, and 5.5% Bloomberg US High Yield 2% Issuer Cap Index. Please see below for standardized performance. Morningstar rankings are based on average total returns of all products in the peer group and do not take into account sales charges. Source: Morningstar, 4/25. 


Role for Clients

The Fund’s conservative and diversified approach may make it a notable choice for investors seeking a balanced mix of income and growth in today’s uncertain market environment. By focusing on high-quality companies with sustainable dividends and implementing a disciplined fixed-income strategy, the Fund seeks to deliver consistent returns across a variety of market conditions.

We think including the Fund in a portfolio can help investors achieve a thoughtful balance between stability and growth—one that provides an income stream while also offering the potential for long-term capital appreciation.


PERFORMANCE %
 
CUMULATIVE %
(as of 5/31/2025)
AVERAGE ANNUAL TOTAL RETURNS %
(as of 5/31/2025)
1 MONTH QTD YTD 1YR 3YR 5YR 10YR SI
Hartford Balanced Income I 1.26 0.00 3.01 7.37 4.75 5.71 5.90 6.69
Benchmark 1.71 0.34 2.52 7.65 5.70 6.24 5.56 ---
 
CUMULATIVE %
(as of 3/31/2025)
AVERAGE ANNUAL TOTAL RETURNS %
(as of 3/31/2025)
1 MONTH QTD YTD 1YR 3YR 5YR 10YR SI
Hartford Balanced Income I -0.64 3.01 3.01 7.30 3.81 7.75 5.99 6.76
Benchmark -1.47 2.18 2.18 6.34 4.06 8.35 5.58 ---

Performance data quoted represents past performance and does not guarantee future results. The investment return and principal value of an investment will fluctuate so that an investor's shares, when redeemed, may be worth more or less than their original cost. Current performance may be lower or higher than the performance data quoted.

SI = Since Inception. Fund Inception: 07/31/2006

Share Class Inception: 2/26/10.
Class I-share performance prior to its inception date reflects Class A-share performance (excluding sales charges) and operating expenses. SI performance is calculated from 7/31/06.

Total Operating Expenses: 0.65%


For more information on the Hartford Balanced Income Fund, please talk to your financial professional.


1 Russell 1000 Growth Index has returned 54.48% over the 3-year period ending 4/30/25 vs.24.61% for the Russell 1000 Value Index. Past performance does not guarantee future results. 

2 The Russell 1000 Value Index returned -0.98% year to date through 4/30/25 vs. -8.37% for the Russell 1000 Growth Index. Past performance does not guarantee future results. 

3 The price-to-earnings ratio measures a company’s share price relative to its earnings-per-share and helps assess the relative value of a company’s stock.

Index Definitions

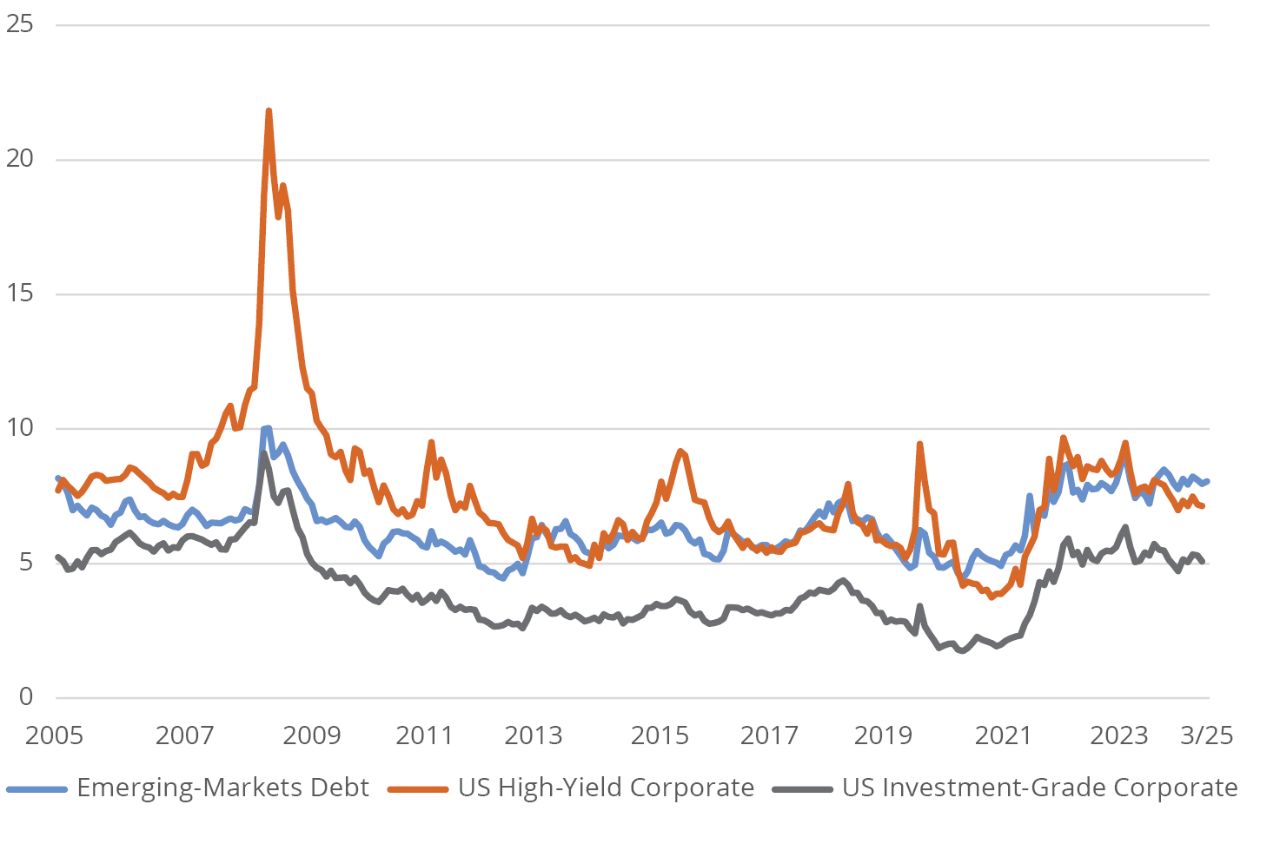
Bloomberg US High Yield 2% Issuer Cap Index is a market capitalization-weighted index that tracks the performance of US dollar-denominated, non-investment-grade, fixed-rate corporate bonds. 

Bloomberg US Corporate Index is a market-weighted index of investment-grade corporate fixed-rate debt issues with maturities of one year or more.

JPMorgan Emerging Markets Bond Index Plus is a broad-based, unmanaged index which tracks total return for external currency denominated debt (Brady bonds, loans, Eurobonds and US dollar-denominated local market instruments) in emerging markets.

Russell 1000 Growth Index is an unmanaged index which measures the performance of those Russell 1000 Index companies with higher price-to-book ratios and higher forecasted growth values.

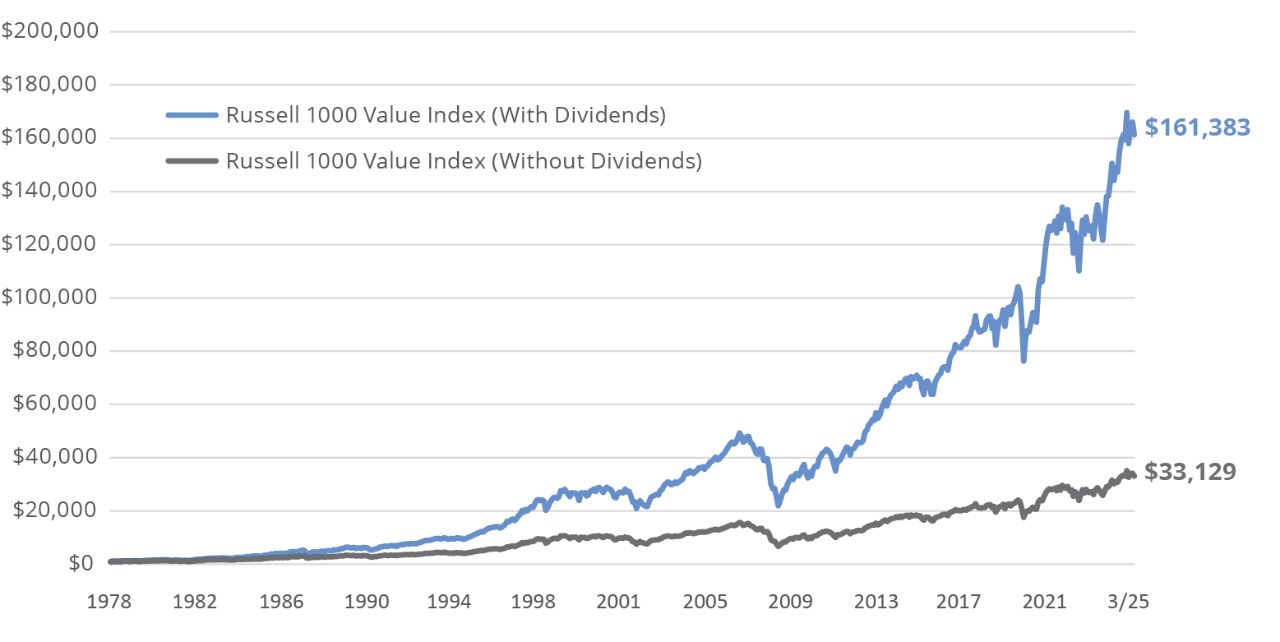
Russell 1000 Value Index is an unmanaged index measuring the performance of those Russell 1000 Index companies with lower price-to-book ratios and lower forecasted growth values. Indices are unmanaged and not available for direct investment.

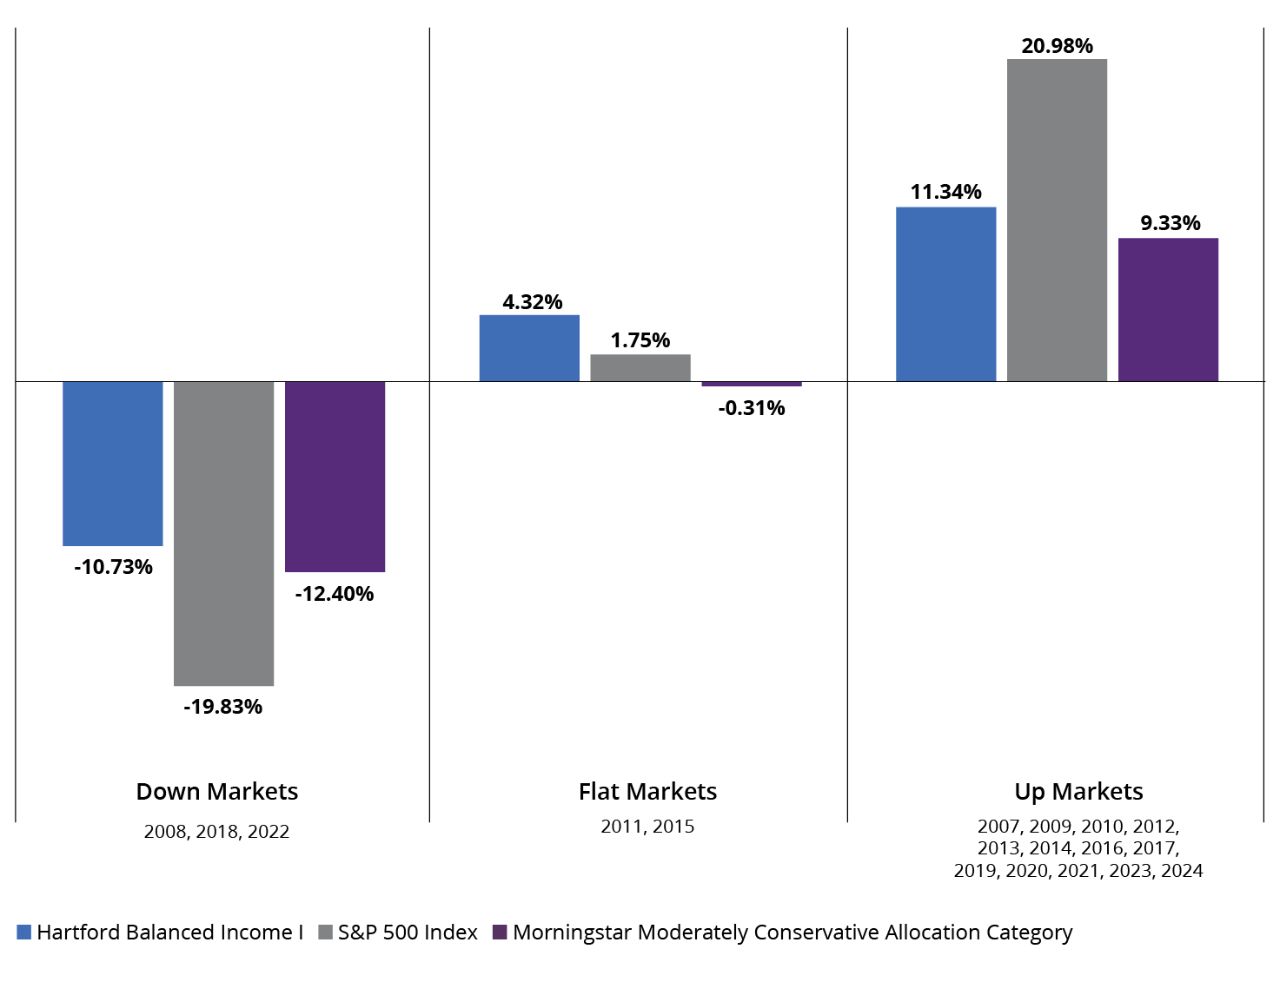
S&P 500 Index is a market capitalization-weighted price index composed of 500 widely held common stocks.

Important Risks: Investing involves risk, including the possible loss of principal. Security prices fluctuate in value depending on general market and economic conditions and the prospects of individual companies. • The portfolio managers may allocate a portion of the Fund’s assets to specialist portfolio managers, and among different asset classes, each of which may not work as intended. • Fixed income security risks include credit, liquidity, call, duration, event and interest-rate risk. As interest rates rise, bond prices generally fall. • For dividend-paying stocks, dividends are not guaranteed and may decrease without notice. • Value investing style may go in and out of favor, which may cause the Fund to underperform other funds that use different investing styles. • Foreign investments may be more volatile and less liquid than U.S. investments and are subject to the risk of currency fluctuations and adverse political, economic and regulatory developments. • Restricted securities may be more difficult to sell and price than other securities. • Derivatives are generally more volatile and sensitive to changes in market or economic conditions than other securities; their risks include currency, leverage, liquidity, index, pricing, valuation, and counterparty risk. 

Diversification does not ensure a profit or protect against a loss.


WP835 4519908
Insight from sub-adviser Wellington Management
Scott I. St. John, CFA
Fixed-Income Portfolio Manager
Matthew Hand, CFA
Equity Portfolio Manager/Analyst
Adam H. Illfelder, CFA
Equity Portfolio Manager/Analyst


.