• Products
  • Insights
  • Practice Management
  • Resources
  • About Us

Inflation rose to the highest level for several decades in 2022, rattling asset markets and investors around the world. Moderate inflation is generally good for equities because it tends to be associated with positive economic growth, rising profits, and stock price gains. However, things can quickly turn ugly for stock-market investors if the economy overheats and inflation rises too high.

Our research has found that equities outperformed inflation 90% of the time when inflation was low (below 3% on average) and rising. But when inflation was high (above 3% on average) and rising, equities fared no better than a coin toss, as shown in the chart below.

FIGURE 1

% of Rolling 12-Month Periods When US Equity Returns Exceeded Inflation Rate, 1973-2022

Past performance does not guarantee future results. Investors cannot directly invest in indices. Data from March 1973–December 2022. Based on monthly 12-month returns in excess of US CPI inflation rate. Low/high inflation defined as periods when year/year % change in US CPI is below/above average over last 12 months. Rising inflation is defined as the absolute change in the inflation rate over the last 12 months. Based on MSCI USA Index. The Consumer Price Index (CPI) is a measure of change in consumer prices as determined by the US Bureau of Labor Statistics. MSCI USA Index is a free float-adjusted market-capitalization index that is designed to measure the performance of the large- and mid-cap segments of the US market. Sources: Refinitiv Datastream and Schroders, as of 12/22.

Fortunately, not all sectors are equally affected and some may prove more resilient than others if inflation takes off.


What Is the Relationship Between Equity Prices and Inflation?

In theory, equities should offer a buffer against inflation because a rise in prices should correspond to a rise in nominal revenues and, therefore, boost share prices. On the other hand, this may be offset by a contraction in profit margins given an increase in companies’ input costs.

In practice, the impact of inflation on earnings will vary by economic sector and its ability to pass on higher input costs to consumers. But as long as input costs don’t increase at the same rate as revenues, the rise in profit margins could translate into greater nominal earnings.

The problem is that the market will often discount those future cash flows at a higher interest rate when inflation rises to compensate for the fact they’re worth less in today’s money. All else being equal, the higher the level of inflation, the greater the discount rate2 applied to earnings and, therefore, the lower the price-to-earnings (P/E) ratio3 investors are prepared to pay (FIGURE 2).


FIGURE 2

High Inflation Tends to Hurt P/E Multiples

Past performance does not guarantee future results. Sources: Refinitiv Datastream and Schroders. Data from March 1973–December 2022.


Note, however, that the relationship is more ambiguous at low levels of inflation (e.g., below 3%), situations in which other factors may be driving valuations.


Which Equity Sectors May Offer Shelter Against Rising Inflation?

A potential inflation hedge is an investment that can mitigate the impact of price increases. So how often do different equity sectors achieve this and how well does it work?

That’s illustrated in FIGURE 3. The x-axis shows the percentage of rolling 12-month periods since 1973 in which equity returns exceeded inflation in high and rising inflation environments—a measure of how consistently each sector has beaten inflation in these environments.

The y-axis shows the real (inflation-adjusted) return achieved during those periods—a measure of how much they have beaten inflation by, on average, in these environments.


FIGURE 3

US Equity Sector Performance in High (+3% on Average) and Rising Inflation Environments, 1973-2022
Average 12-month inflation-adjusted return, %

Past performance does not guarantee future results. Investors cannot directly invest in indices. Based on monthly rolling 12-month returns in excess of US CPI inflation rate. High inflation is defined as periods where year-over-year percent change in US CPI is above 3% on average over last 12 months. Rising inflation is defined as the absolute change in the inflation rate over last 12 months. Real estate is proxied using the FTSE Nareit All Equity REITs Index and FTSE Nareit Mortgage REITs Index. All remaining sectors are proxied using US Datastream sector indices, which are float-adjusted, market-cap weighted, and cover the large-, mid-, and small-cap companies within each sector of the US equity market. The FTSE Nareit US Real Estate Index Series is a comprehensive family of REIT-focused indices that span the commercial real-estate industry. Sources: Refinitiv Datastream and Schroders. Data from March 1973–December 2022.


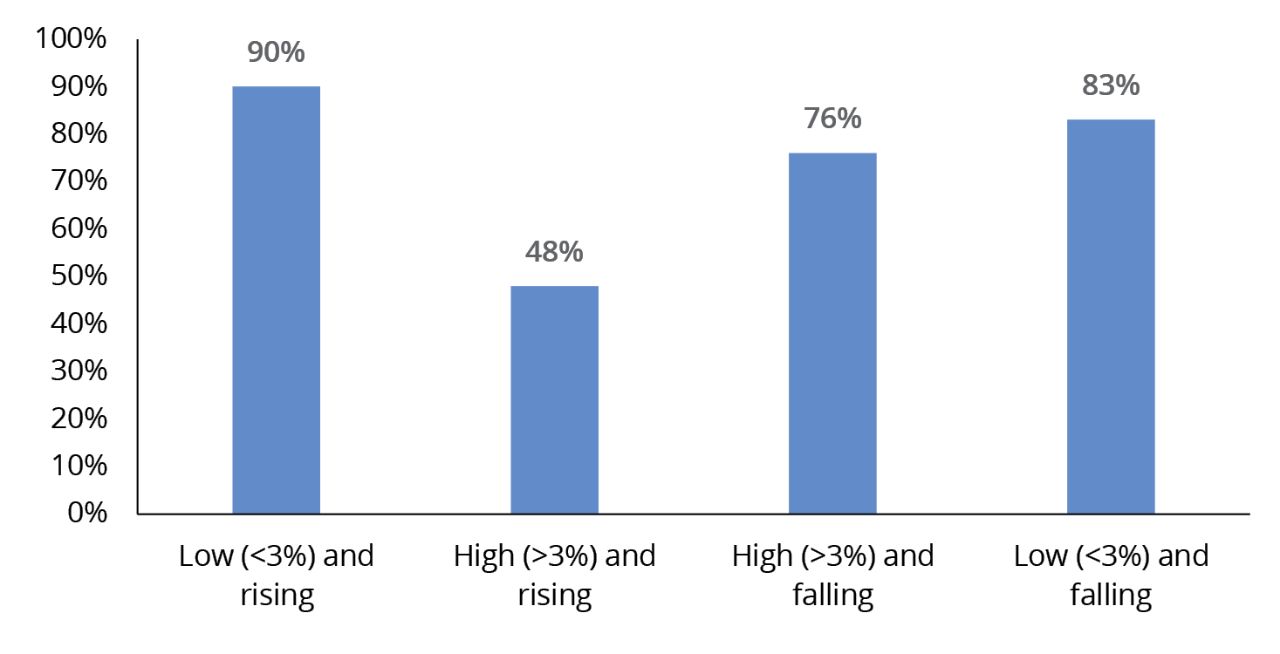
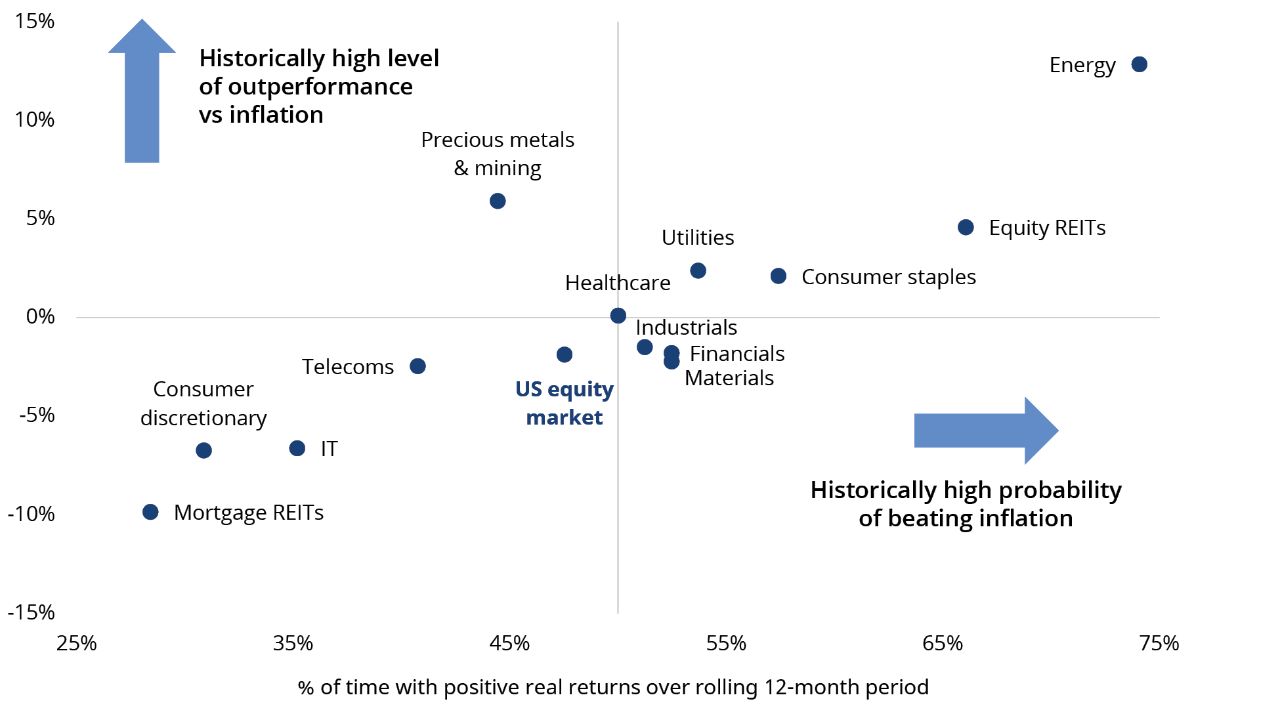
Although equities in general have performed quite poorly in high and rising inflation environments, there are potential areas that have historically performed better at the sector level. The energy sector, which includes oil and gas companies, is one of them. Such firms beat inflation 74% of the time and delivered an annual real return of 12.9% per year on average.

This is a fairly intuitive result. The revenues of energy stocks are naturally tied to energy prices, a key component of inflation indices. So by definition, they generally have performed well when inflation rises.

Equity REITs (real-estate investment trusts) may also help mitigate the impact of rising inflation. They outperformed inflation 66% of the time and posted an average real return of 4.6%. This makes sense too. Equity REITs own real-estate assets and may provide a partial inflation hedge via the pass-through of price increases in rental contracts and property prices.

In contrast, mortgage REITs, which invest in mortgages, are among the worst-performing sectors. Just like bonds, their coupon payments generally become less valuable as inflation increases, sending their yields higher and prices lower to compensate.

The same is true of promised future growth in profits for information-technology stocks. The bulk of their cash flows are expected to arrive in the distant future, which may be worth far less in today’s money when inflation increases. Financials, on the other hand, have performed comparatively better, as their cash flows tend to be concentrated in the shorter term.

But high inflation can still be especially harmful for banks because it erodes the present value of existing loans that will be paid back in the future.

Utility stocks display a somewhat disappointing success rate of only slightly above 50%. As natural monopolies, they should be able to pass on cost increases to consumers to maintain profit margins. However, in practice, regulation often prevents them from fully doing so.

What’s more, given the stable nature of their business and dividend payments, utility stocks are often traded as “bond proxies,” meaning they might be bid down relative to other sectors when inflation takes off (and bond prices fall).

Meanwhile, although gold is often touted as a hedge against currency-debasement fears, the track record for companies in the precious-metals and mining sector is mixed.

On average, such firms posted an average real return of 5.9% in high and rising inflation environments. But the likelihood of this happening was worse than a coin toss—they beat inflation only 44% of the time, considerably less than many other sectors.  

In summary, if the current inflationary uptick continues, equity prices could stay volatile. But some sectors may absorb the impact better and others are even poised to benefit.


Talk to your financial professional about how you can help position your portfolio for potential inflation.


1 A real estate investment trust (REIT) is a company that owns, operates, or finances income-generating real estate. Modeled after mutual funds, REITs pool the capital of numerous investors, thus making it possible for them to earn dividends from real-estate investments without having to buy, manage, or finance any properties themselves. 

2 Discount rate refers to the interest rate used in discounted cash flow analysis to determine the present value of future cash flows.

3 Price/Earnings is the ratio of a stock’s price to its earnings per share.

Important Risks: Investing involves risk, including the possible loss of principal. • Investments in the commodities market and the natural-resource industry may increase liquidity risk, volatility, and risk of loss if adverse developments occur. • There are risks of focusing investments in securities of companies in the utilities and industrials sectors which may cause the performance to be sensitive to developments in those sectors. • The value of the underlying real estate of real-estate-related securities may go down due to various factors, including but not limited to, strength of the economy, amount of new construction, laws and regulations, costs of real estate, availability of mortgages and changes in interest rates. • Mortgage-related and asset-backed securities’ risks include credit, interest-rate, prepayment, and extension risk. • Different investment styles may go in and out of favor, which may cause underperformance to the broader stock market. • Risks of focusing investments on the healthcare-related sector include regulatory and legal developments, patent considerations, intense competitive pressures, rapid technological changes, potential product obsolescence, and liquidity risk.

Neither MSCI nor any other party involved in or related to compiling, computing or creating the MSCI data makes any express or implied warranties or representations with respect to such data (or the results to be obtained by the use thereof), and all such parties hereby expressly disclaim all warranties of originality, accuracy, completeness, merchantability or fitness for a particular purpose with respect to any of such data. Without limiting any of the foregoing, in no event shall MSCI, any of its affiliates or any third party involved in or related to compiling, computing or creating the data have any liability for any direct, indirect, special, punitive, consequential or any other damages (including lost profits) even if notified of the possibility of such damages. No further distribution or dissemination of the MSCI data is permitted without MSCI’s express written consent.

The views expressed herein are those of Schroders Investment Management, are for informational purposes only, and are subject to change based on prevailing market, economic, and other conditions. The views expressed may not reflect the opinions of Hartford Funds or any other sub-adviser to our funds. They should not be construed as research or investment advice nor should they be considered an offer or solicitation to buy or sell any security. This information is current at the time of writing and may not be reproduced or distributed in whole or in part, for any purpose, without the express written consent of Schroders Investment Management or Hartford Funds.

WP597 2700512

Insight from sub-adviser Schroders Investment Management
Author Headshot
Head of Strategic Research


The material on this site is for informational and educational purposes only. The material should not be considered tax or legal advice and is not to be relied on as a forecast. The material is also not a recommendation or advice regarding any particular security, strategy or product. Hartford Funds does not represent that any products or strategies discussed are appropriate for any particular investor so investors should seek their own professional advice before investing. Hartford Funds does not serve as a fiduciary. Content is current as of the publication date or date indicated, and may be superseded by subsequent market and economic conditions.

Investing involves risk, including the possible loss of principal. Investors should carefully consider a fund's investment objectives, risks, charges and expenses. This and other important information is contained in the mutual fund, or ETF summary prospectus and/or prospectus, which can be obtained from a financial professional and should be read carefully before investing.

Mutual funds are distributed by Hartford Funds Distributors, LLC (HFD), Member FINRA|SIPC. ETFs are distributed by ALPS Distributors, Inc. (ALPS). Advisory services may be provided by Hartford Funds Management Company, LLC (HFMC) or its wholly owned subsidiary, Lattice Strategies LLC (Lattice). Certain funds are sub-advised by Wellington Management Company LLP and/or Schroder Investment Management North America Inc (SIMNA). Schroder Investment Management North America Ltd. (SIMNA Ltd) serves as a secondary sub-adviser to certain funds. HFMC, Lattice, Wellington Management, SIMNA, and SIMNA Ltd. are all SEC registered investment advisers. Hartford Funds refers to HFD, Lattice, and HFMC, which are not affiliated with any sub-adviser or ALPS. The funds and other products referred to on this Site may be offered and sold only to persons in the United States and its territories.

© Copyright 2023 Hartford Funds Management Group, Inc. All Rights Reserved. Not FDIC Insured | No Bank Guarantee | May Lose Value