• Products
  • Insights
  • Practice Management
  • Resources
  • About Us

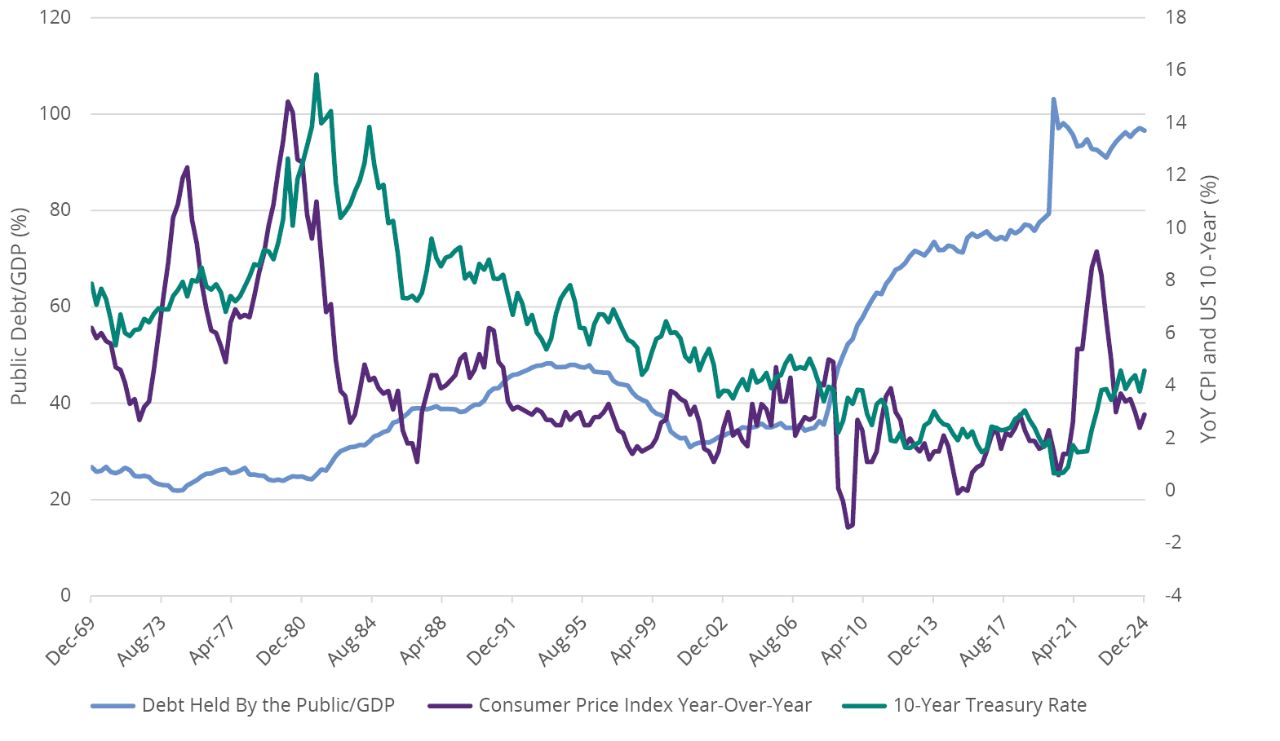
“The downgrade from the top rating of Aaa to Aa1 reflects the increase over more than a decade in government debt and interest payment ratios to levels that are significantly higher than similarly rated sovereigns. Successive US administrations and Congress have failed to agree on measures to reverse the trend of large annual fiscal deficits and growing interest costs.” - Moody’s Investor Service, May 2025

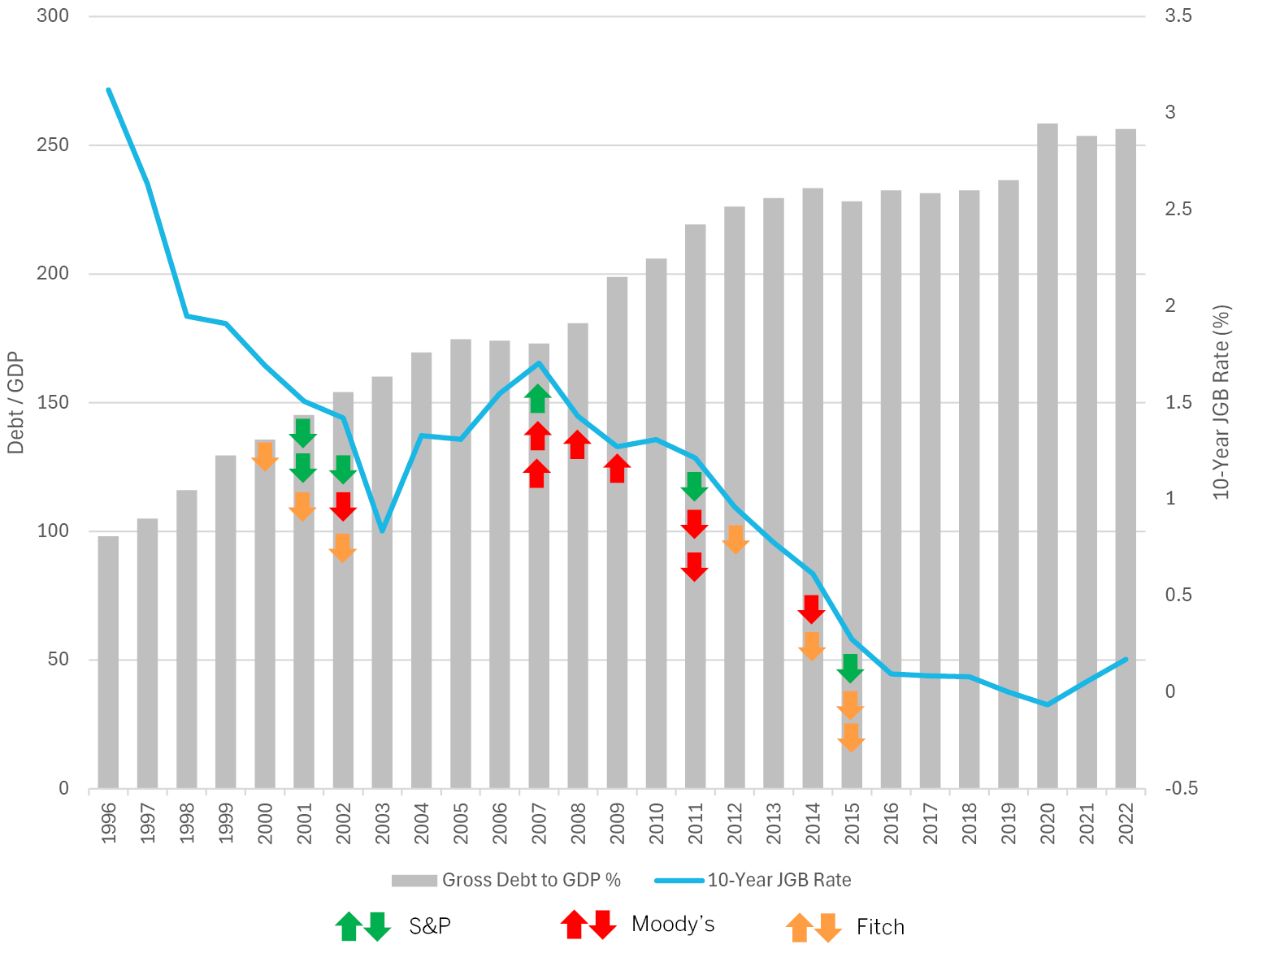
I was a young Treasury official in the Office of Debt Management during the summer of 2011, when Standard & Poor’s downgraded the US for the first time amid a debt ceiling standoff. At the time, I hoped it was a misjudgment—that the US would retain its other pristine AAA ratings, a reflection of the world’s most dynamic and wealthy economy.

But over the 14 years since that initial downgrade, the other agencies have followed suit. Fitch downgraded in August 2023, and now Moody’s followed in May 2025.

Despite the sting, it’s important to step back and assess the implications for global capital markets. The rating is intertwined with broader issues: reserve currency status, debt sustainability, domestic policymaking, and the viability of foreign alternatives to the US dollar (USD).

The downgrade has, in many respects, had a limited impact on market functioning. However, there are areas where it could begin to influence conditions in US capital markets. The rating itself is best understood as an output, or rather, a reflection of the country’s financial and institutional health. If it begins to serve as an input into how market participants assess risk and allocate capital, the potential for adverse consequences may grow over time.

Short-Term Calm, Long-Term Questions

Market Functionality and Liquidity
Treasury market liquidity remains strong relative to other asset classes. The US Treasury continues to conduct near-daily, multi-billion-dollar auctions across the yield curve,1 with minimal disruption. The underlying market structure is stable, with no changes to margin requirements or the use of Treasuries as collateral in the broader financial system. In fact, rates have declined since the Moody’s downgrade, and there’s little evidence of a credit risk premia2 being priced into Treasuries.

Volatility and Offshore Reactions
While tariffs may have sparked the initial reaction, much of the volatility seen in April stemmed from hedge funds unwinding leveraged swap spread trades3 tied to anticipated regulatory changes. This wave of selling quickly saturated dealer balance sheets. The resulting headlines unsettled offshore holders of Treasuries—especially in Japan’s private sector—leading to reduced demand for longer-dated bonds. At the same time, the Trump administration escalated criticism of Federal Reserve (Fed) Chair Jerome Powell, raising concerns about the central bank’s independence. That combination of strained market infrastructure and weak demand for long-term debt ultimately pushed the administration to scale back its original tariff proposals.

Global Sovereign Comparisons
The US remains the largest capital market globally, and the size, depth, and liquidity of the Treasury market (now approaching $25 trillion) far exceed those of other sovereign markets (FIGURE 1). China ranks second but operates with a relatively closed capital account. Japan is third, though most Japanese Government Bonds (JGBs) are held by the Bank of Japan and aren't actively traded. The scale of the tradeable US Treasury market is a reflection of financial power, shaping the structure and function of global capital markets.


FIGURE 1

US Government Leads in Sovereign Debt
Outstanding Government Debt Across Major Economies (USD, Billions)

As of 12/31/24. Data Source: BIS.

Nearly 40% of global transactions are priced in dollars—even when the US isn’t the final destination.


US Dominance in Trade
Despite weak year-to-date performance, the USD remains the dominant currency for global trade invoicing. Nearly 40% of global transactions are priced in dollars—even when the US isn’t the final destination.4 This dominance is reflected in international payment flows (FIGURE 2) and in export invoicing patterns across most regions (FIGURE 3), with the eurozone being a notable exception.


FIGURE 2

The Dollar’s Global Reach
Share of International Payments Priced in USD

Chart Data: 2010-2024. Data represents the share of international payments conducted via SWIFT, based on MT 103 and MT 202 messages. Intra-euro area payments are included. SWIFT is a global messaging network that enables secure and standardized communication between financial institutions for international money transfers. MT 103 is a SWIFT message format used for customer-initiated international wire transfers, containing detailed payment instructions between banks. MT 202 is a SWIFT message format used for financial institution transfers, typically to move funds between banks or settle transactions. Data Sources: SWIFT and Bloomberg.

FIGURE 3

Dollar Dominance in Global Trade Invoicing
Share of Exports Priced in USD Across Major Economies

Data Sources: International Monetary Fund's Direction of Trade, Central Bank of the Republic of China, Boz et al. (2020), and Federal Reserve Board staff calculations.

As the debt-to-GDP ratio has grown over time, the 10-year Treasury yield has generally remained flat or even declined, reflecting its stronger sensitivity to inflation.


Debt Sustainability and Yield Behavior
So far, debt sustainability hasn’t been the main driver of higher US Treasury yields. As the debt-to-GDP ratio5 has grown over time, the 10-year Treasury yield has generally remained flat or even declined, reflecting its greater sensitivity to inflation. While inflation can be linked to deficit spending, it’s also influenced by factors such as energy shocks and pandemic-related supply-chain disruptions. FIGURE 4 illustrates how the 10-year yield has moved over the decades in relation to inflation and the overall debt stock.


FIGURE 4

Rising Debt, Steady Yields
US Debt-to-GDP Ratio, Inflation, and 10-Year Treasury Yield

As of 12/31/24. Federal debt held by the public as a percentage of GDP; quarterly, seasonally adjusted. The Consumer Price Index is a measure published by the US Bureau of Labor Statistics that tracks the average change over time in prices paid by consumers for a basket of goods and services, and is widely used to gauge inflation. Data Source: Bloomberg.


Japan offers a useful counterexample. Despite a debt-to-GDP ratio exceeding 250% (one of the highest in the world), it has managed to maintain low borrowing costs. A high domestic savings rate and the fact that most of its debt is held domestically, including by the Bank of Japan, contribute to this stability. As a result, yields on JGBs tend to be more stable than those in other developed markets. Notably, even as rating agencies downgraded Japan and its debt levels rose, JGB yields continued to decline over time (FIGURE 5).


FIGURE 5

Japan’s Debt Has Risen—JGB Yields Haven’t
Japan’s Debt-to-GDP Ratio and 10-Year Government Bond Yield

Chart Data: 1995-2022. Data Sources: FRED, Moody’s, S&P, and Fitch.


FIGURE 6 highlights the pound sterling, which held reserve currency status through much of the 19th and early 20th centuries. The chart shows sharp spikes in yields as the UK navigated its role as a reserve issuer within the context of its empire. The pound’s decline as a global reserve currency was driven by the financial strain of heavy borrowing during World Wars I and II, the rise of the USD, and the shift in global financial leadership from London to New York.6 By the end of World War II, as the British Empire receded, there was little incentive to hold the pound sterling unless liabilities required it.


FIGURE 6

The Rise and Retreat of the Pound’s Global Power
Long-Term Net Debt-to-GDP Ratio in the UK

Chart Data: 1700-2022. Net debt-to-GDP ratio measures a country's total public debt minus its financial assets (such as cash or investments), compared to its GDP. It gives a more accurate picture of the government's actual debt burden relative to its economic output. Data Source: UK Office of Debt Responsibility.


Limits of Debt Metrics
It’s difficult to pinpoint an “optimal” debt-to-GDP ratio for a large, open economy—especially one that issues debt in its own currency and continues to serve as the world’s reserve currency. What the data suggest is that academics, policymakers, and markets still lack reliable tools and metrics to fully understand the scale and role of government debt in capital markets. That doesn’t mean there’s no limit; rather, the threshold is unclear given the many variables at play.


Recent volatility surrounding US policy has raised questions for allocators and reserve managers about whether the US still prioritizes being the preferred destination for global capital.


The Rating Does Matter … The Question Is Timing

The rating change signals a deeper erosion of US policymaking mechanisms and its standing as a global capital hub. Recent volatility around tariff policy, the debate a over a new tax provision aimed at countering foreign tax discrimination, and the scale of the One Big Beautiful Bill Act raise questions for allocators and reserve managers about whether the US still prioritizes being the preferred destination for global capital.7 Even before the current administration, domestic policymaking often appeared dysfunctional, marked by repeated debt-ceiling standoffs and occasional government shutdowns. Notably, two of the three major rating agencies cited institutional dysfunction as a key reason for the downgrade:

“The downgrade reflects our view that the effectiveness, stability and predictability of American policymaking and political institutions have weakened at a time of ongoing fiscal and economic challenges to a degree more than we envisioned when we assigned a negative outlook to the rating on April 18, 2011.” – Standard and Poor’s

“The rating downgrade of the US reflects the expected fiscal deterioration over the next three years, a high and growing general government debt burden, and the erosion of governance relative to 'AA' and 'AAA' rated peers over the last two decades that has manifested in repeated debt limit standoffs and last-minute resolutions.” – Fitch


Global Repercussions and Realignment

The recent dismissal of the Commissioner of the Bureau of Labor Statistics for making routine statistical revisions may point to continued institutional deterioration in the US, raising concerns about the future of economic governance.

Other countries have taken similar steps in times of crisis—Greece during the eurozone crisis for missing deficit targets, and Turkey and Argentina in response to unfavorable inflation data. While Moody’s expects the current US rating to hold for now, it has warned that further breakdowns in institutional integrity could prompt a reassessment.

Historically, global investors had few alternatives to US markets due to their size and return potential. That landscape is shifting. Japanese and German interest rates have moved away from the zero lower bound, making their government securities more attractive. In equities, the US has lagged in year-to-date performance, prompting a reevaluation of its role in strategic asset allocation. Even Treasuries now demand higher compensation, known as term premia,8 driven by policy uncertainty, persistent inflation, and outright expected supply. Without intervention from the Fed, this added premium could complicate future debt issuance.


The global financial system is gradually moving toward a more multilateral currency framework, with China playing a leading role.


At the same time, the global financial system is gradually moving toward a more multilateral currency framework, with China playing a leading role. A recent speech by Pan Gongsheng, Governor of the People’s Bank of China (PBOC), outlines a vision for such a regime.9 While the Chinese yuan (RMB) hasn’t overtaken the dollar in usability, the PBOC has established swap lines with nearly 30 countries to support trade and settlement in RMB. These deliberate steps suggest a growing push toward currency diversification.


Putting the Downgrade in Perspective

The US has weathered similar challenges in the past. In the 1970s, the Nixon administration’s decision to remove the USD from the gold standard coincided with high inflation, a grinding conflict in Vietnam, and the Watergate scandal—leading many to predict the dollar’s decline. Yet it endured and eventually strengthened.

For investors, this history underscores the importance of broad diversification, not just for managing risk, but also for seeking returns. New markets have emerged, and some long-standing ones no longer offer the same appeal they once did.


To learn more about shifting global markets, please talk to your financial professional. 


1 The yield curve is a line that plots interest rates of bonds having equal credit quality but differing maturity dates; its slope is used to forecast the state of the economy and interest-rate changes.

2 Risk premia is the investment return an asset is expected to yield in excess of the risk-free rate of return.

3 A swap spread trade profits from the yield difference between interest rate swaps and government bonds.

4 European Central Bank, "Global Trade Invoicing Patterns: New Insights and the Influence of Geopolitics," June 2025.

5 The debt-to-GDP ratio compares a country's total public debt to its GDP, indicating how much it owes relative to its economic output and helping assess its ability to repay debt.

6 William L. Silber, "When Washington Shut Down Wall Street: The Great Financial Crisis of 1914 and the Origins of America’s Monetary Supremacy."

7 Stephen Miran, "A User’s Guide to Restructuring the Global Trading System," Hudson Bay Capital, November 2024.

8 Term premia is the compensation that investors require for bearing the risk of longer maturities, which are more sensitive to changes in interest rates.

9 Pan Gongsheng, “A Few Observations on Global Financial Governance,” keynote speech at the 16th Lujiazui Forum, Shanghai, 6/18/25, BIS.

Important Risks: Investing involves risk, including the possible loss of principal. • Fixed income security risks include credit, liquidity, call, duration, and interest-rate risk. As interest rates rise, bond prices generally fall. • Foreign investments may be more volatile and less liquid than US investments and are subject to the risk of currency fluctuations and adverse political, economic and regulatory developments. These risks may be greater, and include additional risks, for investments in emerging markets. • Diversification does not ensure a profit or protect against a loss in declining markets.

The views expressed herein are those of Wellington Management, are for informational purposes only, and are subject to change based on prevailing market, economic, and other conditions. The views expressed may not reflect the opinions of Hartford Funds or any other sub-adviser to our funds. They should not be construed as research or investment advice nor should they be considered an offer or solicitation to buy or sell any security. This information is current at the time of writing and may not be reproduced or distributed in whole or in part, for any purpose, without the express written consent of Wellington Management or Hartford Funds.


FIOWP036 4743596
Insight from sub-adviser Wellington Management
Author Headshot
Managing Director at Wellington Management LLP and Fixed-Income Strategist for Hartford Funds
Author Headshot
Investment Communications Manager at Wellington Management LLP