• Products
  • Insights
  • Practice Management
  • Resources
  • About Us

US equities, as measured by the S&P 500 Index, compounded at a remarkable average annual rate of 13.5% from 2009 to 2024.1 Investors who eschewed diversification in favor of US equities saw their portfolios handily outperform more diversified portfolios—until now. 

The long-awaited broadening of returns beyond US large-cap equities began before President Donald Trump’s historic tariff announcement on April 2 sparked a significant uptick in volatility, and there are compelling reasons why this trend could continue going forward. 

Risk-conscious investors may want to consider three strategies: diversifying with fixed income, reallocating to international equities, and incorporating dividend-paying stocks.


1. Diversifying With Fixed Income
Even after the dramatic sell-off in the wake of Trump’s tariff announcement, US equities are still trading at a premium valuation on a forward-looking basis.2 Valuations have fallen, but still seem to be pricing in a swift resolution of trade disputes and continued optimism about artificial intelligence. 

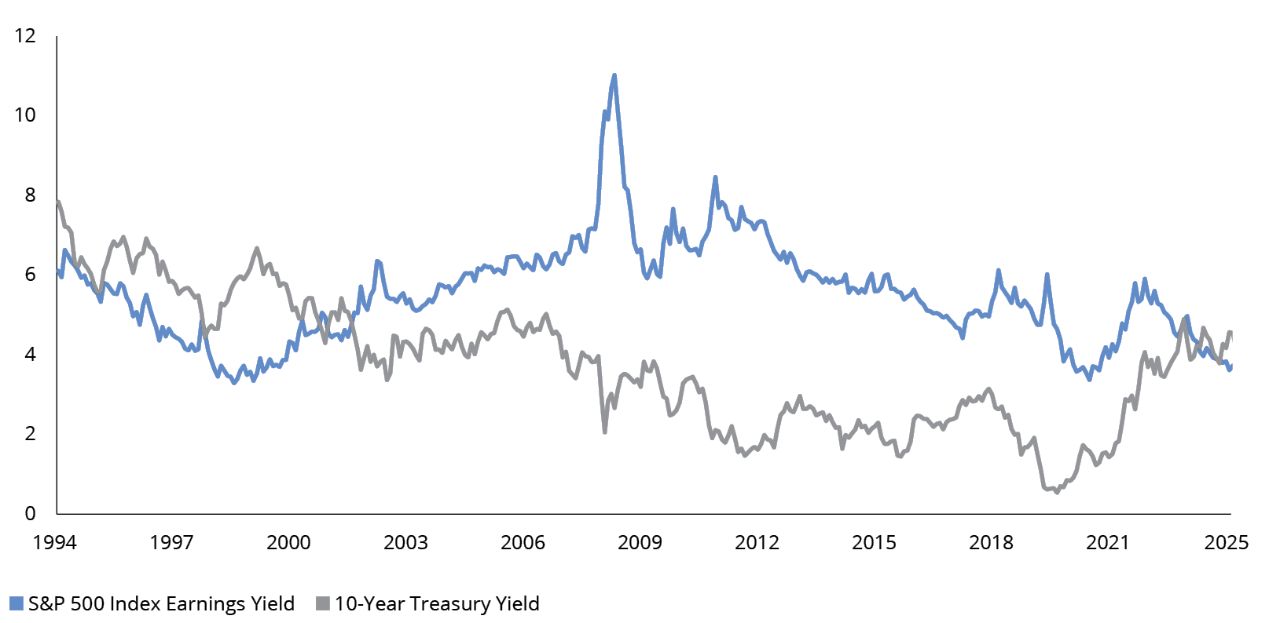
One way to measure the relative value of stocks vs. bonds is with the earnings yield, which measures the S&P 500 Index’s most recent 12-month earnings divided by its current market price. The yield on the 10-year US Treasury recently surpassed the S&P 500 Index’s earnings yield (FIGURE 1). This may indicate that bonds are currently a better value than stocks. 

FIGURE 1

Bonds May Be Undervalued Relative to Stocks 
S&P 500 Index Earnings Yield and 10-Year Treasury Yield (%)

line chart

Chart Data: 4/28/95-3/31/25. Past performance does not guarantee future results. Indices are unmanaged and not available for direct investment. Please see below for index definitions. Data Sources: FactSet and Hartford Funds, 4/25.


After trading at a premium from 2018 until early 2022, the average price of bonds in the Bloomberg US Aggregate Bond Index (the Agg) has been trading at a discount (FIGURE 2). This fact, coupled with the potential for rate cuts by the Federal Reserve (Fed), could mean attractive total return for bonds going forward.


FIGURE 2

The Average Bond Is Trading at a Discount
Average Bond Price of the Bloomberg US Aggregate Bond Index

chart

Chart Data: 1/30/76-3/31/25. Past performance does not guarantee future results. A bond is trading at a premium when the current price is higher than its face value. A bond is trading at a discount when the current price is less than its face value. Data Source: Bloomberg, 4/25. 


Another compelling argument for bonds is their attractive yields. The best predictor of future bond returns has historically been their current yield. When you overlay the ending yield of the Agg with its 10-year rolling returns, the strong correlation between yield and return is striking (FIGURE 3). 


FIGURE 3

Bond Yields Suggest Potentially Attractive Forward Returns
Bloomberg US Aggregate Bond Index Yield to Worst and Rolling 10-Year Returns 

Chart Data: 1/31/76-3/31/25. Past performance does not guarantee future results. Yield to worst (YTW) is the minimum yield that can be received on a bond assuming the issuer doesn’t default on any of its payments. Data Sources: Bloomberg, Morningstar, and Hartford Funds, 4/25.

Bonds have experienced significantly lower maximum annual drawdowns than stocks during periods of market stress.

Fixed Income Has Experienced Significantly Lower Drawdowns

One of the main reasons for owning bonds is to hedge against equity volatility in a portfolio. Since 1985, bonds have averaged a maximum average annual loss of -2.3% vs. a -14.0% maximum average annual loss for stocks (FIGURE 4).


FIGURE 4

The Maximum Annual Loss for Bonds Is Significantly Lower Than for Stocks
S&P 500 Index vs. Bloomberg US Aggregate Bond Index: Intra-Year Max Drawdowns

chart

Chart Data: 1985-3/31/25. Past performance does not guarantee future results. Drawdowns refers to the largest drop from peak to trough in performance during the calendar year. Bonds are represented by the Bloomberg US Aggregate Bond Index. Stocks are represented by the S&P 500 Index. Data Sources: Morningstar and Hartford Funds, 4/25.


2. Reallocating to International Equities

US large-cap equities performed so well in the aftermath of the Global Financial Crisis that they were often the best-performing asset class over the past 15 years—significantly outperforming diversified portfolios. This led some market commentators to declare that we’ve been in “a bear market for diversification.”3

There are good reasons why US equities should be the cornerstone of investor portfolios: The US has a unique mix of highly innovative companies, high liquidity, and a business-friendly regulatory environment. Nevertheless, prudent risk management suggests that overlooking most of the world’s companies may not be wise (FIGURE 5). Many investors are surprised to discover that most of the best-performing stocks each year are based outside the US (FIGURE 6). 


FIGURE 5

US Companies Make Up Just 14% of All Global Public Companies
Global Percentage of Publicly Listed Companies by Region

pie chart

As of 3/31/25. Data Source: Bloomberg, 4/25. 

FIGURE 6

Most of the Best-Performing Companies Each Year Are Outside the US 
Percentage of the World’s Top 50 Stocks That Are Non-US

bar chart

Chart Data: 2015-3/31/25. Past performance does not guarantee future results. Based on the annual calendar year returns of 50 highest-performing stocks of the MSCI ACWI Index. Please see below for index definitions. Data Sources: Factset and Hartford Funds, 4/25.

International Equities Are Less Concentrated and More Diversified by Sector

The concentration risk in many US large-cap portfolios has received a great deal of attention in recent years—and with good reason. Concentrated portfolios benefit investors when the largest holdings in the portfolio perform well, but they can significantly harm investors when they perform poorly. The S&P 500 Index, which is the basis for many of the largest mutual funds and ETFs in retirement plans and IRAs, has much more concentration risk than a comparable international index (FIGURE 7).

In addition to concentration by holdings, the S&P 500 Index is also significantly more concentrated by sector than a representative international index (FIGURE 8). The S&P 500 Index has a 30% weighting in technology, but this figure doesn’t take into account tech-oriented companies such as Amazon, Meta, Alphabet, and Tesla that are classified in different sectors. Including those types of companies pushes the technology and tech-adjacent allocation to approximately 40%. 


FIGURE 7

The S&P 500 Index Is Nearly Three Times More Concentrated in its Top Holdings Than a Comparable International Index
Top 10 Holdings Concentration: S&P 500 Index vs. MSCI World ex USA Index 

bar chart

As of 3/31/25. Please see below for index definitions. Data Sources: FactSet and Hartford Funds, 4/25.  

FIGURE 8

The S&P 500 Index Is Much More Concentrated by Sector Than Than a Comparable International Index
Sector Allocations (%): S&P 500 Index vs. MSCI World ex USA Index

bar chart

As of 3/31/25. Source: FactSet, 4/25. 

Tariffs could change how international investors think about what the US has to offer.

*View the full list of Hartford Funds

1 Data Sources: Morningstar and Hartford Funds, 4/25. 
2 Valuations as measured by P/E ratios. Data Source: Y charts
3 Source: Bloomberg, “Great ‘Bear Market in Diversification’ Haunts Wall Street Pros,” 4/25. 
4 Source: The Asahi Shimbun, “Japanese Firms Struggle to Find Areas to Mitigate Trump’s Tariffs,” 4/9/25. 
5 Source: Center for Economic Policy Research, “EU Supply Chain Tectonics,” 4/3/25.
6 Source: Invest India, “A Decade of Economic Transformation With ‘Make in India,” 9/30/24. 
7 Source: Peninsula Group Limited, “US Tariffs on Canada: Sourcing From Canadian Suppliers May Be the Answer,” 3/6/25.
8 Source: Wellington Management, “Could ‘Liberation Day’ Trigger a Shift in Capital Flows?,” 4/25. 
9 Risk premium is the investment return an asset is expected to yield in excess of the risk-free rate of return.
10 Source: Wellington Management, “What Do Tariffs Mean for Portfolios?,” 4/25. Nanette Abuhoff Jacobson is a managing director and multi-asset strategist at Wellington Management and global investment strategist for Hartford Funds. 
11 The Draghi Report, authored by former European Central Bank President   Mario Draghi, outlines challenges faced by the European Union and provides recommendations to enhance economic growth and competitiveness. 


Bloomberg US Aggregate Bond Index is composed of securities that cover the US investment-grade fixed-rate bond market, with index components for government and corporate securities, mortgage pass-through securities, and asset-backed securities.
MSCI EAFE Index is a free float-adjusted capitalization index that is designed to measure developed market equity performance, and excludes the US and Canada.
MSCI World ex USA Index is a free float-adjusted market capitalization index that captures large and mid cap representation across developed markets countries excluding the United States. MSCI performance is shown net of dividend withholding tax.
S&P 500 Index is a market capitalization-weighted price index composed of 500 widely held common stocks.

Important Risks: Investing involves risk, including the possible loss of principal. • Fixed income security risks include credit, liquidity, call, duration, and interest-rate risk. As interest rates rise, bond prices generally fall. • For dividend-paying stocks, dividends are not guaranteed and may decrease without notice. • Foreign investments may be more volatile and less liquid than US investments and are subject to the risk of currency fluctuations and adverse political, economic and regulatory developments. These risks may be greater, and include additional risks, for investments in emerging markets.  

This information should not be considered investment advice or a recommendation to buy/sell any security. In addition, it does not take into account the specific investment objectives, tax and financial condition of any specific person. This information has been prepared from sources believed reliable, but the accuracy and completeness of the information cannot be guaranteed. This material and/or its contents are current at the time of writing and are subject to change without notice. 


WP832 4472845