Pre-Sales Support
Mutual Funds and ETFs - 800-456-7526
Monday-Thursday: 8:00 a.m. – 6:00 p.m. ET
Friday: 8:00 a.m. – 5:00 p.m. ET
Post-Sales and Website Support
888-843-7824
Monday-Friday: 9:00 a.m. - 6:00 p.m. ET
Today, it feels like we’re facing one market crisis after another. And when times are challenging, it may seem like the only rational strategy is to play it safe to avoid losses. Yet FIGURE 1 shows that positive years far outweigh negative years.
What’s more, the seemingly “safer” investment choices of bonds or cash may have provided temporary relief during volatile times, but historically, they’ve fallen far behind equity and balanced investors over the long term (FIGURE 2).
Figure 1
Good Years Outnumber Bad Years
S&P 500 Index (1926–2022)
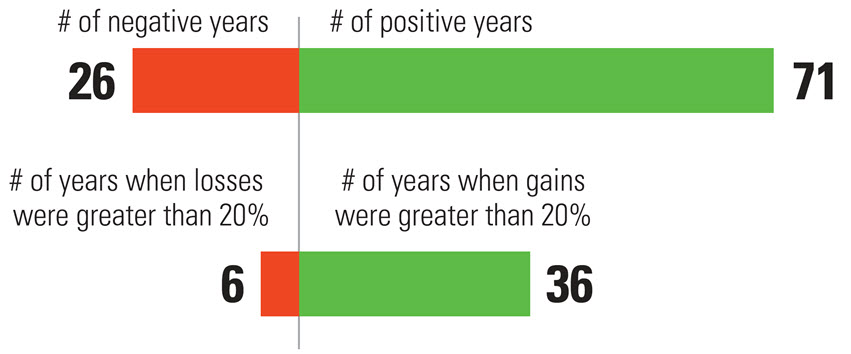
Average Annual Return: 10.12%
Figure 2
Four Investment Paths Through Good and Bad Years
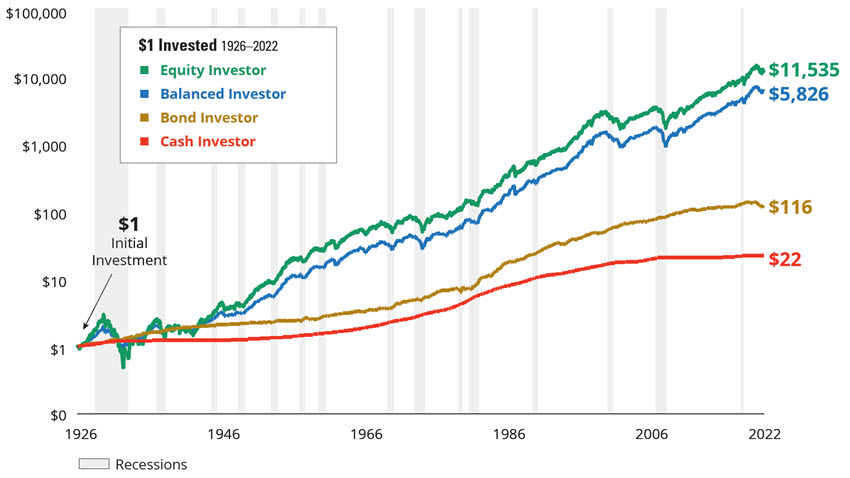
As of 12/31/22. Past performance does not guarantee future results. Indices are unmanaged and not available for direct investment. Equity Investor represented by the S&P 500 Index; Balanced Investor represented by 50% S&P 500 Index and 50% IA SBBI US Long-Term Corporate Bond Index; Bond Investor represented by 1926-1975: IA SBBI Long-Term Government Index and 1976-present: Bloomberg US Aggregate Bond Index; Cash Investor represented by 30-Day T-Bills. See below for index definitions. Sources: Morningstar, Ned Davis Research, and Hartford Funds, 1/23.
Talk to your financial professional to help avoid short-term decisions that could hurt your long-term results.
S&P 500 Index is a market capitalization-weighted price index composed of 500 widely held common stocks.
IA SBBI US Long-Term Corporate Bond Index measures the performance of US dollar-denominated bonds issued in the US investment-grade bond market including US and non-US corporate securities that have at least 10 years to maturity and a credit rating of AAA/AA.
IA SBBI Long-Term Government Index measures the performance of a single issue of outstanding US Treasury note with a maturity term of around 5.5 years.
Bloomberg US Aggregate Bond Index is composed of securities from the Bloomberg Government/Credit Bond Index, Mortgage-Backed Securities Index, Asset-Backed Securities Index, and Commercial Mortgage-Backed Securities Index.
T-Bills are guaranteed as to the timely payment of principal and interest by the US government and generally have lower risk-and-return than bonds and equity.
Important Risks: Investing involves risk, including the possible loss of principal. • Fixed income security risks include credit, liquidity, call, duration, and interest-rate risk. As interest rates rise, bond prices generally fall. • Diversification does not ensure a profit or protect against a loss in declining market.
“Bloomberg®” and any Bloomberg Index are service marks of Bloomberg Finance L.P. and its affiliates, including Bloomberg Index Services Limited (“BISL”), the administrator of the indices (collectively, “Bloomberg”) and have been licensed for use for certain purposes by Hartford Funds. Bloomberg is not affiliated with Hartford Funds, and Bloomberg does not approve, endorse, review, or recommend any Hartford Funds product. Bloomberg does not guarantee the timeliness, accurateness, or completeness of any data or information relating to Hartford Fund products.