Pre-Sales Support
Mutual Funds and ETFs - 800-456-7526
Monday-Thursday: 8:00 a.m. – 6:00 p.m. ET
Friday: 8:00 a.m. – 5:00 p.m. ET
Post-Sales and Website Support
888-843-7824
Monday-Friday: 9:00 a.m. - 6:00 p.m. ET
Regardless of which party controls Congress after the midterm elections, investors have often been rewarded. Since 1950, stocks have generated an average return of 15.17% in the year following midterm elections, compared with 7.30% in all other years. With the election in the rearview mirror, markets have often responded favorably as political uncertainty begins to fade.
FIGURE 1
Stock Returns Following Midterm Elections Have Typically Outpaced Other Years
S&P 500 Index Returns One Year After Midterm Elections
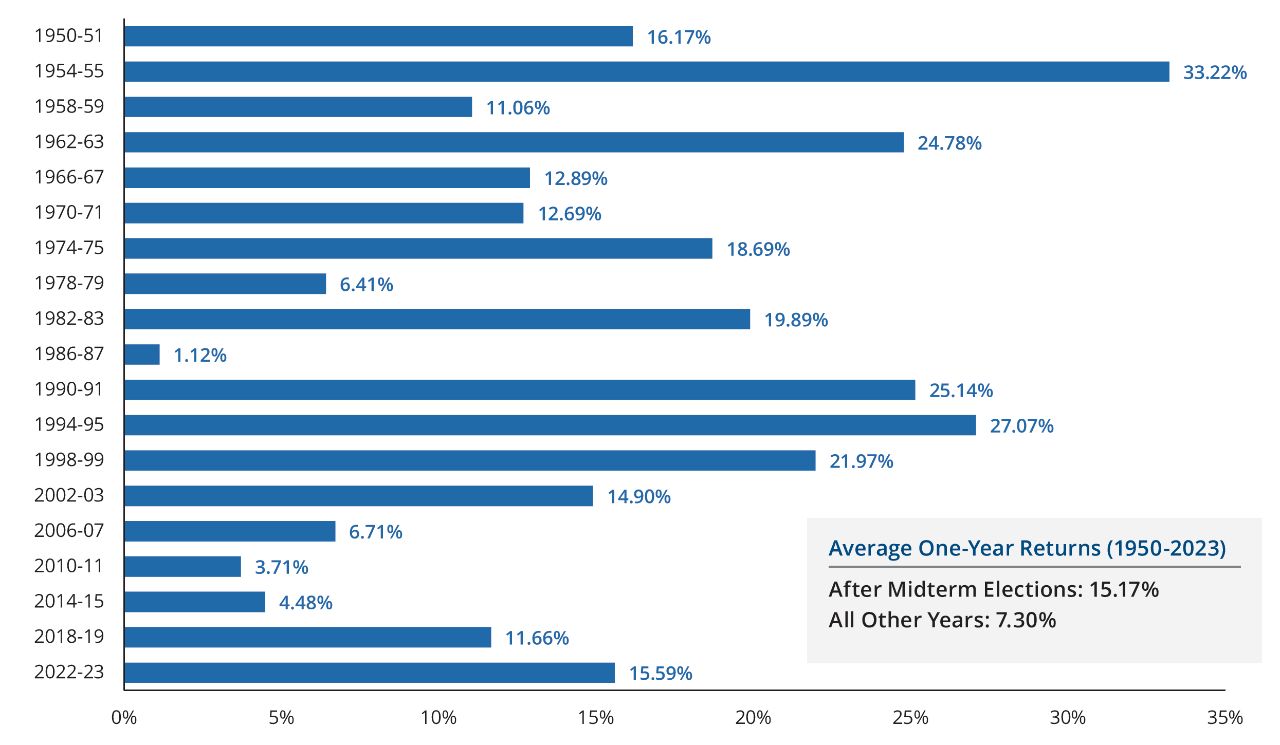
Chart Data: 1950-2023. Past performance does not guarantee future results. Indices are unmanaged and not available for direct investment. For illustrative purposes only. Returns are calculated beginning on Election Day. Source: Morningstar, 8/26.
The post-midterm effect is just one part of the story, though. The third year of a president’s term has historically been the strongest of the four-year presidential cycle, often delivering returns well above the long-term average. Some attribute this pattern to efforts to stimulate the economy ahead of the next presidential election.
FIGURE 2
The Third Year of a Presidential Term Has Been the Strongest for Stocks—By Far
Average Annual S&P 500 Index Returns by Presidential Term Year Since 1950
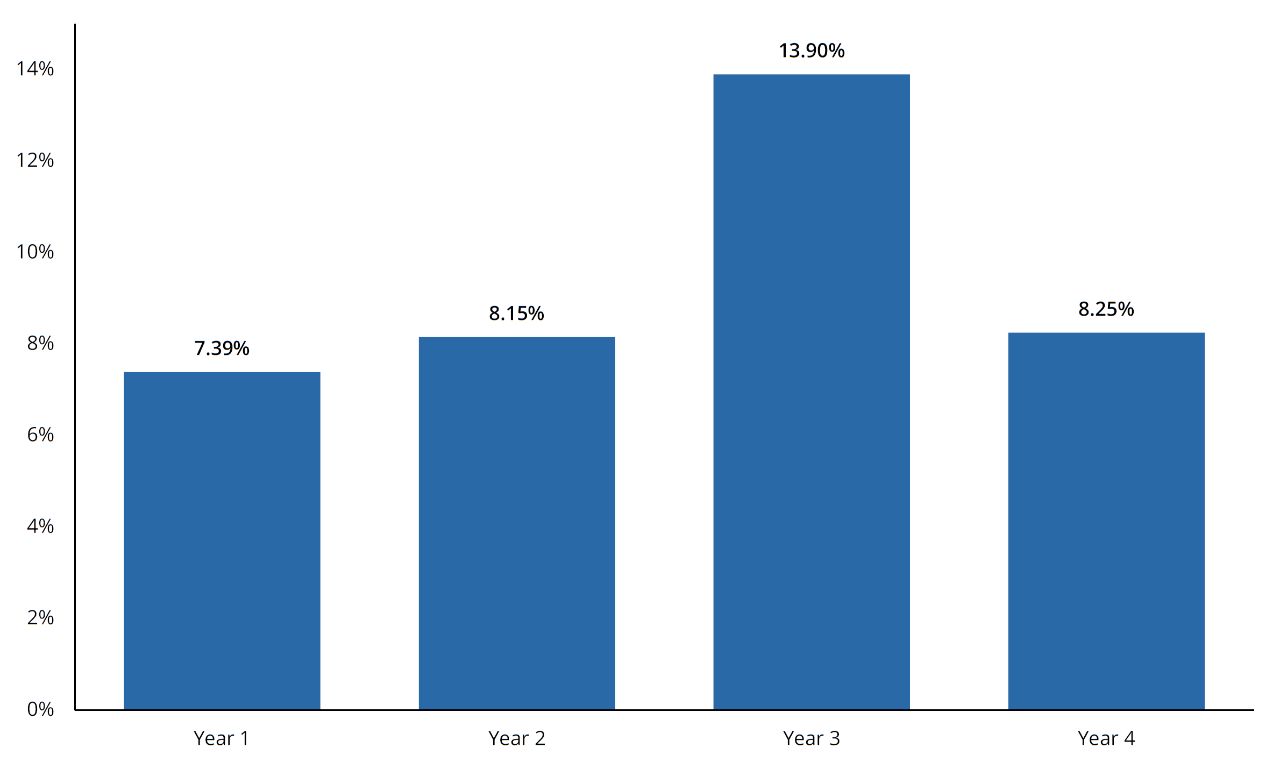
Chart Data: 1950-2023. Past performance does not guarantee future results. For illustrative purposes only. Returns are calculated beginning on Inauguration Day. Source: Morningstar, 8/26.
A financial professional can help you build a portfolio that’s right for you despite political uncertainty.
S&P 500 Index is a market capitalization-weighted price index composed of 500 widely held common stocks.
Investing involves risk, including the possible loss of principal.
Diversification does not ensure a profit or protect against a loss.
This material is provided for educational purposes only.