• Products
  • Insights
  • Practice Management
  • Resources
  • About Us

Domestic Equity fund

Hartford Dividend and Growth Fund   

MORNINGSTAR RATING:
Overall, 5 stars, 3-Year, 4 stars, 5-Year, 4 stars, and 10-Year, 5 stars, rated against 1128, 1128, 1069 and 822 products, respectively. Morningstar RatingTM is calculated for products with at least a 3-year history, based on a risk-adjusted return measure (excluding any applicable sale charges) and accounts for variations in a product's monthly performance. 5 stars are assigned to the top 10%; 4 stars to the next 22.5%, 3 stars to the next 35%, 2 stars to the next 22.5% and 1 star to the bottom 10%. ETFs and mutual funds are considered a single population. The Overall Rating is derived from a weighted average of the performance figures associated with its 3-, 5-, and 10-year (if applicable) Morningstar Rating metrics. For more information about these ratings, including their methodology, please go to global.morningstar.com/managerdisclosures . Ratings for other share classes may vary and are subject to change monthly. Past performance is no guarantee of future performance.
©2024 Morningstar, Inc. All rights reserved. The information contained herein: (1) is proprietary to Morningstar and/ or its content providers; (2) may not be copied or distributed; and (3) is not warranted to be accurate, complete or timely. Neither Morningstar nor its content providers are responsible for any damages or losses arising from any use of this information.
overall (as of 2/29/2024)
1128 PRODUCTS
Large Value Category
Based on Risk-Adjusted Returns

Domestic Equity fund

Hartford Dividend and Growth Fund   
Share Class - A (IHGIX)

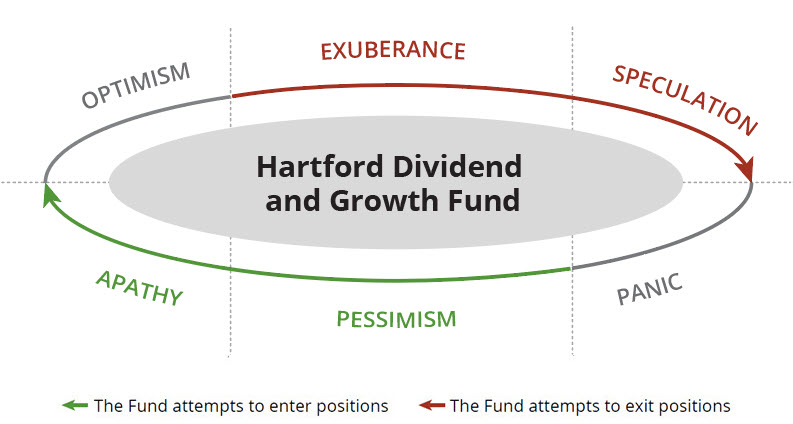
Fundamental Investing Throughout the Market Cycle

Hartford Dividend and Growth Fund seeks to generate a high level of current income consistent with growth of capital by identifying undervalued companies with increasing profitability.

Portfolio Management
Senior Managing Director
Equity Portfolio Manager
14
YRS
MANAGING THIS FUND
20
YRS
AT WELLINGTON MANAGEMENT
29
YRS
EXPERIENCE IN THIS INDUSTRY
Senior Managing Director
Equity Portfolio Manager
4
YRS
MANAGING THIS FUND
18
YRS
AT WELLINGTON MANAGEMENT
26
YRS
EXPERIENCE IN THIS INDUSTRY
Managing Director
Equity Research Analyst
1
YRS
MANAGING THIS FUND
8
YRS
AT WELLINGTON MANAGEMENT
12
YRS
EXPERIENCE IN THIS INDUSTRY

The portfolio managers are supported by the full resources of Wellington.

Performance

PERFORMANCE %
 
CUMULATIVE %
(as of 2/29/2024)
AVERAGE ANNUAL TOTAL RETURNS %
(as of 2/29/2024)
YTD 1YR 3YR 5YR 10YR SI
Hartford Dividend and Growth A 2.60 16.44 10.18 11.69 10.33 9.38
With 5.5% Max Sales Charge --- 10.04 8.13 10.43 9.71 9.16
Benchmark 7.11 30.45 11.91 14.76 12.70 ---
Morningstar Large Value Category 3.60 13.91 9.31 9.88 8.74 ---
 
CUMULATIVE %
(as of 12/31/2023)
AVERAGE ANNUAL TOTAL RETURNS %
(as of 12/31/2023)
YTD 1YR 3YR 5YR 10YR SI
Hartford Dividend and Growth A 13.81 13.81 10.71 13.30 10.15 9.34
With 5.5% Max Sales Charge --- 7.55 8.64 12.03 9.53 9.11
Benchmark 26.29 26.29 10.00 15.69 12.03 ---
Morningstar Large Value Category 11.63 11.63 9.74 11.37 8.39 ---

Performance data quoted represents past performance and does not guarantee future results. The investment return and principal value of an investment will fluctuate so that an investor's shares, when redeemed, may be worth more or less than their original cost. Current performance may be lower or higher than the performance data quoted.

SI = Since Inception. Fund Inception: 07/22/1996

Hartford Dividend and Growth Fund A Share Morningstar Ratings
overall
(as of 2/29/2024)
Overall, 5 stars, 3-Year, 4 stars, 5-Year, 4 stars, and 10-Year, 5 stars, rated against 1128, 1128, 1069 and 822 products, respectively. Morningstar RatingTM is calculated for products with at least a 3-year history, based on a risk-adjusted return measure (excluding any applicable sale charges) and accounts for variations in a product's monthly performance. 5 stars are assigned to the top 10%; 4 stars to the next 22.5%, 3 stars to the next 35%, 2 stars to the next 22.5% and 1 star to the bottom 10%. ETFs and mutual funds are considered a single population. The Overall Rating is derived from a weighted average of the performance figures associated with its 3-, 5-, and 10-year (if applicable) Morningstar Rating metrics. For more information about these ratings, including their methodology, please go to global.morningstar.com/managerdisclosures . Ratings for other share classes may vary and are subject to change monthly. Past performance is no guarantee of future performance.
©2024 Morningstar, Inc. All rights reserved. The information contained herein: (1) is proprietary to Morningstar and/ or its content providers; (2) may not be copied or distributed; and (3) is not warranted to be accurate, complete or timely. Neither Morningstar nor its content providers are responsible for any damages or losses arising from any use of this information.

1128 PRODUCTS
|
Large Value Category
Based on Risk-Adjusted Returns
3 YEAR
(as of 2/29/2024)
Overall, 5 stars, 3-Year, 4 stars, 5-Year, 4 stars, and 10-Year, 5 stars, rated against 1128, 1128, 1069 and 822 products, respectively. Morningstar RatingTM is calculated for products with at least a 3-year history, based on a risk-adjusted return measure (excluding any applicable sale charges) and accounts for variations in a product's monthly performance. 5 stars are assigned to the top 10%; 4 stars to the next 22.5%, 3 stars to the next 35%, 2 stars to the next 22.5% and 1 star to the bottom 10%. ETFs and mutual funds are considered a single population. The Overall Rating is derived from a weighted average of the performance figures associated with its 3-, 5-, and 10-year (if applicable) Morningstar Rating metrics. For more information about these ratings, including their methodology, please go to global.morningstar.com/managerdisclosures . Ratings for other share classes may vary and are subject to change monthly. Past performance is no guarantee of future performance.
©2024 Morningstar, Inc. All rights reserved. The information contained herein: (1) is proprietary to Morningstar and/ or its content providers; (2) may not be copied or distributed; and (3) is not warranted to be accurate, complete or timely. Neither Morningstar nor its content providers are responsible for any damages or losses arising from any use of this information.

1128 PRODUCTS
|
Large Value Category
Based on Risk-Adjusted Returns
5 YEAR
(as of 2/29/2024)
Overall, 5 stars, 3-Year, 4 stars, 5-Year, 4 stars, and 10-Year, 5 stars, rated against 1128, 1128, 1069 and 822 products, respectively. Morningstar RatingTM is calculated for products with at least a 3-year history, based on a risk-adjusted return measure (excluding any applicable sale charges) and accounts for variations in a product's monthly performance. 5 stars are assigned to the top 10%; 4 stars to the next 22.5%, 3 stars to the next 35%, 2 stars to the next 22.5% and 1 star to the bottom 10%. ETFs and mutual funds are considered a single population. The Overall Rating is derived from a weighted average of the performance figures associated with its 3-, 5-, and 10-year (if applicable) Morningstar Rating metrics. For more information about these ratings, including their methodology, please go to global.morningstar.com/managerdisclosures . Ratings for other share classes may vary and are subject to change monthly. Past performance is no guarantee of future performance.
©2024 Morningstar, Inc. All rights reserved. The information contained herein: (1) is proprietary to Morningstar and/ or its content providers; (2) may not be copied or distributed; and (3) is not warranted to be accurate, complete or timely. Neither Morningstar nor its content providers are responsible for any damages or losses arising from any use of this information.

1069 PRODUCTS
|
Large Value Category
Based on Risk-Adjusted Returns
10 YEAR
(as of 2/29/2024)
Overall, 5 stars, 3-Year, 4 stars, 5-Year, 4 stars, and 10-Year, 5 stars, rated against 1128, 1128, 1069 and 822 products, respectively. Morningstar RatingTM is calculated for products with at least a 3-year history, based on a risk-adjusted return measure (excluding any applicable sale charges) and accounts for variations in a product's monthly performance. 5 stars are assigned to the top 10%; 4 stars to the next 22.5%, 3 stars to the next 35%, 2 stars to the next 22.5% and 1 star to the bottom 10%. ETFs and mutual funds are considered a single population. The Overall Rating is derived from a weighted average of the performance figures associated with its 3-, 5-, and 10-year (if applicable) Morningstar Rating metrics. For more information about these ratings, including their methodology, please go to global.morningstar.com/managerdisclosures . Ratings for other share classes may vary and are subject to change monthly. Past performance is no guarantee of future performance.
©2024 Morningstar, Inc. All rights reserved. The information contained herein: (1) is proprietary to Morningstar and/ or its content providers; (2) may not be copied or distributed; and (3) is not warranted to be accurate, complete or timely. Neither Morningstar nor its content providers are responsible for any damages or losses arising from any use of this information.

822 PRODUCTS
|
Large Value Category
Based on Risk-Adjusted Returns
Excludes sales charges. If sales charges and taxes had been included, the value would have been lower.

Characteristics

FUND ESSENTIALS
Inception Date 07/22/1996
Net Assets $16.7 billion
Total Operating Expenses 0.97%
Morningstar Category Large Value
Lipper Classification Equity Income Funds
CUSIP 416645844
Fund Number 223
FUND STATS
# of Holdings
72
% in Equities
98
% in Foreign Equities
8
Beta (3 year)
0.82
R Squared (3 year)
0.88
Standard Deviation
15.37%
Turnover- (12/31/2023)
27%
Active Share
70%
Dividend Frequency
Quarterly
Holdings Characteristics
FUND S&P 500 Index
Price/Earnings
15.6x 20.4x
Price/Book
3.2x 4.9x
EPS Growth Rate
11.2% 13.7%
Asset Weighted Market Cap (billions)
$472.3 $793.9
Return on Equity
28.0% 35.4%
Median Market Cap (billions)
$114.8 $33.7
Top Ten Holdings (%)
Microsoft Corp. 5.72
Alphabet, Inc. 4.83
Wells Fargo & Co. 2.89
JP Morgan Chase & Co. 2.69
Apple, Inc. 2.57
UnitedHealth Group, Inc. 2.06
QUALCOMM, Inc. 1.93
Chevron Corp. 1.91
Micron Technology, Inc. 1.89
Cognizant Technology Solutions Corp. 1.88
Total Portfolio % 28.37
Yields (%) (as of 2/29/24)
30-Day SEC Yield
1.21
Unsubsidized 30-Day SEC Yield
1.21
Market Cap Distribution (%)

Market Cap Header3

Less than $2 billion 0
$2 billion - $5 billion 0
$5 billion - $10 billion 1
Greater than $10 billion 99
Not Classified 0
RETURN CHARACTERISTICS
Alpha (5 Year)
-1.22
Down Capture (5 Year)
90.41
Information Ratio (5 Year)
-0.50
Sharpe Ratio (5 Year)
0.63
Up Capture (5 Year)
86.66
Sector Exposure (%)

Exposure Chart Header

FUND
BENCHMARK UNDERWEIGHT / OVERWEIGHT

Exposure Chart Header2

12/31/23 2/29/24 2/29/24 -11 0 11
Financials 17 18 13
Energy 8 8 4
Utilities 5 6 2
Materials 5 4 2
Health Care 15 14 13
Consumer Staples 7 7 6
Real Estate 3 3 2
Communication Services 9 9 9
Industrials 8 8 9
Consumer Discretionary 3 3 11
Information Technology 20 19 30
Based on Global Industry Classification Standard (GICS), which was developed by and is the exclusive property and a service mark of MSCI Inc. (MSCI) and Standard & Poor's, a division of The McGraw-Hill Companies, Inc. (S&P). Excludes cash. May not total to 100% due to rounding and/or pooled vehicle allocations.
distributions and capital gains
Distribution Date Distribution NAV ordinary income short term capital gains long term capital gains total distribution
12/27/2023 32.79 $0.1862 $0.0000 $0.0000 $0.1862
12/11/2023 31.77 $0.0000 $0.0000 $0.1097 $0.1097
9/27/2023 29.98 $0.0758 $0.0000 $0.0000 $0.0758
6/28/2023 30.42 $0.0745 $0.0000 $0.0000 $0.0745
3/29/2023 28.89 $0.0944 $0.0000 $0.0000 $0.0944
Past distributions are not indicative of future distributions.

Fund Literature


12/31/2023 - PDF (242 KB)
This Fund Fact Sheet summarizes the Fund's investment approach, portfolio statistics, top holdings, and current performance.
12/31/2023 - PDF (223 KB)
This Fund Story outlines three distinguishing characteristics to help investors better understand the Fund.
12/31/2023 - PDF (173 KB)
Current quarterly commentary from our sub-adviser, Wellington Management, which includes a performance review, attribution, statistics, and positioning and outlook for the Fund.
12/31/2023 - PDF (347 KB)
Current quarterly commentary from our Sub-adviser, Wellington Management, which includes a performance review, attribution, statistics, and positioning and outlook for the Fund.
12/31/2023 - PDF (172 KB)
Attribution analysis is a method for evaluating the performance of a portfolio compared to the benchmark.
12/31/2023 - PDF (171 KB)
Attribution analysis is a method for evaluating the performance of a portfolio compared to the benchmark.
PDF (157 KB)
A summary of a fund's full-length prospectus that provides key information potential investors should consider before making an investment decision.
12/31/2023 - PDF (643 KB)
This Pitchbook reviews the Fund's investment approach, investment team, investment process, and general portfolio parameters.
PDF (3 KB)
An unaudited financial report, which includes a fund's financial statements. These reports are intended for shareholders and others who have reviewed the fund's prospectus.
PDF (13 KB)
A legal document that discloses essential information about a fund, including investment objectives, risks, fees, expenses, fund manager background and other information.
PDF (3 KB)
An audited financial report, which includes a fund's financial statements. These reports are intended for shareholders and others who have reviewed the fund's prospectus.
PDF (13 KB)
A document that supplements the fund's prospectus with additional information about the fund including its operations and risks.
Important Risks: Investing involves risk, including the possible loss of principal. Security prices fluctuate in value depending on general market and economic conditions and the prospects of individual companies. • For dividend-paying stocks, dividends are not guaranteed and may decrease without notice. • Different investment styles may go in and out of favor, which may cause the Fund to underperform the broader stock market. • Foreign investments may be more volatile and less liquid than U.S. investments and are subject to the risk of currency fluctuations and adverse political, economic and regulatory developments. • To the extent the Fund focuses on one or more sectors, the Fund may be subject to increased volatility and risk of loss if adverse developments occur. • Financially material environmental, social and/or governance (ESG) characteristics are one of several factors that may be considered and as a result, the investment process may not work as intended.
3391215

The material on this site is for informational and educational purposes only. The material should not be considered tax or legal advice and is not to be relied on as a forecast. The material is also not a recommendation or advice regarding any particular security, strategy or product. Hartford Funds does not represent that any products or strategies discussed are appropriate for any particular investor so investors should seek their own professional advice before investing. Hartford Funds does not serve as a fiduciary. Content is current as of the publication date or date indicated, and may be superseded by subsequent market and economic conditions.

Investing involves risk, including the possible loss of principal. Investors should carefully consider a fund's investment objectives, risks, charges and expenses. This and other important information is contained in the mutual fund, or ETF summary prospectus and/or prospectus, which can be obtained from a financial professional and should be read carefully before investing.

Mutual funds are distributed by Hartford Funds Distributors, LLC (HFD), Member FINRA|SIPC. ETFs are distributed by ALPS Distributors, Inc. (ALPS). Advisory services may be provided by Hartford Funds Management Company, LLC (HFMC) or its wholly owned subsidiary, Lattice Strategies LLC (Lattice). Certain funds are sub-advised by Wellington Management Company LLP and/or Schroder Investment Management North America Inc (SIMNA). Schroder Investment Management North America Ltd. (SIMNA Ltd) serves as a secondary sub-adviser to certain funds. HFMC, Lattice, Wellington Management, SIMNA, and SIMNA Ltd. are all SEC registered investment advisers. Hartford Funds refers to HFD, Lattice, and HFMC, which are not affiliated with any sub-adviser or ALPS. The funds and other products referred to on this Site may be offered and sold only to persons in the United States and its territories.

© Copyright 2024 Hartford Funds Management Group, Inc. All Rights Reserved. Not FDIC Insured | No Bank Guarantee | May Lose Value