Pre-Sales Support
Mutual Funds and ETFs - 800-456-7526
Monday-Thursday: 8:00 a.m. – 6:00 p.m. ET
Friday: 8:00 a.m. – 5:00 p.m. ET
Post-Sales and Website Support
888-843-7824
Monday-Friday: 9:00 a.m. - 6:00 p.m. ET
 |
What is inflation? – Inflation is why your groceries cost more today than they did a year ago (and way more than 50 years ago). In technical terms, it’s a rise in the cost of goods and services that ultimately erodes long-term purchasing power. You may hear it referenced in terms of the CPI, or Consumer Price Index. |
 |
Why does it make headlines? – US inflation has been a yearslong fight since the COVID-19 pandemic: Stimulus money helped keep consumer demand high, and supply chains couldn’t keep up. However, even once most supply-and-demand imbalances corrected, widespread inflation has proved sticky. |
 |
How does inflation impact our daily lives? – Swiftly rising prices diminish your purchasing power: Your income may not cover as much as it used to. Higher price tags can be particularly challenging for those on a fixed income because they may need to dig deeper (or more quickly) into their nest egg than planned. |
 |
Who manages inflation? – One of the main goals of the Federal Reserve (the Fed)’s monetary policy is to keep inflation near 2% over the long term. The 2% target is meant to keep inflation gradual and more predictable to help minimize its impact. Over the last 25 years, the average inflation rate was 2.7% (see FIGURE 1). |
 |
What stops inflation? – Supply and demand can balance out on their own and stabilize prices. But when inflation is widespread or climbing too rapidly, the Fed can step in and raise interest rates. In 2022 and 2023, for example, the Fed hiked rates sharply to help fight inflation. As inflation moderated, the focus shifted to how long rates could stay elevated and when policy might become less restrictive. |
 |
How do interest rates impact inflation? – Higher rates help reduce demand. By making borrowing costs higher, both businesses and consumers may rethink taking out a loan or put off major purchases until rates come back down. Cutting rates works the opposite way by helping to encourage borrowing. |
 |
Once inflation normalizes, do prices also decline? – Some items may return to their pre-inflation prices, though often at a slower pace than inflation. But unfortunately, since prices tend to trend upward over time, some may never return to previous lows. That’s part of the Fed’s 2% inflation goal: Gradual inflation shows the economy is growing, but usually at a pace that’s manageable. |
 |
What if prices reverse course sharply? – The Fed strives to maintain a Goldilocks-like balance of inflation that’s neither too high nor too low. If prices decline rapidly, known as deflation, it can be a sign of a weakening economy. Without sufficient demand, companies may end up cutting production and jobs. |
 |
How often has inflation been an issue? – Inflation tends to crop up after wars as the economy returns to a peacetime rhythm. Climbing oil prices are also a common culprit: The 1970s are the most well-known period of lasting inflation, caused by two oil supply-related issues. Oil prices also spurred inflation in the late 1980s and early 1990s, but it wasn’t much of a concern in the US again until 2022. |
|
How could inflation impact my portfolio? – Some asset classes have historically thrived during periods of high inflation. Treasury-Inflation Protected Securities (TIPS) are bonds that can adjust their principal to account for rising or falling inflation (which means their interest payments adjust, too). For equity investors, companies with purchasing power can pass higher costs on to consumers. |
FIGURE 1
Inflation Is Almost Always Present, But Usually Mild
Year-Over-Year Consumer Price Index Growth (%) (2001-2025)
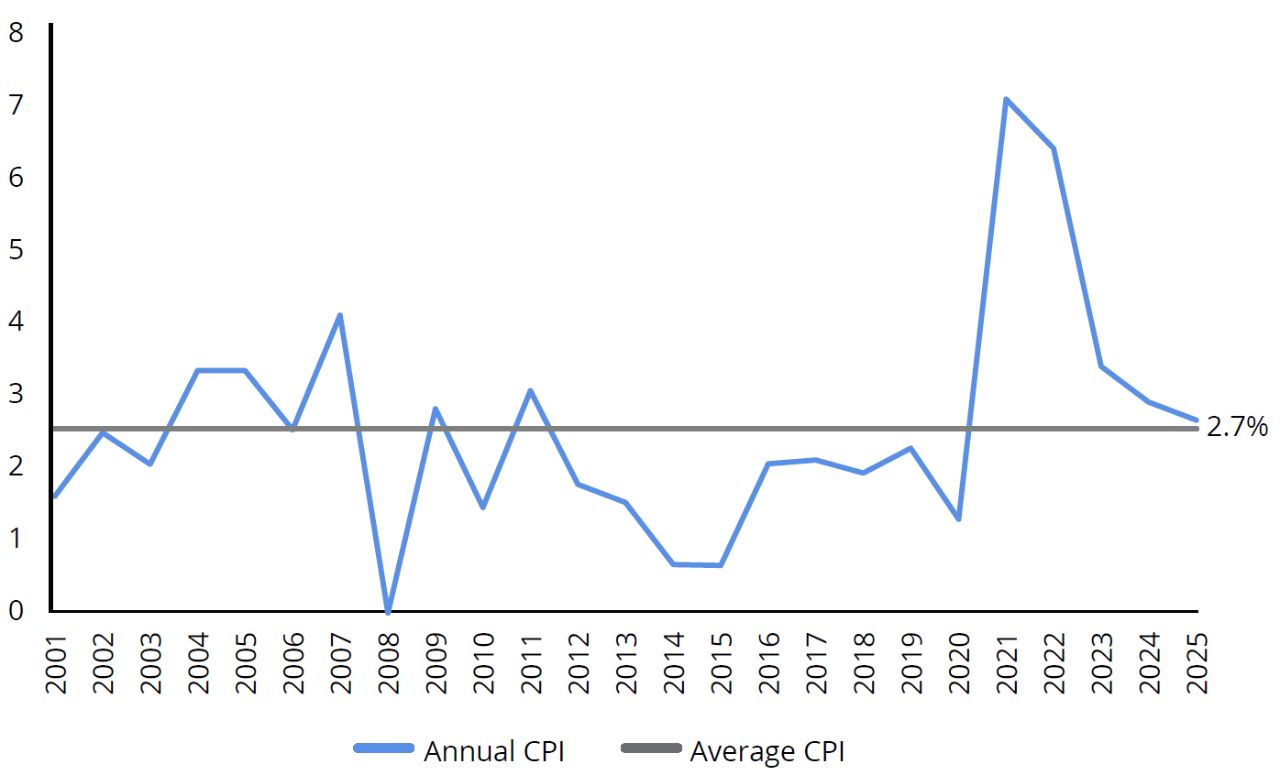
As of 12/31/25. CPI or Consumer Price Index is a measure of change in consumer prices. Sources: Bureau of Labor Statistics and Hartford Funds, 2/26.
Talk to your financial professional about managing the effects of inflation on your portfolio.
Important Risks: Investing involves risk, including the possible loss of principal. • Fixed income security risks include credit, liquidity, call, duration, and interest-rate risk. As interest rates rise, bond prices generally fall. • The value of inflation-protected securities (IPS) generally fluctuates with changes in real interest rates, and the market for IPS may be less developed or liquid, and more volatile, than other securities markets.