
Pre-Sales Support
Mutual Funds and ETFs - 800-456-7526
Monday-Thursday: 8:00 a.m. – 6:00 p.m. ET
Friday: 8:00 a.m. – 5:00 p.m. ET
Post-Sales and Website Support
888-843-7824
Monday-Friday: 9:00 a.m. - 6:00 p.m. ET
Effective as of the close of business on 3/29/19, Class C of the Fund closed to new investors, except as disclosed in the prospectus.
Diversified Sources of Return Across Multiple Perspectives
Hartford Total Return Bond Fund blends top-down strategic planning with bottom-up analysis from skilled portfolio managers ― a combination designed to deliver total return and income to fixed-income investors.
HARTFORD TOTAL RETURN BOND Fund INVESTMENT PROCESS
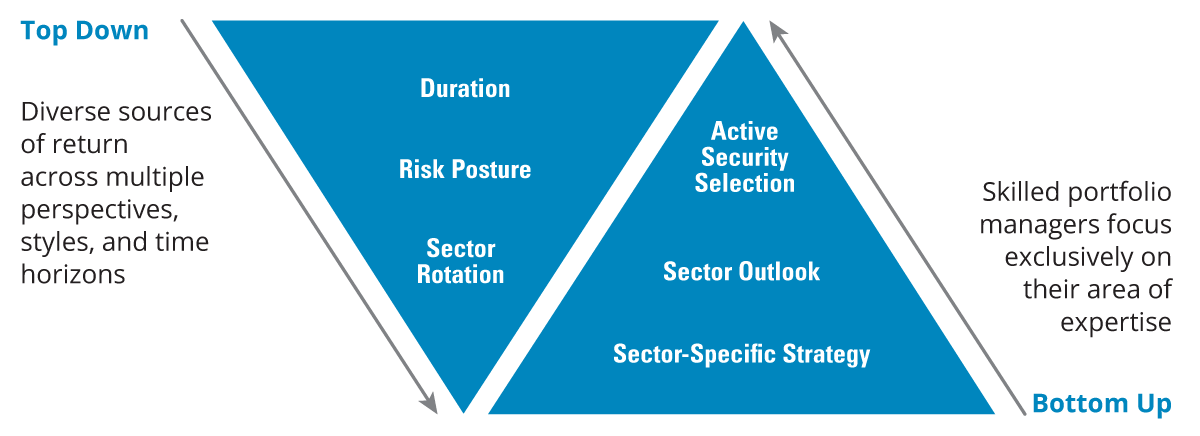
Top-Down Macro Perspective
Portfolio managers gather multiple perspectives and determine strategic investment positioning
Bottom-Up Security Selection
Sector specialists lend their specific expertise to help support active security selection in core bonds with tactical allocations to income-focused sectors
Sub-advised by Wellington
Wellington prioritizes independent thought and collaboration across all major asset classes
Objective: Seeks a competitive total return, with income as a secondary objective.


The portfolio managers are supported by the full resources of Wellington.
Performance
Performance data quoted represents past performance and does not guarantee future results. The investment return and principal value of an investment will fluctuate so that an investor's shares, when redeemed, may be worth more or less than their original cost. Current performance may be lower or higher than the performance data quoted.
SI = Since Inception.
Fund Inception: 07/22/1996
Share Class Inception: 8/31/06.
Class I-share performance prior to its inception date reflects Class A-share performance (excluding sales charges) and operating expenses. SI performance is calculated from 7/22/96.
Characteristics
| Dividend Frequency | Monthly |
|---|---|
| # of Holdings | 1803 |
| Yield to Worst (%) | 5.51% |
|---|---|
| Effective Duration | 6.34 yrs |
| Aaa/AAA | 9 |
| Aa/AA | 73 |
| A | 10 |
| Baa/BBB | 12 |
| Ba/BB | 5 |
| B | 2 |
| Caa/CCC or lower | 1 |
| Not Rated | 4 |
| Cash & Cash Offsets | -15 |
| Uniform Mortgage-Backed Security | 13.50 |
| U.S. Treasury Bonds | 13.36 |
| U.S. Treasury Notes | 13.01 |
| Federal National Mortgage Association | 11.18 |
| Federal Home Loan Mortgage Corp. | 7.93 |
| Government National Mortgage Association | 3.69 |
| U.S. Treasury Inflation-Indexed Notes | 2.17 |
| Pretium Mortgage Credit Partners LLC | 1.98 |
| U.S. Treasury Inflation-Indexed Bonds | 0.80 |
| Oracle Corp. | 0.66 |
| Total Portfolio % | 68.28 |
| Distribution Yield at NAV | 4.29 |
| 30-Day SEC Yield | 4.58 |
|
Unsubsidized 30-Day SEC Yield
|
4.53 |
| Distribution Date | Distribution NAV | ordinary income | short term capital gains | long term capital gains | total distribution |
|---|---|---|---|---|---|
| 6/30/2026 | 9.05 | $0.0324 | $0.0000 | $0.0000 | $0.0324 |
| 5/29/2026 | 9.05 | $0.0327 | $0.0000 | $0.0000 | $0.0327 |
| 4/30/2026 | 9.05 | $0.0317 | $0.0000 | $0.0000 | $0.0317 |
| 3/31/2026 | 9.06 | $0.0317 | $0.0000 | $0.0000 | $0.0317 |
| 2/27/2026 | 9.27 | $0.0301 | $0.0000 | $0.0000 | $0.0301 |
| 1/30/2026 | 9.16 | $0.0292 | $0.0000 | $0.0000 | $0.0292 |
| 12/31/2025 | 9.16 | $0.0327 | $0.0000 | $0.0000 | $0.0327 |
| 12/29/2025 | 9.19 | $0.0315 | $0.0000 | $0.0000 | $0.0315 |
| 12/17/2025 | 9.19 | $0.0000 | $0.0000 | $0.0000 | $0.0000 |
| 11/28/2025 | 9.26 | $0.0324 | $0.0000 | $0.0000 | $0.0324 |
| 10/31/2025 | 9.24 | $0.0324 | $0.0000 | $0.0000 | $0.0324 |
| 9/30/2025 | 9.21 | $0.0318 | $0.0000 | $0.0000 | $0.0318 |
| 8/29/2025 | 9.12 | $0.0326 | $0.0000 | $0.0000 | $0.0326 |
| 7/31/2025 | 9.03 | $0.0319 | $0.0000 | $0.0000 | $0.0319 |
Insights
Resources
BLOOMBERG® and any Bloomberg Index are service marks of Bloomberg Finance L.P. and its affiliates, including Bloomberg Index Services Limited ("BISL"), the administrator of the indices (collectively, "Bloomberg") and have been licensed for use for certain purposes by Hartford Funds. Bloomberg is not affiliated with Hartford Funds, and Bloomberg does not approve, endorse, review, or recommend any Hartford Funds product. Bloomberg does not guarantee the timeliness, accurateness, or completeness of any data or information relating to Hartford Funds products.


