


• Products
  • Insights
  • Practice Management
  • Resources
  • About Us

The macro backdrop has become more demanding for investors. Bond yields have risen sharply as stubborn inflation, higher energy prices, and government debt concerns have driven hawkish monetary-policy expectations.

At the same time, enthusiasm around AI has continued to support investment, anticipated productivity gains, and corporate earnings. Together, these forces have helped sustain the equity rally even in the face of higher rates.

Looking ahead over the next 12 months, we remain broadly constructive but less emphatically so. We think the balance of risks has weakened, prompting us to temper equity exposure while finding more value in government bonds. In this quarter’s outlook, we consider where the rally may still have room to run—and where rising yields, market concentration, and other forces may call for selectivity.


Equities Have Momentum, but the Bar Is Rising

We’ve pared back our view on global equities from overweight to moderately overweight. Despite exceptional second-quarter earnings, continued support from AI infrastructure spending, and healthy earnings breadth, the near-term risk-reward trade-off has deteriorated. The bar for upside surprises in earnings is now much higher, and the speed and level of the rise in yields present some risks.

We remain largely positive on the AI capital-expenditure (capex)4 cycle and its impact on earnings, with demand for compute still far outstripping supply. That said, we recognize that earnings have been running above trend and expect their exceptionally strong growth rates to decelerate.

One concern is that while earnings growth has broadened, market breadth has deteriorated. Market concentration in AI-related stocks, which are exposed to a potentially cyclical capital-spending boom, is driving a reluctance to assume current earnings expectations will be fully realized. Together with higher rates, these concerns have driven a contraction of approximately 15% in global-equity valuation multiples this year (FIGURE 1).
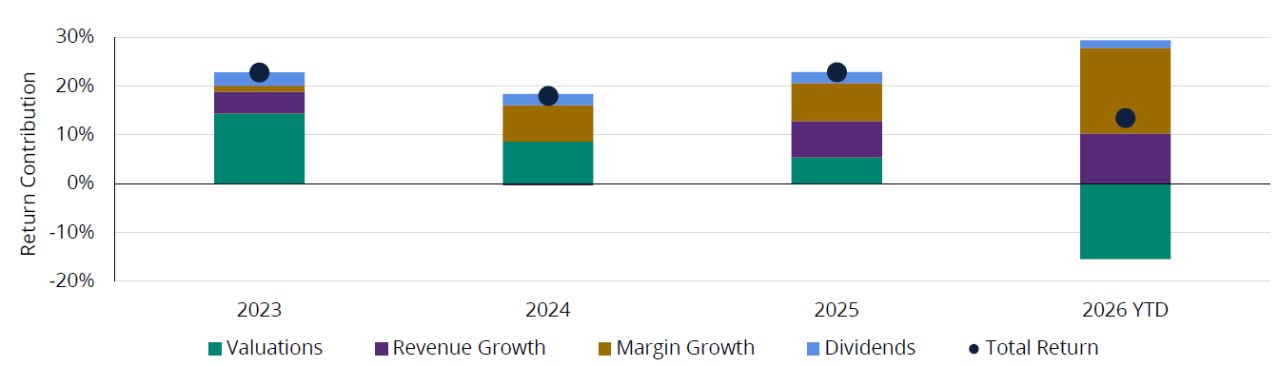
 

FIGURE 1

Earnings Have Replaced Valuations as the Driver of the Bull Market
Equity Return Decomposition for the MSCI ACWI Index

As of 9/30/26. Past performance does not guarantee future results. Indices are unmanaged and not available for direct investment. Equity return decomposition is based on changes in 12-month forward price/earnings, 12-month forward sales, and 12-month forward earnings per share in USD. The price-to-earnings ratio measures a company’s share price relative to its earnings-per-share and helps assess the relative value of a company’s stock. Earnings per share measures how much profit a company makes per share of common stock. MSCI ACWI Index is a free float-adjusted market capitalization index that measures equity market performance in the global developed and emerging markets, consisting of developed and emerging market country indices. For illustrative purposes only. Sources: Wellington Management, FactSet, and Refinitiv.

Our Multi-Asset Views

Asset ClassViewChange
Global EquitiesModerately OWdownarrow
Developed-Market (DM) Government BondsModerately OW—
Credit SpreadsNeutral—
CommoditiesNeutraldownarrow
CashUnderweight—
Within Asset Classes  
Global Equities  
USNeutral—
Europe ex-UKNeutraluparrow
UKModerately UW—
Asian DMsNeutral—
EMsModerately OWdownarrow
DM Government Bonds
US GovernmentModerately OWuparrow
Eurozone GovernmentUnderweightdownarrow
UK GovernmentModerately OWuparrow
Japan GovernmentNeutraldownarrow
Credit Spreads
Global Investment-Grade CreditNeutral—
Global High YieldNeutral—
EM DebtNeutral—

OW = overweight, UW = underweight

Views have a 6–12-month horizon and are those of the authors and Wellington’s Investment Strategy Team. Views are as of September 2026, are based on available information, and are subject to change without notice. Individual portfolio management teams may hold different views and may make different investment decisions for different clients. This is not to be construed as investment advice or a recommendation to buy or sell any specific security.

It’s also worth noting that higher yields aren’t inherently bearish for equities. Higher yields driven by stronger growth can generally be absorbed, while those driven by oil prices, inflation, or a higher term premium are more problematic, particularly if the increase is rapid. So far, the rate volatility has been reflected more in churn beneath the surface of the equity market.

Over the next few weeks and months, we’ll be looking for some combination of strength in third-quarter earnings, stabilization in oil prices and long-term yields, easing in geopolitical risk, and limited risk of further monetary policy tightening. Alternatively, a meaningful equity correction without a deterioration in earnings could present a more attractive entry point.

Consistent with our broader equity stance, we’ve reduced our view on EM equities from overweight to moderately overweight, funded by a smaller underweight view on UK equities. Higher oil prices and US yields leave some EM equities with less scope for policy support, while earnings growth remains increasingly concentrated in Asian AI beneficiaries rather than reflecting a broad EM recovery. China and India have lagged the broader EM rally year to date, while Latin America has become more dependent on commodity prices and political outcomes in Brazil. On the other hand, the UK could benefit from more resilient energy-driven earnings and continued merger-and-acquisition activity supported by cheap valuations.

We’re neutral on Japan. The market has seen broad-based earnings strength, reflected in upgrades across banks and industrials, as well as semiconductors and AI-linked segments. A stronger yen could create winners and losers within the market, rather than lead to broad weakness. However, significant macroeconomic and policy uncertainty is keeping us on the sidelines.

US equity valuations have contracted substantially, reflecting some skepticism about the strength of earnings, with the sharp rise in real rates providing an additional headwind. Continued earnings strength and a stabilization in bond yields could lead us to turn more bullish here.


Higher Yields Reshape the Fixed-Income Outlook

Global yields have continued to grind higher, in certain instances revisiting multi-decade highs as markets contend with persistent inflation, a robust cycle, and growing fiscal concerns. The economy and labor market have been more resilient than expected, giving some central banks flexibility to address inflation via rate hikes without unduly weakening economic growth.

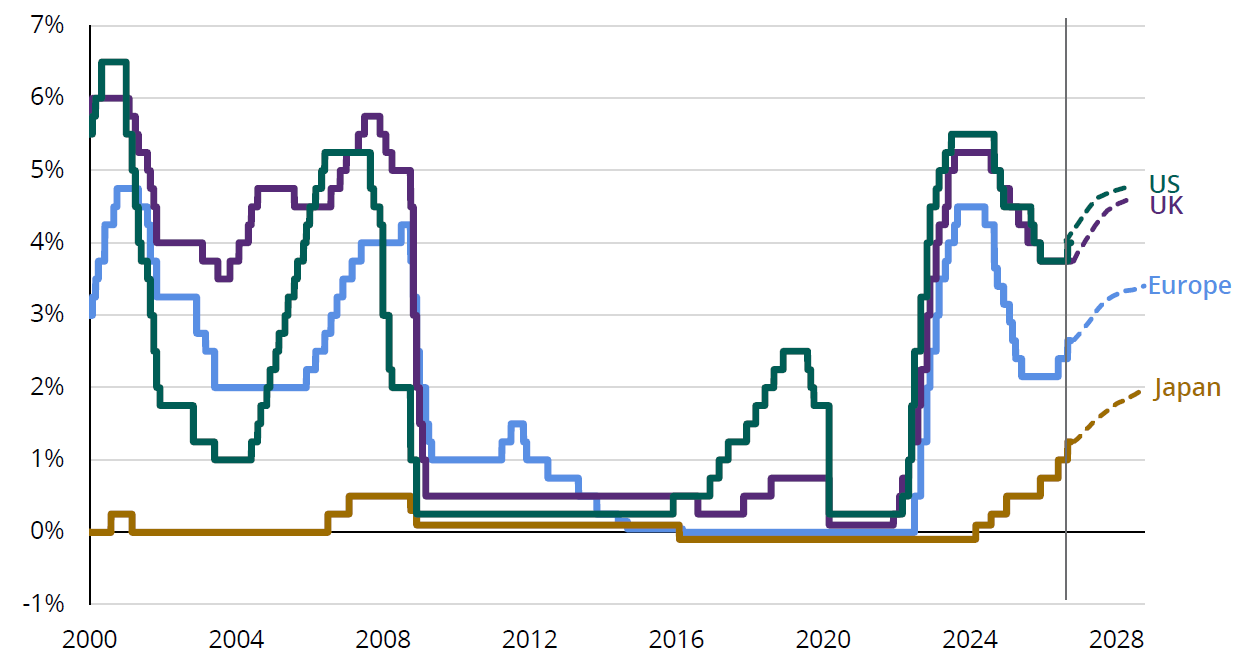
While repricing of policy expectations has weighed on fixed-income returns, markets may be pricing in more rate hikes than central banks will ultimately deliver (FIGURE 2). This could be particularly true if the Iran war is resolved and energy supplies are rapidly restored, bringing inflation down faster than anticipated. Still, upward pressure on rates has pushed nominal and real yields to increasingly attractive levels, improving the prospective return outlook for government bonds and supporting our constructive view on the asset class.

Our Multi-Asset Views

Asset ClassViewChange
Global EquitiesModerately OWdownarrow
Developed-Market (DM) Government BondsModerately OW—
Credit SpreadsNeutral—
CommoditiesNeutraldownarrow
CashUnderweight—
Within Asset Classes  
Global Equities  
USNeutral—
Europe ex-UKNeutraluparrow
UKModerately UW—
Asian DMsNeutral—
EMsModerately OWdownarrow
DM Government Bonds
US GovernmentModerately OWuparrow
Eurozone GovernmentUnderweightdownarrow
UK GovernmentModerately OWuparrow
Japan GovernmentNeutraldownarrow
Credit Spreads
Global Investment-Grade CreditNeutral—
Global High YieldNeutral—
EM DebtNeutral—

OW = overweight, UW = underweight

Views have a 6–12-month horizon and are those of the authors and Wellington’s Investment Strategy Team. Views are as of September 2026, are based on available information, and are subject to change without notice. Individual portfolio management teams may hold different views and may make different investment decisions for different clients. This is not to be construed as investment advice or a recommendation to buy or sell any specific security.

FIGURE 2

Markets Price in Inflation as Central Banks Start to Tighten
Policy Rates and Next 2-Year Expectations

Chart Data: 1/31/00-10/31/28. Forecast beginning 11/30/26, based on interest-rate expectations implied by overnight index swaps. Overnight index swap captures market expectations for future overnight interest rates and are often used as a benchmark for policy‑rate pricing. For illustrative purposes only. Sources: Wellington and Refinitiv.

Entry yields are a key driver of long-term total returns, and we think today’s elevated levels offer a more compelling starting point than investors have enjoyed for much of the past decade. They currently provide attractive carry5 and may create potential for capital appreciation in certain sectors if growth moderates or inflation eases more quickly than expected. Higher yields could also improve the ability of government bonds to serve as a portfolio diversifier and potentially help offset equity-market weakness in a slower-growth environment. However, diversification does not ensure a profit or protect against a loss in a declining market.

Globally, differences in the pricing of fiscal risks (and any missteps by central banks as they take action) could lead to relative value opportunities. We maintain our moderately overweight view on developed-market government bonds overall but are becoming more selective across regions to capitalize on this dispersion potential.

We moved from neutral to a moderately overweight view on US and UK government bonds. Yield levels look attractive given the potential for economic growth to moderate, which could support longer-duration6 bonds. By contrast, we moved from neutral to an underweight view on eurozone government bonds, where ongoing fiscal concerns and elevated issuance may continue to weigh on valuations. We’ve moved to neutral on Japanese government bonds.

AI-related capex needs are increasingly being financed through credit markets.

Within credit, we continue to have a neutral stance. While all-in yields are attractive and spreads have widened somewhat recently, they offer limited compensation for downside risks. AI-related capex needs are increasingly being financed through credit markets, with AI-related issuance accounting for a meaningful share of overall year-to-date fixed-income issuance. We’re monitoring the extent to which this creates technical headwinds, AI concentration risk, and greater dispersion across issuers over time. Overall, the risk-reward profile appears balanced, which we think warrants a neutral view.


Geopolitics Muddy the Picture for Commodities

We’ve moved our view on oil from overweight to neutral. Oil markets face a near-term deficit of about five million barrels per day, even as flows through the Strait of Hormuz have increased. Physical energy flows have been more resilient than expected, although diesel and refined-product supplies have been more disrupted. We also expect the market to shift to a surplus over the medium term, while many countries have already drawn down inventories substantially. With geopolitics rather than fundamentals driving the market, the binary nature of the risks limits our conviction. Rates of carry on offer due to a sharply downward-facing futures curve (i.e., the contract price for delivery of oil in the future is lower than the current spot price) are very attractive in our view, but we’re reluctant to lean toward long positions at current oil prices.

We maintain our neutral view on gold. We think the precious metal could play an important role in long-term portfolio construction, particularly as a potential diversifier during periods of dollar debasement. Over the shorter term, however, high real rates and further central-bank tightening present a less favorable backdrop. Turning to flows, ETF demand for gold has recovered from its lows, while central-bank buying remains positive but uneven.


Investment Implications

  • Diversification opportunities may be increasing — As the effects of AI, higher oil prices, rising yields, and policy uncertainty create greater dispersion across regions, sectors, and individual securities, we think active positioning may add more value than broad market exposure.
  • AI remains a constructive theme, though equity returns may moderate — AI investment and productivity gains continue to underpin our positive view on the economic and earnings cycles, although we believe the pace of earnings could decelerate following a period of exceptional growth. We see more moderate upside for global and EM equities, with earnings remaining the primary driver of returns.
  • Duration may warrant a closer look as real yields rise — Markets have shifted from pricing central-bank easing to pricing broadly synchronized tightening, pushing real yields higher. We think this repricing is overdone and has left global government bonds at attractive valuations. Regional divergences in yields may also create opportunities for active positioning.
  • Tight spreads continue to favor a selective approach in credit — Spreads have widened somewhat, but we find little value at current levels. We think European credit has better fundamentals than the US in terms of debt service and leverage, and it’s more insulated from significant US issuance. In EM debt, opportunities appear more likely to come from country selection opportunities than broad market exposure.


Talk to your financial professional about how to position your portfolio amid a changing economic landscape. 


1 Spreads are the difference in yields between two fixed-income securities with the same maturity but originating from different investment sectors.

2 The term premium is the amount by which the yield on a long-term bond is greater than the yield on shorter-term bonds. This premium reflects the amount investors expect to be compensated for lending for longer periods.

3 Stagflation is an economic cycle characterized by slow growth, inflation, and signs of labor market weakness.

4 Capital expenditures are the money a company spends to buy or upgrade long-term assets such as buildings or equipment.

5 Carry is the return an investor earns from holding an asset, typically from interest or yield, after accounting for financing or holding costs.

6 Duration is a measure of the sensitivity of an investment’s price to nominal interest-rate movement.

Important Risks: Investing involves risk, including the possible loss of principal. • Foreign investments may be more volatile and less liquid than U.S. investments and are subject to the risk of currency fluctuations and adverse political, economic and regulatory developments. These risks may be greater, and include additional risks, for investments in emerging markets or if focused in a particular geographic region or country. • Fixed income security risks include credit, liquidity, call, duration, and interest-rate risk. As interest rates rise, bond prices generally fall. • Investments in high-yield (“junk”) bonds involve greater risk of price volatility, illiquidity, and default than higher-rated debt securities. • Investments in the commodities market may increase liquidity risk, volatility and risk of loss if adverse developments occur. • Investments in the technology sectors may go in and out of favor, which may cause underperformance.

The views expressed here are those of the authors and are based on available information and are subject to change without notice. This information should not be considered as investment advice or a recommendation to buy/sell any security. In addition, it does not take into account the specific investment objectives, tax and financial condition of any specific person. Portfolio positioning is at the discretion of the individual portfolio management teams; individual portfolio management teams and different fund sub-advisers may hold different views and may make different investment decisions for different clients or portfolios. This material and/or its contents are current as of the time of writing and may not be reproduced or distributed in whole or in part, for any purpose, without the express written consent of Wellington Management or Hartford Funds.


WP926 5729064
Insight from sub-adviser Wellington Management
Supriya Menon
Multi-Asset Portfolio Manager
Author Headshot
Product Reporting Lead

The material on this site is for informational and educational purposes only. The material should not be considered tax or legal advice and is not to be relied on as a forecast. The material is also not a recommendation or advice regarding any particular security, strategy or product. Hartford Funds does not represent that any products or strategies discussed are appropriate for any particular investor so investors should seek their own professional advice before investing. Hartford Funds does not serve as a fiduciary. Content is current as of the publication date or date indicated, and may be superseded by subsequent market and economic conditions.

Investing involves risk, including the possible loss of principal. Investors should carefully consider a fund's investment objectives, risks, charges and expenses. This and other important information is contained in the mutual fund, or ETF summary prospectus and/or prospectus, which can be obtained from a financial professional and should be read carefully before investing.

Mutual funds are distributed by Hartford Funds Distributors, LLC (HFD), Member FINRA|SIPC. ETFs are distributed by ALPS Distributors, Inc. (ALPS). Advisory services may be provided by Hartford Funds Management Company, LLC (HFMC) or its wholly owned subsidiary, Lattice Strategies LLC (Lattice). Certain funds are sub-advised by Wellington Management Company LLP and/or Schroder Investment Management North America Inc (SIMNA). Schroder Investment Management North America Ltd. (SIMNA Ltd) serves as a secondary sub-adviser to certain funds. HFMC, Lattice, Wellington Management, SIMNA, and SIMNA Ltd. are all SEC registered investment advisers. The funds and other products referred to on this Site may be offered and sold only to persons in the United States and its territories.

Hartford Funds refers to HFD, Lattice, and HFMC, which are currently not affiliated with any sub-adviser or ALPS.

On June 3, 2026, The Hartford Insurance Group, Inc. (“The Hartford”) and Wellington announced that they had reached a definitive agreement under which Wellington Investment Advisors Holdings, LLP, Wellington’s corporate parent, will acquire Hartford Funds. Upon closing Hartford Funds will be integrated into Wellington’s U.S. Wealth business. The deal is expected to close in the first quarter of 2027, subject to regulatory and fund approvals. Upon closing, Hartford Funds would become an affiliate of Wellington. For more information, click here.

© Copyright 2026 Hartford Funds Management Group, Inc. All Rights Reserved. Not FDIC Insured | No Bank Guarantee | May Lose Value