
Pre-Sales Support
Mutual Funds and ETFs - 800-456-7526
Monday-Thursday: 8:00 a.m. – 6:00 p.m. ET
Friday: 8:00 a.m. – 5:00 p.m. ET
Post-Sales and Website Support
888-843-7824
Monday-Friday: 9:00 a.m. - 6:00 p.m. ET
Inflation has varied widely from decade to decade, shaping investor outcomes more in some periods than others. Even so, stocks have historically been the most effective way investors have stayed ahead of inflation over the long term, though they may experience periods of significant volatility. Bonds have tended to play a stabilizing role, helping balance those swings while delivering stronger returns than cash over time.
FIGURE 1
Stocks and Bonds Have Most Consistently Outperformed Inflation
Stock, Bond, and Cash Returns vs. Inflation by Decade
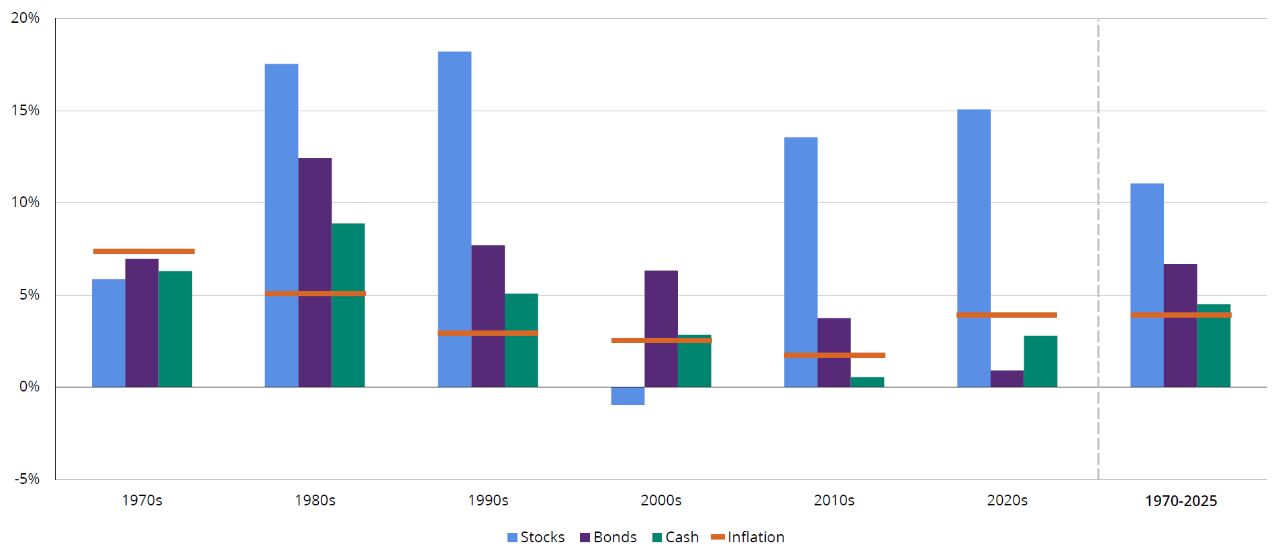
Chart Data: 1970-2025. Past performance does not guarantee future results. Indices are unmanaged and not available for direct investment. Please see below for representative index definitions. For illustrative purposes only. Data Sources: Morningstar and Hartford Funds, 4/26.
When returns are adjusted for rising prices, the differences between stocks, bonds, and cash become even clearer over time.
FIGURE 2
Inflation Can Eat Away Your Returns
Inflation-Adjusted Average Annual Returns, Based on Long-Term Average Inflation (3.92%)
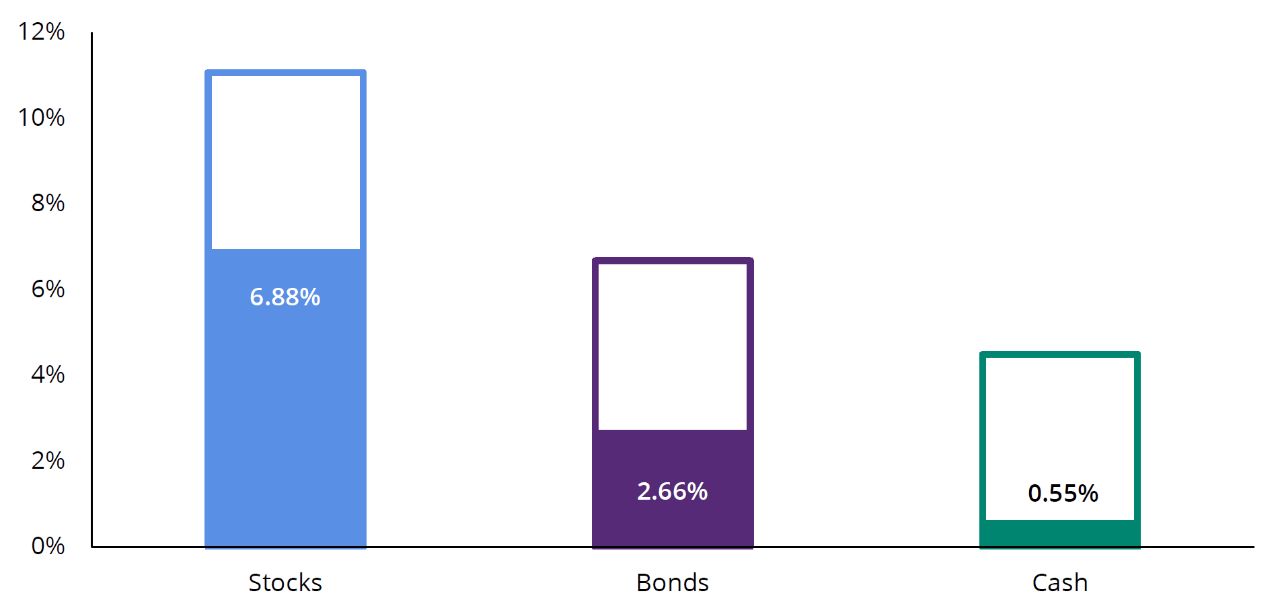
Chart Data: 1970-2025. Past performance does not guarantee future results. Indices are unmanaged and not available for direct investment. The average annual return for inflation (as measured by the CPI, a measure of change in consumer prices as determined by the US Bureau of Labor Statistics) during this period was 3.92%. For illustrative purposes only. Data Sources: Morningstar and Hartford Funds, 4/26.
Talk to your financial professional about how a diversified asset class mix can help manage inflation.
Stocks are represented by the S&P 500 Index from 1970 to 2025. The S&P 500 Index is a market capitalization-weighted price index composed of 500 widely held common stocks. Returns for 1950 to 1969 are calculated by Ibbotson and are represented by the SBBI US Large Stock Index, which measures the performance of the US large-cap equity market. Bonds are represented by the Bloomberg US Aggregate Bond Index from 1975 to 2025. The Bloomberg US Aggregate Bond Index is composed of securities that cover the US investment-grade fixed-rate bond market, with index components for government and corporate securities, mortgage pass-through securities, and asset-backed securities. Returns for 1950 to 1975 are calculated by Ibbotson and are represented by the SBBI LT Government Index, which measures the performance of a single issue of outstanding US Treasury notes with a maturity term of around 5.5 years. Cash is represented by the Ibbotson SBBI US 30 Day Treasury Bill Index through 1/30/91, and by the Bloomberg US Treasury Bill 1–3 Month Index thereafter. The Ibbotson SBBI US 30 Day Treasury Bill Index is an unweighted index that measures the performance of one-month maturity US Treasury Bills. The Bloomberg US Treasury Bill 1–3 Month Index measures the performance of public obligations of the US Treasury with remaining maturities of one to three month.
Important Risks: Investing involves risk, including the possible loss of principal. • Fixed income security risks include credit, liquidity, call, duration, and interest-rate risk. As interest rates rise, bond prices generally fall. • Diversification does not ensure a profit or protect against a loss in a declining market.
This material is provided for educational purposes only.
This information has been prepared from sources believed reliable but the accuracy and completeness of the information cannot be guaranteed.
This information should not be considered investment advice or a recommendation to buy/sell any security or tax advice. In addition, it does not take into account the specific investment objectives, tax, and financial condition of any specific person. Investors should consult with their own financial professional for additional information.


