
Pre-Sales Support
Mutual Funds and ETFs - 800-456-7526
Monday-Thursday: 8:00 a.m. – 6:00 p.m. ET
Friday: 8:00 a.m. – 5:00 p.m. ET
Post-Sales and Website Support
888-843-7824
Monday-Friday: 9:00 a.m. - 6:00 p.m. ET
Market Performance Tends to Be Positive 3 Months After Midterm Elections
S&P 500 Index (% Returns)
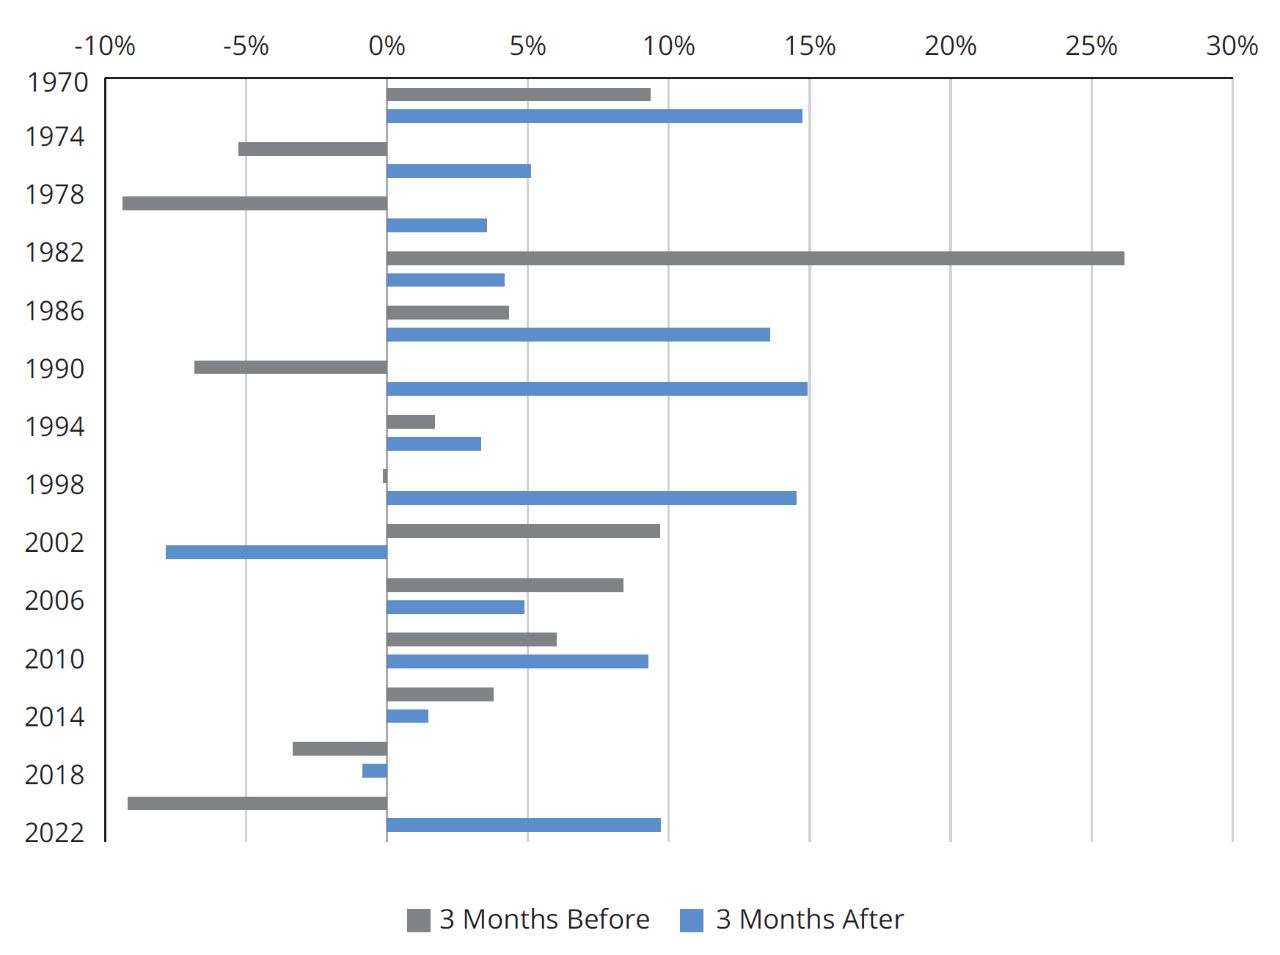
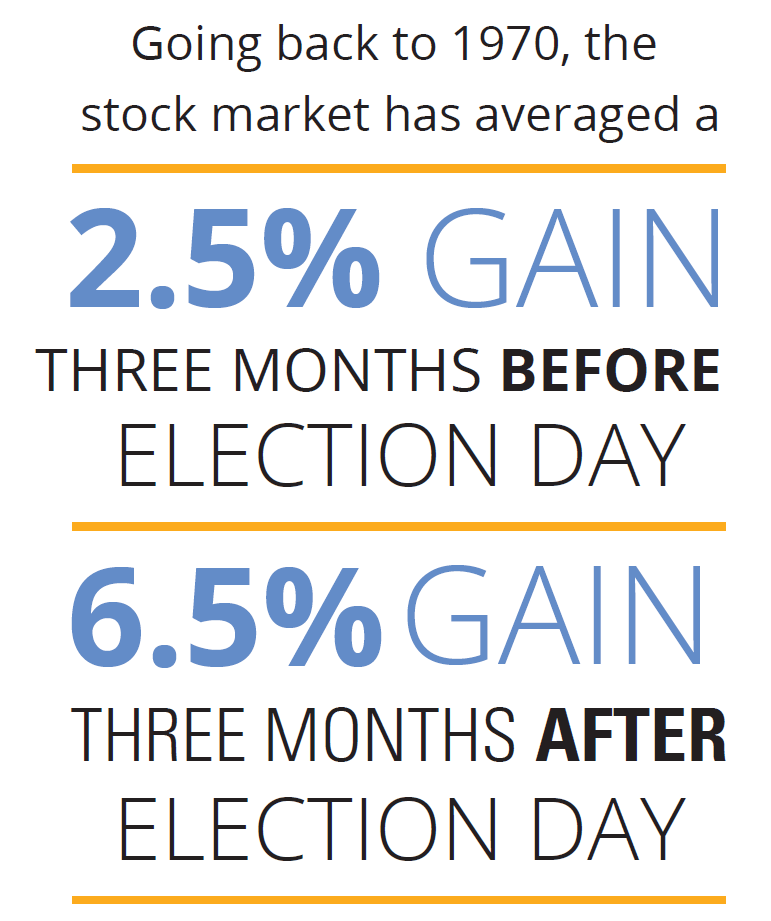
Chart Data: 1970-2023. Past performance does not guarantee future results. The Index is unmanaged and not available for direct investment. For illustrative purposes only. Data Source: Morningstar, 3/26.
What Drives Markets More Than Politics?
Though elections can make investors anxious, market returns are more dependent on corporate earnings, the economic outlook, and investor sentiment than election outcomes.
A financial professional can help you build a portfolio that’s right for you despite political uncertainty.
S&P 500 Index is a market capitalization-weighted price index composed of 500 widely held common stocks.
Investing involves risk, including the possible loss of principal.


