10 Worst Market Drawdowns Since the 1960s
| Returns (%) After Reaching Bottom | ||||||
|---|---|---|---|---|---|---|
| Cause | Max Drawdown | # of Months To Hit Bottom |
# of Months To Break Even |
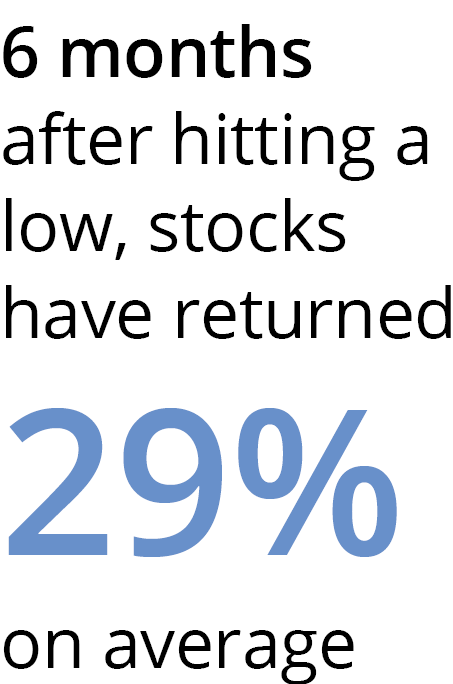
After 6 Months | After 1 Year | After 3 Years |
| Kennedy Slide/Flash Crash (1961–1962) | -27.97 | 6 | 14 | 20.45 | 32.66 | 16.65 |
| Vietnam Worries (1968–1970) | -36.06 | 18 | 21 | 22.80 | 43.73 | 15.92 |
| Nixon Shock (1973–1974) | -48.15 | 21 | 69 | 29.74 | 39.36 | 15.49 |
| Rate Hikes to Fight Inflation (1980–1982) | -27.11 | 20 | 3 | 44.14 | 58.33 | 22.35 |
| Black Monday (1987) | -33.51 | 3 | 20 | 19.26 | 22.78 | 13.69 |
| Iraq Invaded Kuwait (1990) | -19.92 | 3 | 4 | 27.81 | 29.10 | 15.97 |
| Dot-com Bubble Burst (2000–2002) | -49.15 | 31 | 56 | 11.49 | 33.73 | 15.47 |
| Global Financial Crisis (2007–2009) | -56.78 | 17 | 49 | 52.75 | 68.57 | 26.54 |
| COVID-19 Pandemic (2020) | -33.93 | 1 |
5 |
44.67 |
74.78 |
20.86 |
| Inflation Returns (2022) | -25.30 | 9 | 15 | 15.48 | 22.06 | -- |
| Average | -35.79 | 13 | 26 | 28.86 | 42.51 | 18.11 |
As of 12/31/24. Past performance does not guarantee future results. A drawdown measures a peak-to-trough decline in the market. Returns for less than one year are not annualized. Indices are unmanaged and not available for direct investment. Data shown is for the S&P 500 Price Index, which is a market capitalization-weighted price index composed of 500 widely held common stocks, and does not include the reinvestment of dividend payments. Data Sources: Morningstar and Hartford Funds, 3/25.
Talk to your financial professional to learn more about maintaining perspective during times of volatility.

Investing involves risk, including the possible loss of principal.
CCWP123 4314835


